


Insights and Observations
Economic, Public Policy, and Fed Developments
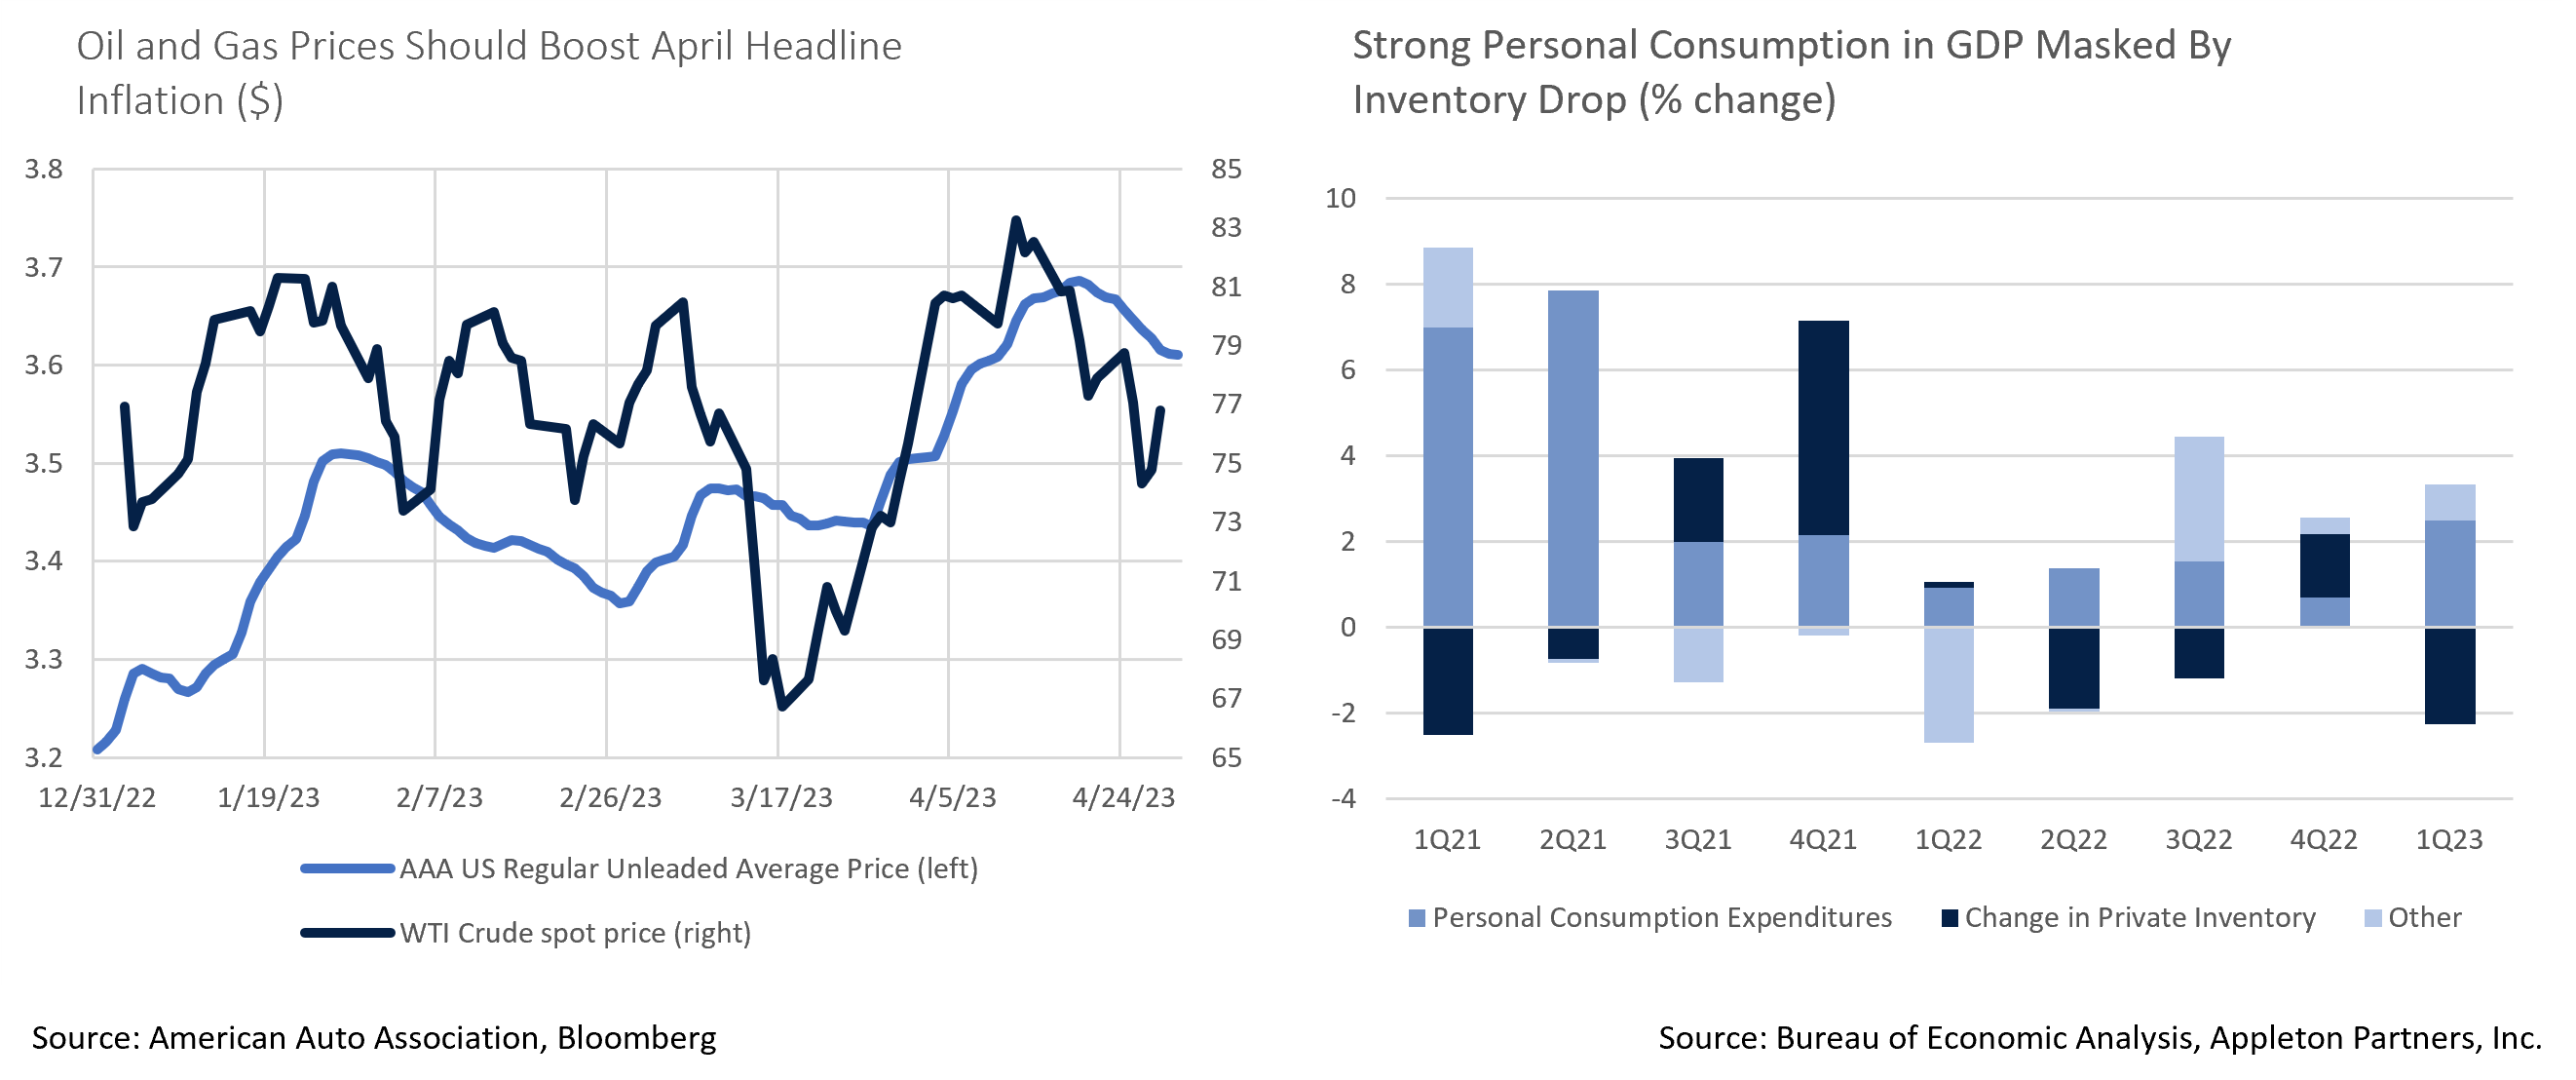
- Q1 GDP missed, +1.1% vs. +1.9%, yet below the surface it was a fairly strong report. After a persistent build-up over the last two years, a sizable drop in inventory levels detracted 2.26% from quarterly growth as consumption exceeded production. Underlying consumer demand was very solid; personal consumption rose a robust 3.7%, while final sales to private domestic purchasers grew 2.9%. Both values are the highest since the first half of 2021, a period marked by the post-Covid reopening trade. While this report covered a period largely before the banking sector turmoil, it suggests the economy was on solid footing at that time.
- A point in March’s inflation reports worthy of attention is the impact of oil and gas price fluctuations on the headline numbers. While low headline inflation was embraced by bulls in March (notably, headline PPI fell a whopping -0.5%), those figures were pulled down as oil prices fell steeply at the end of February; the release notes energy inflation was responsible for 80% of the decline. Prices recovered late in March and are now at or above prevailing YTD levels. Gas prices failed to match the depth of March’s oil decline but rose in line in April as well. With inflation based on a monthly average of prices, recent improvements in headline inflation should more than reverse in April. The Federal Reserve will look through headline inflation to the core and “super-core” numbers, although these headline inflation accelerations may still impact the market narrative.
- The market is now paying more attention to the debt ceiling fight. While Speaker McCarthy’s bill passing the House would normally be encouraging, it would roll back much of the Biden Administration’s legislative accomplishments in return for a mere nine-month extension. It will not survive the Senate or a Presidential veto, and with a final vote of 217-215, McCarthy has little room to maneuver. Secretary Yellen updated her debt ceiling deadline estimate to early June; if the Treasury can stretch this to the middle of the month corporate tax receipts will buy additional time, but with Congress in session for only two weeks in May the risks of a misstep are higher than the market now appreciates.
- The May FOMC meeting went largely as expected, with the Federal Reserve hiking rates by 0.25% to 5.00-5.25%. The accompanying statement opened the door for a pause in June, though in his press conference Chairman Powell stressed no decision had been made and that assessing bank turmoil-related credit tightening would be important going forward. After a lengthy hiking campaign, the Fed has become data dependent. Markets expect a pause, followed by three cuts before year-end; we expect a hotter economy than consensus for the reasons outlined above and would not rule out a further hike.
- We also don’t expect the Fed to cut even if a recession materializes, simply because they have indicated they won’t. The March FOMC Summary of Economic Projections called for 0.4% GDP growth in 2023, and with Q1 forecasted at over 2% at that time, mathematically this indicates negative growth later in the year. However, this forecast did not stop the Fed from hiking in both March and May, and in an otherwise placid press conference Powell pushed back aggressively on the possibility of rate cuts in 2023. The Fed has been explicitly targeting demand destruction for some time as a means of sustainably dampening inflation; it does not make sense to expect that a weakening economy would cause them to change course. Every other time the market and the Fed have disagreed over this cycle, the Fed eventually won; we expect the same to happen here.
From the Trading Desk
Municipal Markets
- After yields fell throughout the first half of April, the market significantly corrected towards the end of the month. This was not surprising given that rich Muni/UST ratios have been persistent for some time. Markets were further aggravated by an increase in net outflows (-$5.9B YTD), elevated supply, and modestly widening high grade credit spreads.
- Municipal underperformance resulted in an uptick of 5 and 10-year Muni/UST ratios which closed April at 67% and 68% respectively, while 30-year ratios bumped up to 92%. The front end of the curve remains expensive, and we do not see this changing until yields are more competitive with short USTs.
- Municipals gave back much of the prior month’s gains at the tail end of April with shorter maturities faring worse than longer issues. Long maturities have gained almost 4% YTD, while intermediate bonds have returned +2.5%, and bonds maturing inside of 4 years <1%. Short-term borrowing costs have been volatile as demonstrated by the SIFMA Municipal Swap Index. SIFMA yields, which are largely driven by technical factors, have ranged from a 2023 low of 1.66% to a high of 4.35% in March, a dynamic that has unsettled the shorter portion of the curve.
- 30-day visible supply has increased but remains weak as YTD issuance lags 2022 by 20-25%. However, roughly $7.4B is expected to come to market as the SVB and Signature Bank municipal portfolios are liquidated, although only 10% is expected to offer 4 or 5% coupons, and a good deal of the inventory are longer maturities. While most of these bonds fall outside our buying preferences, this supply will provide valuable price discovery.
Corporate Bond Markets
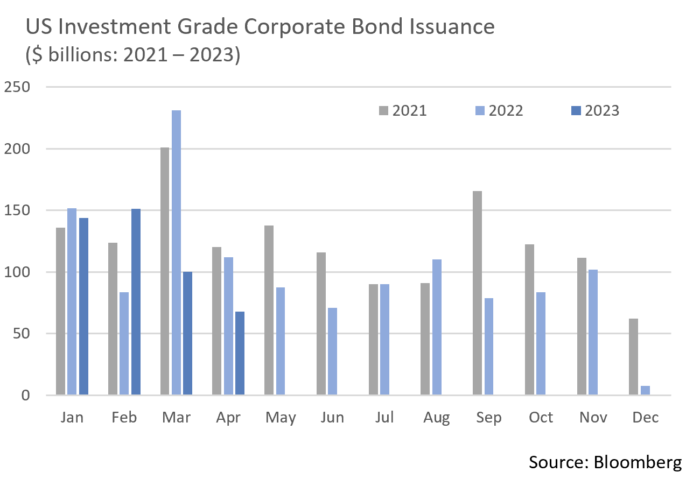
- The Investment Grade primary market fell well short of consensus in April as uncertainty left over from the regional banking shakedown left little room for opportunistic periods to issue new debt. The $65.7B that did come to market was well received although it was a bumpy ride getting there. Consensus had called for about $100B, and while April was a miss, prospects for a more robust May are high as issuers exit earnings blackouts. Additionally, earnings have been more positive than anticipated, which may prompt capital raises in the coming months ahead of future economic uncertainty. May borrowing is expected to climb to $150B, a level we feel will easily be absorbed.
- Prior to March’s credit sell-off, IG credit spreads remained range bound, trading at roughly 20 bps with an average option adjusted spread (OAS) of 122 bps. After hitting a YTD high of 163 bps on March 16, spreads quickly receded over the remainder of the month, settling in around 136 bps. We see slightly more room for spreads to tighten, although catalysts for widening continue to be inflation and/or a deepening recession.
- High Yield Corporate spreads also retreated as the market came back to life with investors returning to risk assets, a healthy dynamic for corporate credit at large. The OAS on the US HY Index began the month at 455 bps and rallied to hit 439 bps to close April, with high yield excess returns exceeding those of IG credit. A spread differential between IG and HY that had been gradually converging prior to the SVB meltdown has since widened back out. In March, investors pulled close to $7B out of high yields funds, although April’s positive net fund flows of $8B offered a positive indication of credit appetite. Volatility should remain in this segment of the market as investors navigate economic conditions, although we are encouraged that spreads are narrowing.
Public Sector Watch
Credit Comments
 US Drought Impact on Credit Conditions:
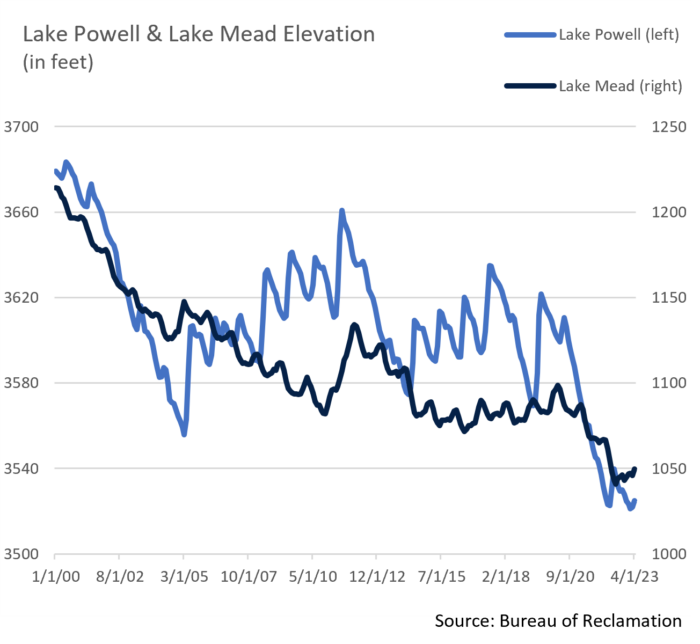
- The Southwest has grappled with drought conditions since 2000 as scientists have stated that the first two decades of the 21st century were the driest seen in at least 1,200 years. As a result, reservoirs have fallen to record low levels.
- Lake Mead was at just 27% of capacity in July of 2022, the lowest level since the reservoir was filled in 1937. Similarly, Lake Powell stood at just 23% of capacity in February of 2023.
- Historic snowfall across the Rocky Mountains has created a more optimistic outlook for water levels, with federal water managers projecting Lake Powell will rise between 50 and 90 feet by June. While this replenishment offers much needed relief, experts say it will not solve or even significantly delay the West’s water crisis.
- The reservoirs are expected to never again reach full capacity, creating concern about how the water systems connected to the Colorado River can be managed to benefit as many people as possible. These considerations must account for water use needs as well as electricity generation requirements given the region’s simultaneous reliance on hydroelectricity.
Water Considerations:
- The Colorado River and connecting reservoirs serve over 40 million people in seven states and irrigate 5.5 million agricultural acres of land, accounting for 15% of American agriculture. The severe decline in water levels has required drastic conservation efforts. A Tier Two shortage has been in effect this year, resulting in mandatory reduction of Colorado River usage by the states of Arizona and Nevada, as well as Mexico.
- Widespread mandatory reductions will further exacerbate the severity of existing water usage limitations. Systems will need to plan for lower water consumption over the long term, a dynamic that will challenge revenue generation.
- Systems are also seeking to mitigate water concerns through increased storage and water collection processes. Doing so requires significant infrastructure investment, increased debt service, and likely lower coverage levels. Although several systems maintain an ability to raise rates, such increases could challenge water affordability across much of the Western region.
Power Considerations:
- Both the Hoover Dam and the Glen Canyon Dam, which collectively serve more than 4 million people, have faced concerns regarding their long-term ability to generate electricity given water levels. Both Lake Powell and Lake Mead would need to drop several hundred feet before reaching what is known as a dead pool state whereby water no longer passes through the dam efficiently.
- While conservation efforts aimed at avoiding this scenario are underway and a favorable snowpack has provided relief, both lakes risk eventually falling below this critical level if sufficient progress is not made. If hydroelectric power generated from the dams is impacted, energy will be replaced with more expensive and less clean sources, impacting the bottom line for systems reliant on this renewable resource.
- This comes at a time when there is ongoing pressure to increase energy derived from renewable resources. Systems will need to continue investing in capital intensive infrastructure, and although most have already planned for these expenses, financial challenges will arise if costs ultimately exceed projections.
While impacted communities need to expand conservation efforts and work to mitigate aridification, the burden also lies on utility systems. Creating new infrastructure to capture and store water more efficiently will be critical for the Southwest region and will require significant capital investment. Timing is even more challenging, as systems are facing revenue pressure derived from water usage limiting conservation efforts. Power Utility systems face similar concerns as it becomes increasingly important to invest in renewable investments to meet regulatory standards. If the reliability of hydroelectric power decreases, these systems will have to increase capital expenses and could face debt service cost pressures. From a credit standpoint, we are evaluating these revenue and debt service scenarios and seek to ensure a significant credit buffer exists as a means of mitigating downside risk when approving issuers.
Strategy Overview
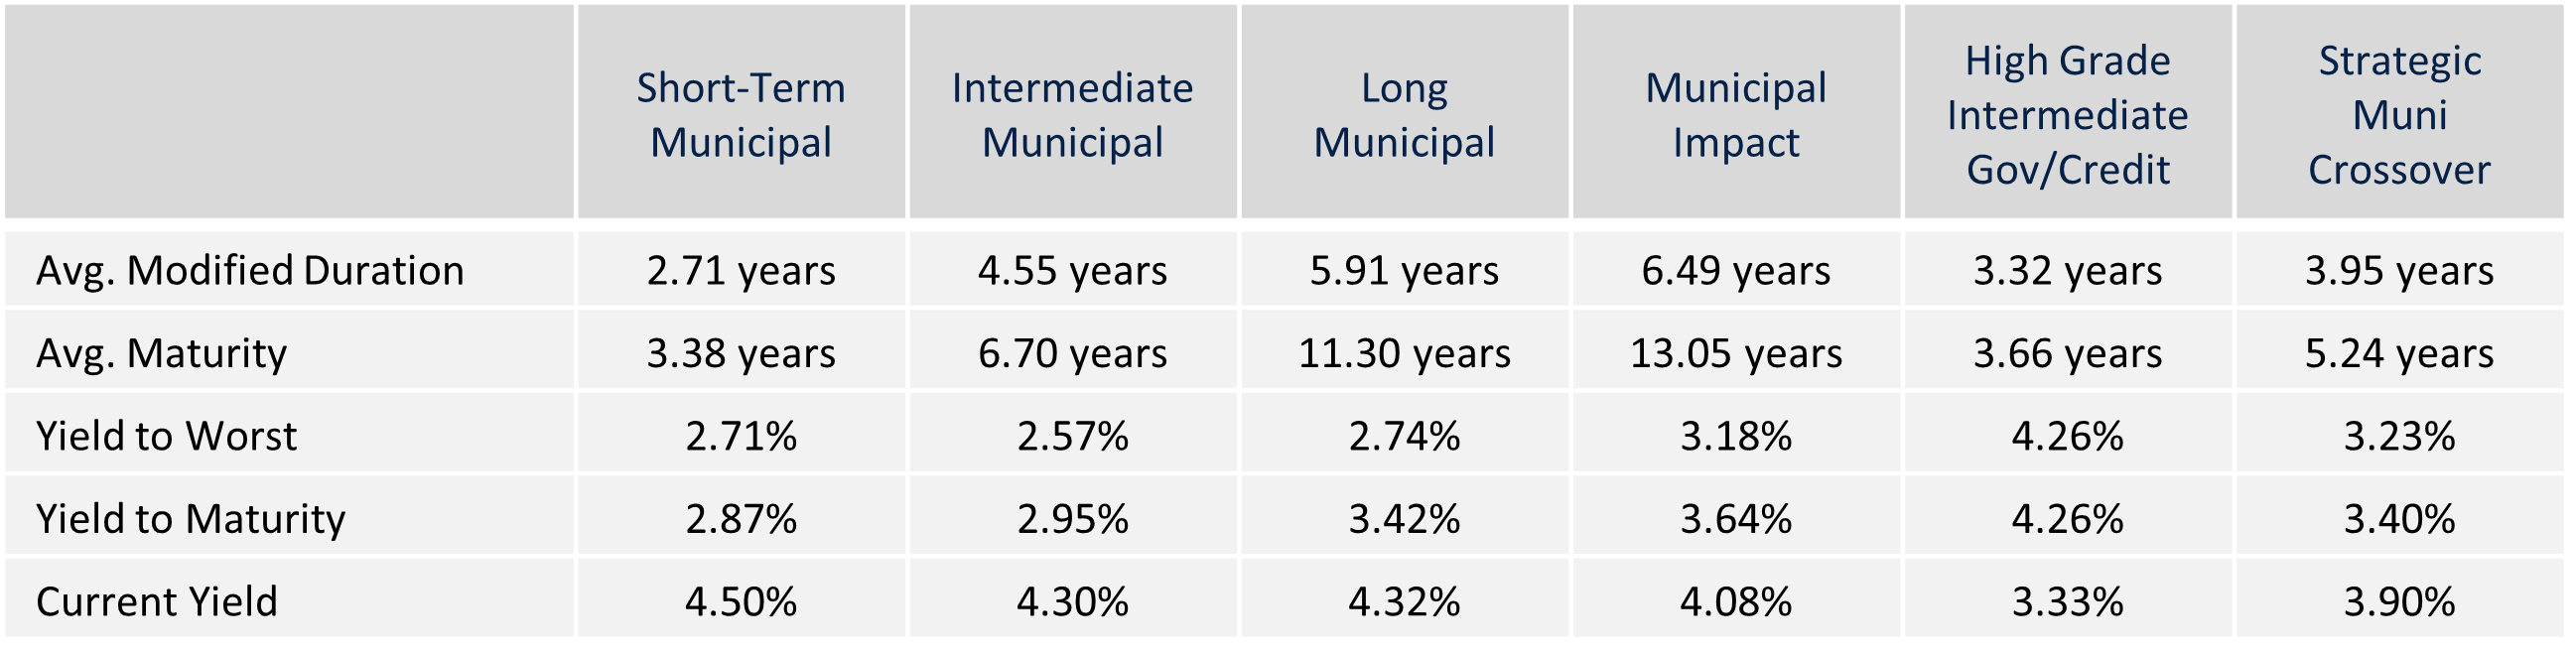
Composite Portfolio Positioning as of 4/30/2023
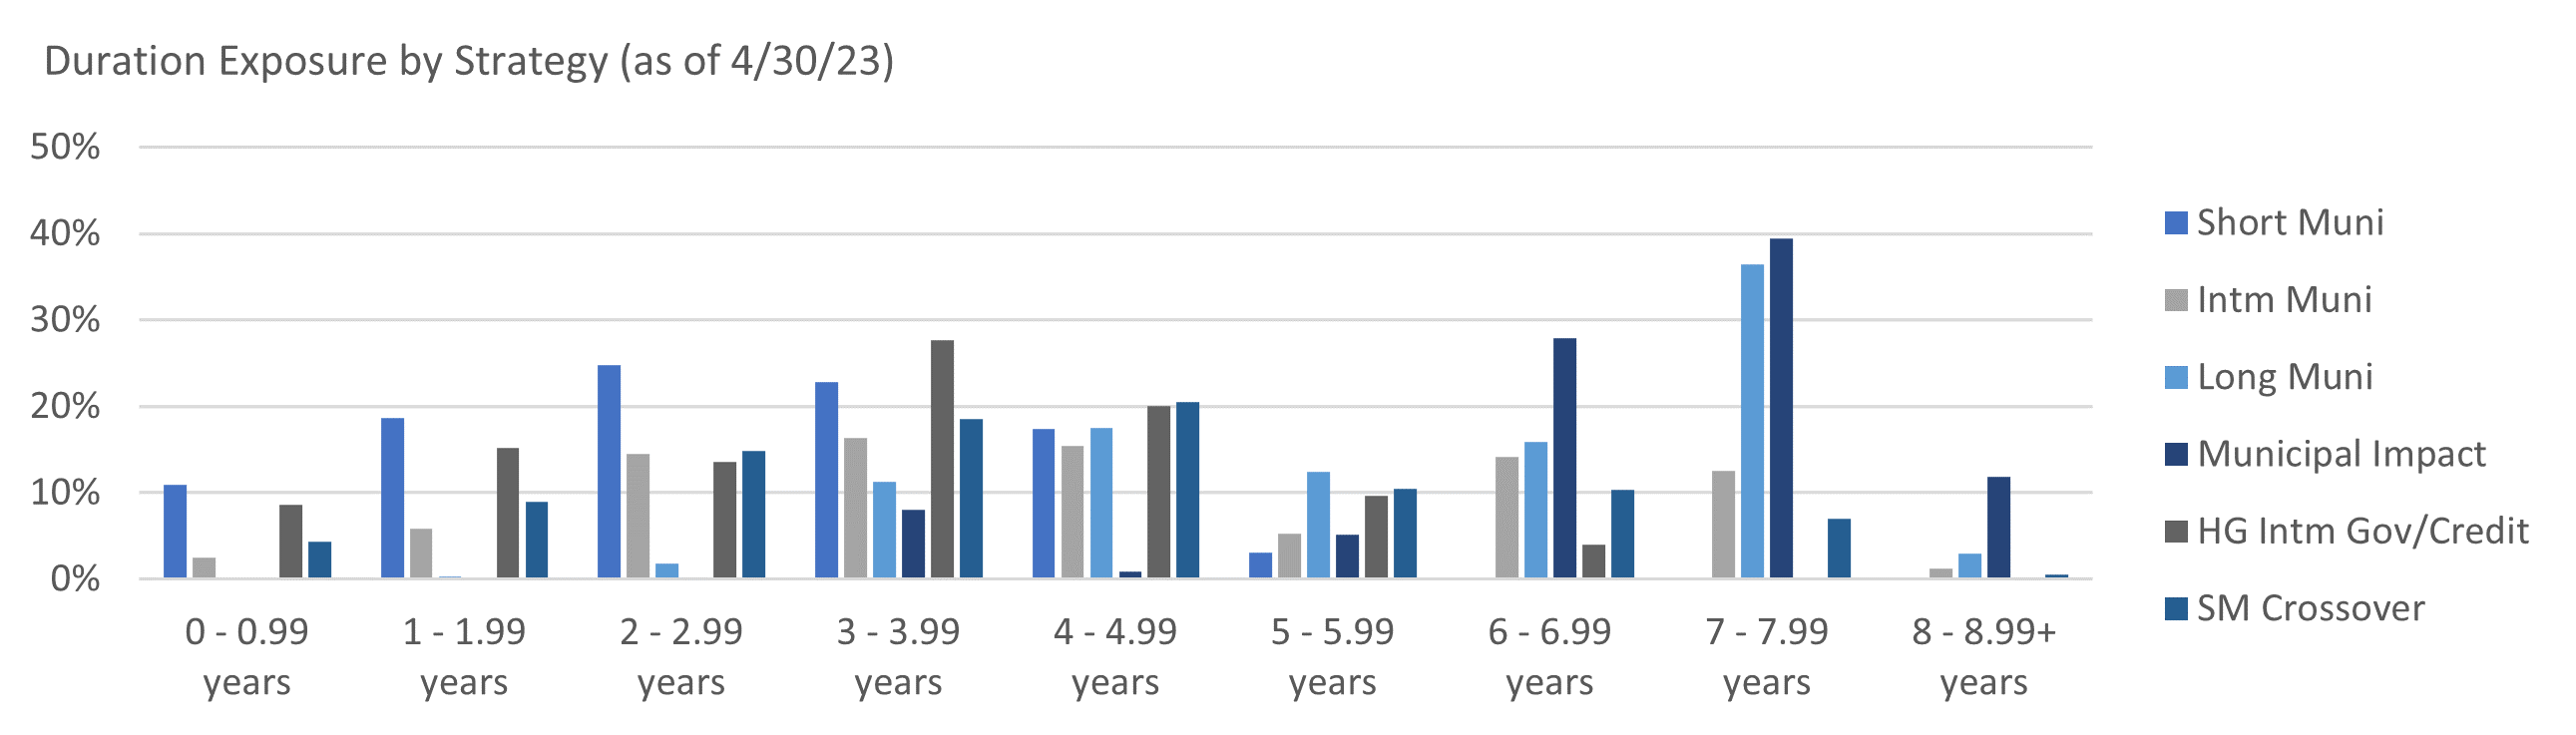
Duration Exposure as of 4/30/2023
The composites used to calculate strategy characteristics (“Characteristic Composites”) are subsets of the account groups used to calculate strategy performance (“Performance Composites”). Characteristic Composites excludes any account in the Performance Composite where cash exceeds 10% of the portfolio. Therefore, Characteristic Composites can be a smaller subset of accounts than Performance Composites. Inclusion of the additional accounts in the Characteristic Composites would likely alter the characteristics displayed above by the excess cash. Please contact us if you would like to see characteristics of Appleton’s Performance Composites.
Our Philosophy and Process
- Our objective is to preserve and grow your clients’ capital in a tax efficient manner.
- Dynamic active management and an emphasis on liquidity affords us the flexibility to react to changes in the credit, interest rate and yield curve environments.
- Dissecting the yield curve to target maturity exposure can help us capture value and capitalize on market inefficiencies as rate cycles change.
- Customized separate accounts are structured to meet your clients’ evolving tax, liquidity, risk tolerance and other unique needs.
- Intense credit research is applied within the liquid, high investment grade universe.
- Extensive fundamental, technical and economic analysis is utilized in making investment decisions.