


Insights & Observations
Economic, Public Policy, and Fed Developments
- October was largely a quiet macro month, thanks to the ongoing government shutdown, until the FOMC meeting ended the month with a bang. We thought Chairman Powell might cautiously open the door to a pause after October’s 25bps cut as we still see growing inflation pressures. While Powell described broad support for a cut in October (there were two dissents, newly appointed Stephen Miran favoring deeper cuts, while Jeffrey Schmid favored holding), he indicated the Committee was fiercely divided thereafter. “I always say that we don’t make decisions in advance,” he noted, “but I’m saying something in addition here, that it’s not to be seen as a foregone conclusion, in fact, far from it.”
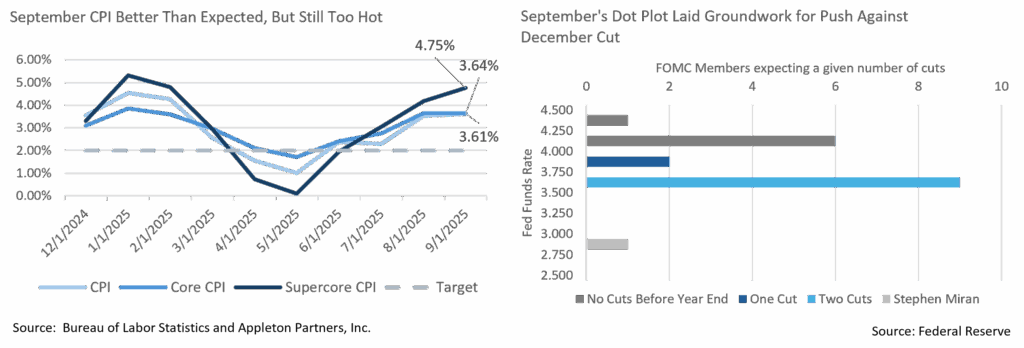
- Noting the divisions were due to different risk tolerances to the two sides of the Fed’s mandate, we believe Powell subtly indicated growing unease about inflation was at the heart of this divide. We’d previously pointed to the composition of the Fed Dot Plot suggesting a closely divided FOMC as a reason to believe a December cut was not a given. Powell’s Q&A suggested a level of disagreement beyond what we saw in September. We will be watching Fed speakers for signs of further movement in support of a December pause.
- Treasury yields didn’t begin to move materially until midway through the Q&A. Powell began discussing what he initially characterized as a moderately restrictive policy rate. Correcting himself mid-sentence, he clarified, “I would say modestly, other people would say moderately…” This suggests he believes rates are much closer to neutral than the market expected, and that fewer cuts than anticipated will occur. Long term rates ultimately rose about 10bps on the day, based almost entirely on an increase in real yields, as markets began to consider that the current cutting cycle may be nearing its end.
- While not a huge surprise, the Fed also announced the end of “Quantitative Tightening,” their balance sheet roll-off. It will begin in December, a little later than expected, and reinvestment will be in T-Bills, rather than across the entire curve. This is likely to push T-Bill yields down, somewhat steepening the overall curve, and will likely support the Trump Administration’s desire to reduce longer coupon issuance and increase shorter T-Bill issuance. T-Bill yields have been somewhat higher than policy rates would suggest; we expect this to correct as the Fed begins accelerating purchasing.
- After weeks of relative quiet, we also may be nearing the end of the government shutdown. While missed federal paychecks and delays in SNAP payments have been focal points for some time now, a new factor is ACA health exchange open enrollment, which began on 11/1. With Democrats holding out for the continuation of ACA healthcare subsidies, and 2026 enrollment information showing unsubsidized premiums, this pressing issue is going to become much more concrete to voters in coming days. Momentum may be shifting towards a deal.
- We received one government data release in October as the Bureau of Labor Statistics belatedly published September’s CPI report on the 24th. The release was nominally better than expected, coming in a tenth lower than expectations for headline and core, +0.3% and +0.2%, respectively. However, “supercore” inflation, or core services ex- shelter, continues to accelerate, and 3-month annualized rates are rising sharply. Powell has characterized services inflation as fairly well behaved; that may be true in trailing 12-month numbers but is less evident in recent data.
- Another trend worth watching is an acceleration in layoffs. This has been characterized as a “low fire, low hire” economy with little job growth but few staffing reductions. Several big employers, including Amazon and Target, announced sizable layoffs in the last few weeks, however. With an estimated 294k federal staffing reductions from DOGE hitting at the start of October, there is risk that the “curious balance” of the labor market could shift.
Sources: Bureau of Labor Statistics, Federal Reserve, and Bloomberg
From the Trading Desk
Municipal Markets
- October saw the continuation of the curve flattening that began in the prior month. The front end repriced higher in yield, while maturities 7 years and longer saw strong investor demand and an overall yield rally that peaked in 12-15 years. Performance was strong with 15 and 20-year maturities topping out at over 2%, outshining other spots across the curve. The short end was a laggard with mildly negative monthly returns.
- The 1 to 3-year part of the AAA curve saw yields increase up to 18bps, while 5-year maturities saw a more modest yield increase of 6bps. Strong demand for maturities greater than 6 years pushed yields lower by 4 to 24bps. The most significant rally, however, occurred 12 years and out on the curve, where yields closed the month lower by 22 to 25bps, rewarding duration.
- A net effect of these dynamics was that the slope of the curve ground lower, largely on par with the record move we saw in September. Our bell-shaped curve positioning and emphasis on the longer end of our intermediate strategy range is paying dividends, as many investors have added duration after selling short paper, a repositioning that has aggressively bid up longer maturities. These are trades we worked on throughout the summer after the curve reached historic steepness.
- According to JP Morgan, gross issuance totaled $59B, modestly lower than October 2024’s figures, while tax-exempt supply came in at $49.5B. The latter, while slower than the same period last year, pushed 2025 supply ahead of last year’s pace by 11%. This brings YTD gross supply to $484B, while the tax-exempt issuance total is $442B. As supply has been waning off a previously aggressive path, this might prove to be a supportive sign for municipals during November, a month in which estimated redemptions of more than $30B are expected, and activity around the Thanksgiving holiday is typically subdued.
Corporate Markets
- The primary market ended the month of October with a bang, as the year’s largest deal came just one day after the much-anticipated FOMC rate decision. Whie the Fed’s action didn’t spook the market, a $30B bond offering from META surprised participants, although they did not shy away. The deal amassed $125B in orders, and spreads tightened significantly from initial price talk. The deal with the fifth largest on record, falling just behind Pfizer’s $31B offering on 05/16/23. After a very slow start, this deal propelled the month into the record books as the largest October in history with $131.9B issued. While November is expected to bring $120B of new supply, more than that could end up being issued if market conditions remain favorable.
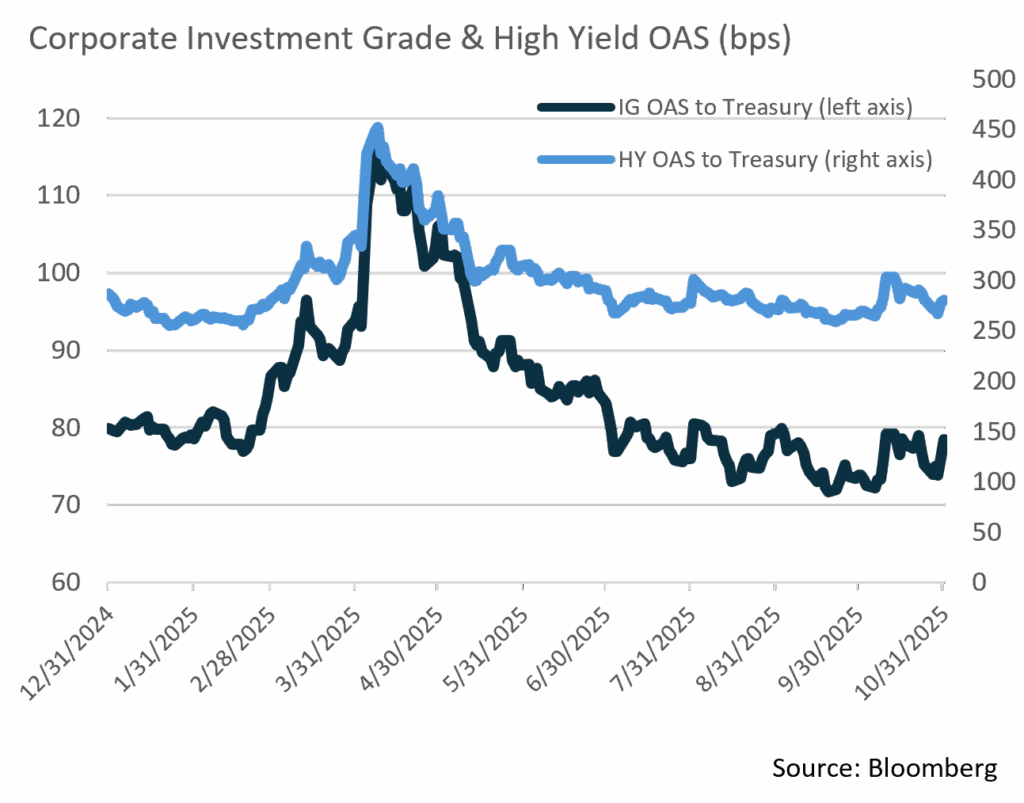
- Given such high levels of new supply, one might be concerned that buyer fatigue would begin to creep into the market. That has yet to be the case as solid technicals have allowed spreads to remain steady. In fact, the 78 bps OAS print on the Bloomberg US Corporate Index is 5bps lower than where July began. Over that timeframe the market has moved just 10bps in either direction, averaging an OAS of 77bps. The FOMC’s decision to cut the Federal Funds Rate and to roll back Quantitative Tightening is good for the momentum of credit spreads. With another cut in December hardly a done deal, we feel that IG credit spreads will remain in a narrow band to close out the year.
- According to Lipper, Short and Intermediate fund flows remained strong in October. The $11.04B of net new assets gathered by these funds has been a strong technical contributor to spread stability and new issuance demand. High Yield Fund flows were modestly positive at +$1.12B.
Sources: Bloomberg, JP Morgan, and Lipper
Public Sector Watch
Public Pension Funds Remain On a Positive Fiscal Path
- Pension plans have continued their favorable trend in recent months according to several pension funding indicators. One of the most closely monitored is the Milliman Public Pension Funding Index (PPFI), which tracks the funded ratio for the 100-largest US public pension plans. The funded ratio increased to 85.4% in September 2025, marking the sixth consecutive month of increasing funded ratios. This remains just shy of December 2021’s all-time high of 85.5%. However, Milliman projects if returns perform as expected, an 87% funded ratio can be reached by the end of Q3 2026.
- Milliman also reported that 45 of the 100 plans are now above the 90% funded mark, while 11 plans remain less than 60% funded.
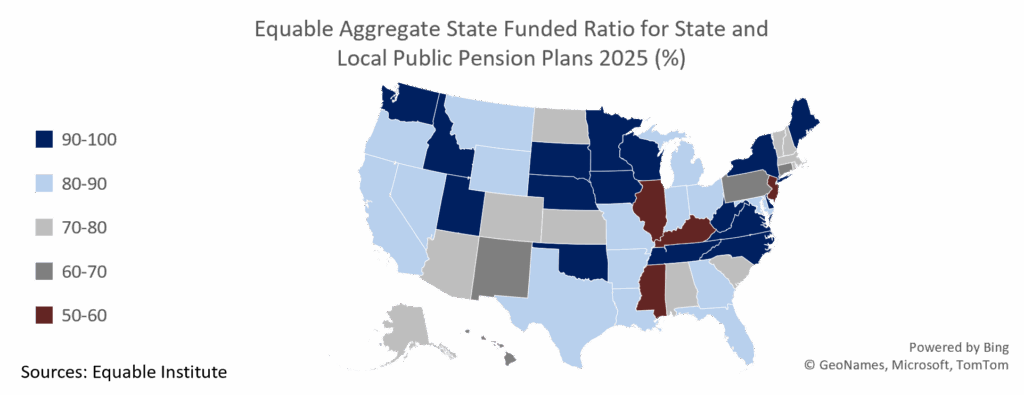
- Equable Institute, a bipartisan nonprofit, tracks pension data covering 253 statewide and municipal retirement systems. Based on data through 9/30, Equable anticipates that the aggregate funded ratio for state and local pension plans is projected to improve for a third straight year to 83.1%. This is an improvement from each of the last three years, reported at 75.4% in FY 22, 75.4% in FY 23 and 78.1% in FY 24.
- The improvement comes after Equable reported a sharp decline in April of 2025 related to tariffs and political events. Retirement systems have since recovered, with an annual projected return of 8.6% increasing from a previously assumed 6.87% return.
- According to Equable, unfunded liabilities remain above $1 trillion, which has been the case since 2009. In 2025, the national shortfall in assets for state and local pension plans totaled $1.2 trillion, down from $1.5 trillion in 2024.
- On a state-by-state basis, Equable estimated that 31 states had pension funded ratios above 80% in its October update, and six of these states are projected to meet or exceed 100% in 2025 (TN, DC, NE, WA, WI, SD). Four states (IL, KY, MS & NJ) have ratios below 60%.
- S&P also reported an upward trajectory of public pensions given strong market returns. S&P anticipates FY 25 investment returns of +11% – 12%, following +16% – 17% returns in FY 24. S&P updated their discount rate guideline to 6.5% from 6.0% to better reflect market forecasts.
- S&P states the updated discount rate indicates higher return expectations underpinned by an accelerating economic transformation marked by increased use of AI to enhance productivity and strong private equity investment returns without significantly increased risks. US pension plans typically assume a 7% annual return.
- While strong investment performance has led the way for pension funding improvements, pension contributions and conservative input assumptions cannot be overlooked. Significant one-time contributions over the past five years, partially aided by Federal pandemic stimulus, and the continued focus of management on pension plan funding health are evident.
- Increased pension contributions and funding levels have had a positive impact on state credit profiles. In recent years, both New Jersey and Connecticut have seen material rating improvements due in large part to positive pension changes. Both have historically struggled with pension costs and large unfunded liabilities. While these are just two examples, other states’ ratings have benefited as well.
- Appleton Partners continues to monitor public pension funding ratios as it is an important indicator of overall municipal credit health. States need to sustain healthy plan contributions to maintain long term credit standing, as contribution shortfalls are often a leading indicator of financial strain.
Sources: Milliman, Equable Institute, Bank of America, JP Morgan, S&P Global
Composite Portfolio Positioning (As of 10/31/25)
Strategy Overview
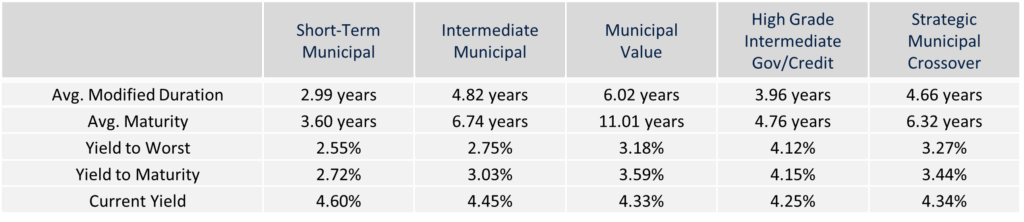
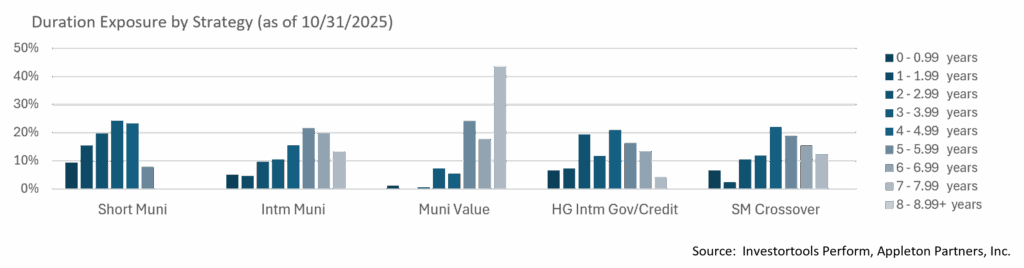
Duration Exposure (as of 10/31/25)
The composites used to calculate strategy characteristics (“Characteristic Composites”) are subsets of the account groups used to calculate strategy performance (“Performance Composites”). Characteristic Composites excludes any account in the Performance Composite where cash exceeds 10% of the portfolio. Therefore, Characteristic Composites can be a smaller subset of accounts than Performance Composites. Inclusion of the additional accounts in the Characteristic Composites would likely alter the characteristics displayed above by the excess cash. Please contact us if you would like to see characteristics of Appleton’s Performance Composites.
Yield is a moment-in-time statistical metric for fixed income securities that helps investors determine the value of a security, portfolio or composite. YTW and YTM assume that the investor holds the bond to its call date or maturity. YTW and YTM are two of many factors that ultimately determine the rate of return of a bond or portfolio. Other factors include re-investment rate, whether the bond is held to maturity and whether the entity actually makes the coupon payments. Current Yield strictly measures a bond or portfolio’s cash flows and has no bearing on performance. For calculation purposes, Appleton uses an assumed cash yield which is updated on the last day of each quarter to match that of the Schwab Municipal Money Fund.
This commentary reflects the opinions of Appleton Partners based on information that we believe to be reliable. It is intended for informational purposes only, and not to suggest any specific performance or results, nor should it be considered investment, financial, tax or other professional advice. It is not an offer or solicitation. Views regarding the economy, securities markets or other specialized areas, like all predictors of future events, cannot be guaranteed to be accurate and may result in economic loss to the investor. While the Adviser believes the outside data sources cited to be credible, it has not independently verified the correctness of any of their inputs or calculations and, therefore, does not warranty the accuracy of any third-party sources or information. Any securities identified were selected for illustrative purposes only, as a vehicle for demonstrating investment analysis and decision making. Investment process, strategies, philosophies, allocations, performance composition, target characteristics and other parameters are current as of the date indicated and are subject to change without prior notice. Not all products listed are available on every platform and certain strategies may not be available to all investors. Financial professionals should contact their home offices. Registration with the SEC should not be construed as an endorsement or an indicator of investment skill, acumen, or experience. Investments and insurance products are not FDIC or any other government agency insured, are not bank guaranteed, and may lose value.