Stock Market Valuation . . . What the Numbers Tell Us and What Isn’t So Clear
Reading the stock market tea leaves is no longer primarily a challenge undertaken by investment professionals, as anticipating the market’s direction has become part of our popular culture. One need only turn on CNBC and a host of other broadcast and online news sources to access a diversity of opinions concerning market valuation and what may come next for equities. How do broad market metrics relate to performance expectations, and what does Appleton consider when developing portfolio strategy?
A Broader Perspective Adds Insight
Context matters and we believe looking at market metrics such as S&P 500 price-to-earnings (P/E) in isolation can oversimplify the outlook for equities. While statistics of this nature are revealing, stock specific fundamentals remain integral to our decision-making. For us, managing risk requires careful consideration of both idiosyncratic risk – that which is company specific – as well as market valuation.
An Era of Stagflation
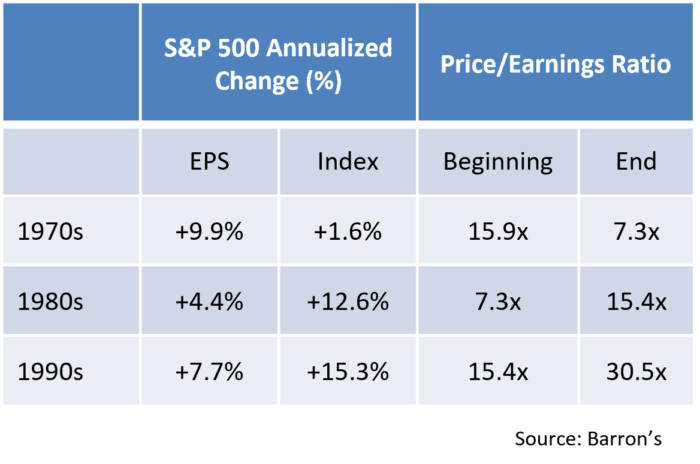
Those who lived through the 1970s may recall gas lines, double digit money market yields, and sharp increases in the actual level and volatility of inflation. Stock ownership creates a claim on the future cash flow of a business, the present value of which depreciates as interest rates increase. As such, the above table reveals the extent to which market multiples collapsed in the 1970s under the weight of high inflation and interest rates. Largely as a result, index returns were weak despite surprisingly strong corporate earnings growth. In hindsight, evaluating company performance without consideration of the macro environment would have left one with far too optimistic an outlook.
Multiple Expansion Fuels Stock Market Gains
The next two decades told quite a different story as index returns far outpaced earnings growth. Why the spike in enthusiasm for stocks in the 1980s despite a decade of largely sluggish growth in corporate earnings (+4.4% annualized)? Quite simply, risk appetite returned as inflation was subdued, interest rates declined markedly, and the economy recovered. Given this cyclical change, P/Es normalized at 15.4x by decade’s end. Investors focusing solely on relatively weak earnings growth may have missed out on multiple expansion-led, double digit annualized S&P 500 performance.
A healthy macro environment gave way in the mid-to-late 1990s to what Former Fed Chairman Alan Greenspan famously referred to as “irrational exuberance” in 1996, the early days of what became known as the “Tech Bubble”. The impact of market sentiment during the 1990s was profound as evidenced by the S&P 500 P/E doubling to a highly elevated 30.5x. As in the prior decade, 1990’s stock returns were fueled by multiple expansion, not earnings growth, as a persistently positive feedback loop persisted until the dot com frenzy finally collapsed in March 2000.
Time Horizon Influences The Drivers of Performance
What conclusions can we draw from this history lesson? For one, the level of interest rates and inflation matters a great deal in terms of market momentum, as risk appetite tends to rise in low-rate environments as the present value of future cash flow increases. The converse is often the case when interest rates and inflation rise to problematic levels. Over short periods of time, sentiment can be a powerful performance factor.
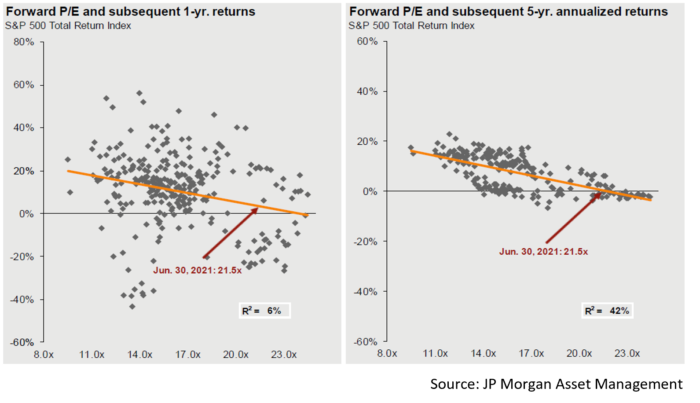
The accompanying S&P 500 forward P/E and subsequent return regression data demonstrates the extent to which current valuation influences longer-term performance expectations. While market valuation has significant predictive value over a period of several years, it has minimal influence in the short term. Corporate earnings and overall risk appetite arguably impact next year’s performance far more than the market’s current valuation level. In our view, valuation is inherently a relative consideration and not necessarily a reason to sell market exposure or an individual security. Nonetheless, higher multiples create reduced margin for error and may serve as a cautionary signal.
Making Sense of the Pandemic Bull Market
The rebound off last year’s lows has been remarkable, with the S&P 500 rising more than 100%. Yet below the surface we see two very different cycles. Multiple expansion fueled by a policy backed resurgence of risk appetite led March 2020 to March 2021’s rally, not corporate earnings growth which languished in the face of economic weakness. In fact, 2020 S&P 500 earnings dropped -14% after incurring -15% and -32% declines in Q1 and Q2 respectively. The ability of the S&P 500 to appreciate more than 20% over the full year despite a sharp drop in earnings reflects investors looking past current conditions as economic prospects improved.
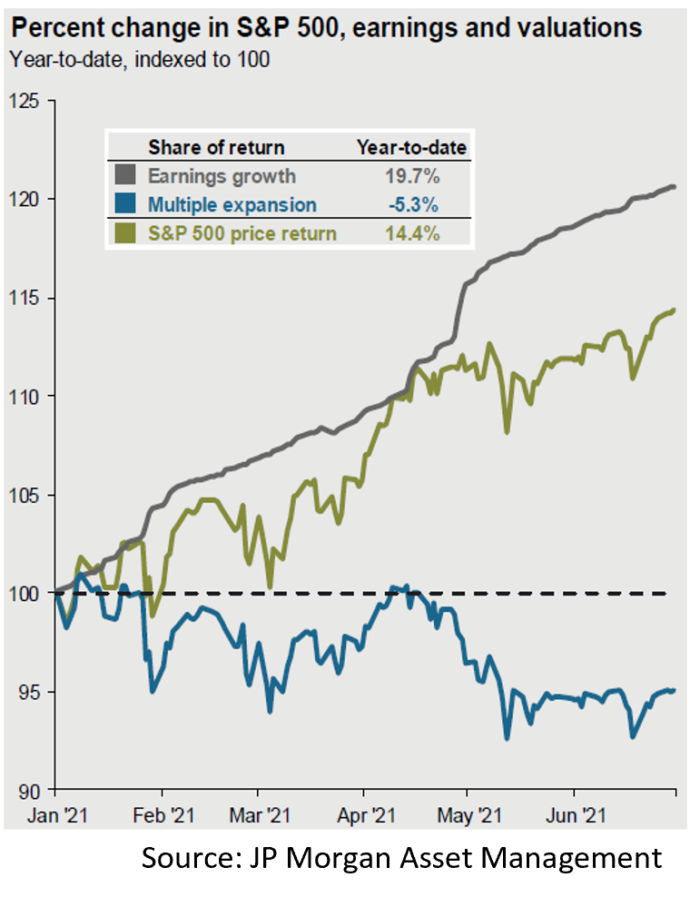
A different market dynamic has been at work so far in 2021 as multiples have begun receding with corporate earnings growth assuming leadership. Q1 2021 earnings grew at 47% and Q2 is expected to be up 90% off last year’s cyclical lows. As a result, the S&P 500 has been able to continue its upward ascent despite multiples contracting from close to 23x to 20.8x. Recent S&P 500 performance attribution is revealing as earnings growth has contributed +19.7% to the Index’s total return through the end of Q2, whereas contraction in market multiples has detracted -5.3%. Despite strong earnings growth, we are now in an environment marked by concern about inflation, prospective interest rate hikes, and Federal Reserve tapering. These potential headwinds have contributed to contracting sentiment, and earnings rather than a rising tide must lead the market forward.
A degree of caution is warranted, as not only P/E but also metrics such as Price/Book, Price/Revenue and CAPE (cyclically adjusted P/E) are relatively high. Yet it bears reemphasizing that valuation is relative and digging more deeply into the macro context offers us comfort. In stark contrast to earlier decades, interest rates and bond yields remain at extraordinarily low levels. The flagship 10Yr UST yield of 1.29% is roughly equivalent to the S&P 500’s dividend yield. And at a forward P/E of 20.8x the S&P 500’s earnings yield is a healthy 4.75% in a very low yield environment. Despite anticipated moves towards normalization, the Federal Reserve is being extremely careful about pulling back on liquidity and monetary policy support.
As investors, while it is incumbent upon us to recognize cycles marked by differing macroeconomic conditions, policy direction, and investor sentiment, such analysis should not displace stock specific research. Appleton’s analysts also focus intently on a company’s balance sheet, competitive position, and management. Our approach is often considered “GARP”, or “Growth at a Reasonable Price.” How much we are willing to pay for a stock is influenced by its anticipated growth rate as well as the market environment. A useful way to view expected growth relative to price is through a stock’s PEG ratio, or simply P/E divided by earnings growth rate. In our view, the value of a stock in a low rate, expanding economy is higher than in a higher rate environment grappling with less favorable macro conditions.
How can we help you? Please contact:
Jim O’Neil, Managing Director, 617-338-0700 x775 [email protected]
www.www.appletonpartners.com
This commentary reflects the opinions of Appleton Partners based on information that we believe to be reliable. It is intended for informational purposes only, and not to suggest any specific performance or results, nor should it be considered investment, financial, tax or other professional advice. It is not an offer or solicitation. Views regarding the economy, securities markets or other specialized areas, like all predictors of future events, cannot be guaranteed to be accurate and may result in economic loss to the investor. While the Adviser believes the outside data sources cited to be credible, it has not independently verified the correctness of any of their inputs or calculations and, therefore, does not warranty the accuracy of any third-party sources or information. Specific securities identified and described may or may not be held in portfolios managed by the Adviser and do not represent all of the securities purchased, sold, or recommended for advisory clients. The reader should not assume that investments in the securities identified and discussed are, were or will be profitable. Any securities identified were selected for illustrative purposes only, as a vehicle for demonstrating investment analysis and decision making. Investment process, strategies, philosophies, allocations, performance composition, target characteristics and other parameters are current as of the date indicated and are subject to change without prior notice. Registration with the SEC should not be construed as an endorsement or an indicator of investment skill acumen or experience. Investments in securities are not insured, protected or guaranteed and may result in loss of income and/or principal.
"Are you or a family member the operator or manager of a Limited Liability Corporation (“LLC”), or a general partner of a Limited Partnership (“LP”)? Have you ever created an LLC to hold real estate or other investment assets? If so, new, more stringent reporting requirements brought on by the Corporate Transparency Act warrant attention..."
"As we begin a new year, a few changes to 2023 retirement account contribution limits are noteworthy. An overview of these changes follows, although consultation with your Portfolio Manager or a tax professional is recommended before considering what options are right for you."
To provide the best experiences, we use technologies like cookies to store and/or access device information. Consenting to these technologies will allow us to process data such as browsing behavior or unique IDs on this site. Not consenting or withdrawing consent, may adversely affect certain features and functions.
Functional
Always active
The technical storage or access is strictly necessary for the legitimate purpose of enabling the use of a specific service explicitly requested by the subscriber or user, or for the sole purpose of carrying out the transmission of a communication over an electronic communications network.
Preferences
The technical storage or access is necessary for the legitimate purpose of storing preferences that are not requested by the subscriber or user.
Statistics
The technical storage or access that is used exclusively for statistical purposes.The technical storage or access that is used exclusively for anonymous statistical purposes. Without a subpoena, voluntary compliance on the part of your Internet Service Provider, or additional records from a third party, information stored or retrieved for this purpose alone cannot usually be used to identify you.
Marketing
The technical storage or access is required to create user profiles to send advertising, or to track the user on a website or across several websites for similar marketing purposes.
We use technologies like cookies to analyze web traffic and store visitor information. Consenting will allow us to process data such as browsing behavior or unique IDs on this site.
Functional
Always active
The technical storage or access is strictly necessary for the legitimate purpose of enabling the use of a specific service explicitly requested by the subscriber or user, or for the sole purpose of carrying out the transmission of a communication over an electronic communications network.
Preferences
The technical storage or access is necessary for the legitimate purpose of storing preferences that are not requested by the subscriber or user.
Statistics
The technical storage or access that is used exclusively for statistical purposes.The technical storage or access that is used exclusively for anonymous statistical purposes. Without a subpoena, voluntary compliance on the part of your Internet Service Provider, or additional records from a third party, information stored or retrieved for this purpose alone cannot usually be used to identify you.
Marketing
The technical storage or access is required to create user profiles to send advertising, or to track the user on a website or across several websites for similar marketing purposes.