


Insights & Observations
Economic, Public Policy, and Fed Developments
- The labor conditions picture shifted substantially in March, after the February jobs report brought a combined 167k in prior period downwards revisions. Coupled with unexpectedly hot CPI and PPI inflation reports, market fears turned to stagflation. We think some context is important, however. December and January had been concerningly hot as initially published (and were part of why the markets were primed to worry over inflation even before January’s inflation reporting surprised to the upside). Post revision, job growth remains strong, but not abnormally so. Rather than harbinger of weakness to come, we found the revised employment reports more consistent with the Fed’s projections of a “soft landing.”
- The inflation picture remains complicated. Critics of the Fed are right to point out that a lot of the progress fighting inflation to date, driven by supply chain normalization and falling energy prices, is not likely to lead to further improvement; the path from 4% to 2% is going to look a lot different than the path from 8% to 4%. However, we believe that as goods and energy cost improvements fade the Fed is likely to get an assist from shelter costs.
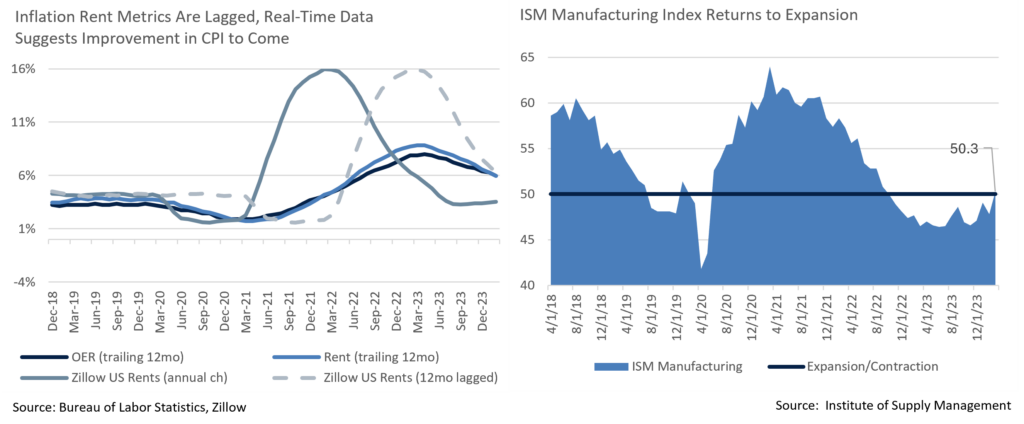
- One of the more technical reasons core inflation has proven sticky this cycle is that shelter costs, which are more than a third of headline and nearly half of core, are heavily lagged, with only about one twelfth of the sample updating monthly. Live rental data indices exist, however, and can provide insight on how CPI shelter components should look in the coming year. Zillow’s monthly index has fallen from around a 6% annual increase a year ago, close to CPI shelter inflation today, down to about 3.5%. While higher than the Fed’s 2% target, this is in the normal 3-4% historical range that’s been consistent with 2% headline inflation. As long as nothing new disrupts shelter costs, this component of CPI should decelerate enough to finish pulling inflation back to the Fed’s target.
- The growth outlook is increasingly robust, meanwhile. The final Q4 GDP revision bumped growth to the originally reported 3.4%, showing strong momentum coming into Q1. More importantly, it did so in part with further downward revisions to inventory levels (suggesting future strength as retailers restock) and even stronger consumer spending. While retail spending was a little weaker than (admittedly high) expectations for March, personal spending was nearly twice as strong as forecast; the latter tilts heavily towards services and suggests consumers continue to prioritize services spending.
- Survey data, weaker than hard data for much of the past year, was excellent, too. The University of Michigan consumer sentiment unexpectedly hit the highest levels since 2021, and ISM Manufacturing, after slowly improving all winter, finally came out of contraction for the first time since late 2022. The Atlanta GDPNow projection for Q1 stood at a robust 2.8%, above trendline and only modestly slower than Q4.
- The Fed meeting on March 20th contained few surprises, but one thing we would note and will be watching in future “dot plots” is a gradual upwards movement in the Fed’s long-term “neutral” Fed Funds rate. While the median only increasing from 2.5% to 2.6%, the full dot plot shows a growing upwards skew to the distribution, and only a few members’ votes moving upwards from here would lead to a sizable increase in the median long term Fed Funds rate.
Equity News and Notes
A Look At The Markets
- Equities sustained their rally in March as the S&P 500, Nasdaq, and DJIA all advanced for the fifth month in a row, setting numerous all-time highs along the way. The S&P 500 rose +3.1% to increase its Q1 return to +10.2%, the best first quarter since 2019. The DJIA gained +2.1% in March, with the Nasdaq trailing at +1.8%, although the biggest winners were small caps, as the Russell 2000 added +3.4%. All 11 sectors were higher in March led by Energy with WTI crude oil rising 8.9% on economic strength, its best month since July 2020.
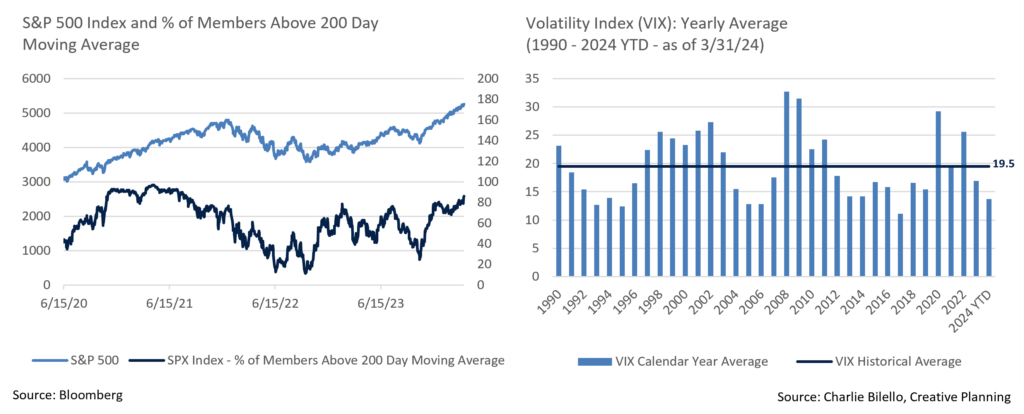
- The primary market event was the March FOMC meeting, a session that held Fed Funds rates steady although the median forecast continued to show 3 rate cuts for 2024. There had been growing chatter of a possible move to only 2 cuts following hotter than expected inflation readings to begin the year. Chairman Powell also struck a dovish tone in his press conference, another factor that contributed to interest rates dropping modestly to close Q1. This favorable backdrop contributed to an improvement in stock market breadth as far more companies participated in the rally. Not only did small caps outperform, the equal-weighted S&P beat its cap-weighted counterpart with a +4.0% return, a healthy dynamic in our view given prior performance concentration. Notably, 85% of stocks in the S&P 500 closed the month above their 200-day moving average, the broadest level of participation since the summer of 2021.
- Q1 strength was not confined to the US, as markets around the globe hit fresh all-time highs as well. While the Euro Stoxx 600 made new highs, the most notable move came from Japan where the Nikkei 225 made its first all-time high since 1989. This came despite the Bank of Japan raising rates for the first time in 17 years, pulling rates out of negative territory for after nearly 8 years. This offered further evidence of the decoupling of stock prices and rate cut expectations that we highlighted last month. We see this decoupling as attributable to a firmer economic backdrop and growing comfort in the ability of the Fed to pull off a soft landing. Nonetheless, incoming growth and inflation data must be carefully evaluated as investors remain sensitive to the Fed’s policies and timetable.
- The S&P 500’s +27% gain over 22 weeks from its October low is a feat rarely seen (most recently 1975, 1982, 2009, and 2020). More surprising was the lack of volatility during this stretch as the largest drawdown was a mere -1.9%. The first quarter’s maximum drawdown of -1.7% would be the smallest in history if it stood for the whole year, as 1995 previously held the crown at -2.5%. This is highly unusual as the average intra-year drawdown dating back to 1928 has been -16%. The VIX volatility index is emblematic of the stock market’s “melt-up” as its YTD average of only 13.7 is the lowest since 2017. While the lack of volatility gives bulls comfort, it makes it more difficult to tactically put new money to work given the lack of any meaningful dips to buy.
- With the Fed and investors seemingly closer to agreeing on a path for interest rates over the remainder of the year, fundamentals are likely to play a more important role. With a forward P/E of 20.9x, stocks are unlikely to see meaningful multiple expansion and earnings growth will be relied upon to fuel further gains. The FY 2024 estimates have stabilized at +11% and early 2025 projections are calling for +13% growth. We expect these numbers to come down over time, which is typical, but do not expect a collapse. Volatility is likely to increase as we move closer to the election, but the longer-term outlook appears constructive. We anticipate a more fundamentally based market and see this as a favorable environment to apply our research insight.
From the Trading Desk
Municipal Markets
- March issuance was strong at $36.78 billion according to Bloomberg, 6.8% higher than the same month last year. On a YTD basis, issuance is roughly 30% above last year’s supply, a positive trendline given past supply constraints. If issuance is sustained at the same rate as last year, the annual total should be in line with Street expectations of about $400 billion. We are encouraged by recent issuance trends as it enables us to more readily source quality, liquid names that meet client portfolio needs.
- As part of the issuance story, Build America Bonds (BABs) are back in the headlines. BABs were initially introduced in 2009 to facilitate municipalities accessing the market during the Great Financial Crisis by offering a subsidy to the issuers. Many BABs were issued with an extraordinary redemption provision (ERP) which would be triggered if the subsidies are cut, an occurrence that happened as part of sequestration. BABs with ERP calls make up about 13% of the taxable municipal market. However, the current narrow spreads of taxable municipals have prompted issuers to consider the cost savings of calling their ERP BABs and reissuing in the market. We find this dynamic interesting to note, despite BABs with ERPs being a relatively small portion of the overall market and thus having limited implications.
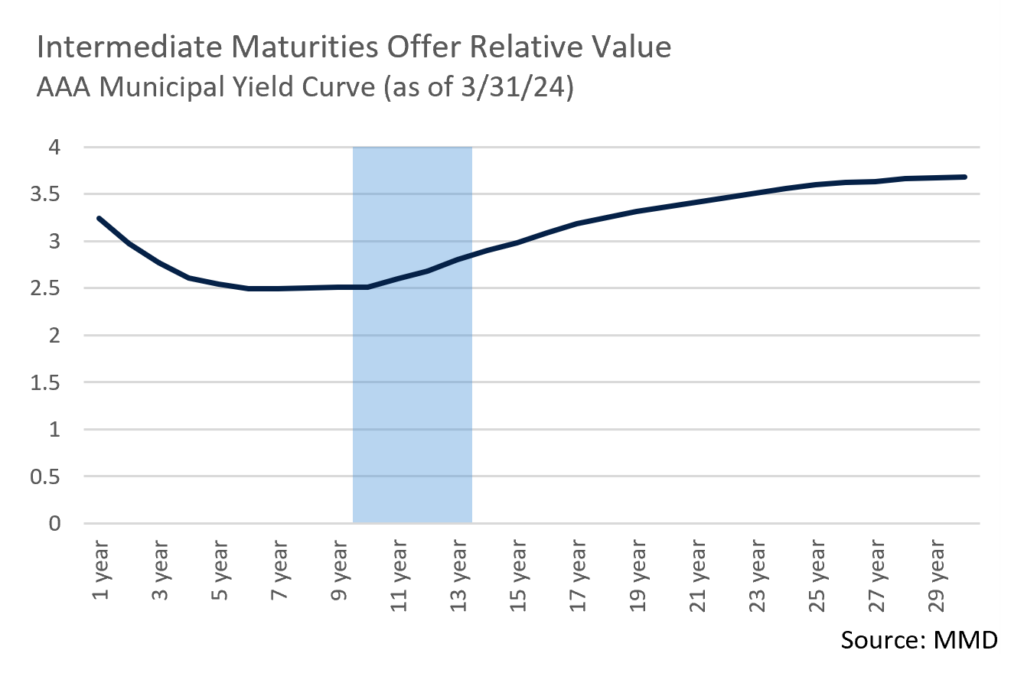
- The short end of the yield curve moved up over 20bps in March with the 2Yr AAA closing the quarter at 2.97%. Slightly longer maturities of 10-years saw yields move up much more modestly over the month. Given this yield curve dynamic, we are finding value in the short end of the curve and offsetting the duration effect with longer names of 10 to 12-years. Recent curve movement has bumped up Muni/UST ratios on the shorter end of the curve, with the 2-year now at 64.3%, while the 10-year ratio rests well below long-term averages at 59.8%.
Corporate and Treasury Markets
- Investment Grade Corporate issuance once again beat consensus estimates in March with $142 billion of new debt hitting the market, as compared to an expectation of $130 billion. This marked the third straight month in which new issuance exceeded projections, leading to a record setting $529 billion of new supply in Q1. Covid concerns in March of 2020 prompted the prior record, whereas today’s primary market conditions are largely a reflection of issuers tapping into robust demand from domestic and foreign buyers, attractive borrowing costs, and lingering concerns about the potential for a mild recession that could pressure the debt markets. We anticipate slowing issuance and are maintaining relatively short maturity and a selective sector focus likely led by Financials.
- The song remains the same as credit appetite has kept Investment Grade spreads incredibly resilient. The OAS on the Bloomberg Corporate Bond Index began 2024 at 100bps and reached a high of 105bps a few days later. A subsequent tightening has not significantly reversed, as the quarter-end OAS of 89bps was only 2bps wider than the low reached on March 21st. A 7bps tightening of the Index’s OAS over the month of March produced 0.56% of excess return. At this stage in the cycle, we see the potential for further tightening, although in our view this will be dependent on sustained economic strength and looming Federal Reserve interest rate decisions.
Financial Planning Perspectives
Generational Wealth Transfer: Why Planning Matters
As Baby Boomers age, the largest transfer of wealth in US history is in progress, introducing significant financial and estate planning implications. Despite the magnitude of this trend, many families struggle to navigate the mechanics of wealth transfer and how best to communicate their plans with family members.
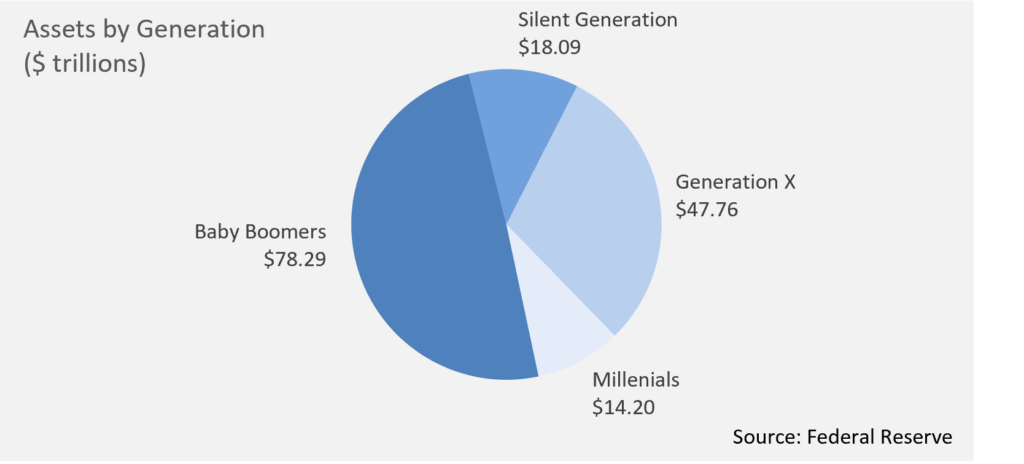
Cerulli Associates estimates that $84.4 trillion will pass from the Silent Generation and Baby Boomers to Generation X and Millennials by 2043.
It is important to remember that wealth transfer looks different for each family. Some families fall into the traditional category in that portfolio assets and real estate will be passed on to younger heirs. Some families may choose to pass their assets to the next generation while they are still alive and can take pleasure in seeing their children and grandchildren enjoy their gifts. Other families may plan to leave little to no inheritance because they wish to spend their assets themselves, end up needing their assets because of living longer or health-related issues, or wish to donate to charity. Regardless of the scenario, communicating your plans to the next generation offers a multitude of benefits, such as:
- Provides children and parents with an opportunity to discuss how existing estate plans operate and the intentions behind them.
- Facilitates working with advisors such as attorneys, CPAs, or insurance specialists.
- Creates an opportunity for children and parents to discuss senior care and end of life scenarios.
- Minimizes surprises, pitfalls, or other difficulties with investment assets.
- Addresses potential needs of pre-nuptials and facilitates planning for second families.
- Assists in tax planning strategies.
- Allows for more effective pursuit of philanthropic desires.
- Supports a personalized, well thought out family legacy dialogue.
In our experience, we have seen many families successfully engage in conversations of this nature, as well as the difficulties and struggles of families who do not. We are committed to assisting clients with intergenerational asset distribution and can help in several important areas, including:
- Guidance on how best to approach the discussion
- Avoiding probate and other legal pitfalls
- Naming of beneficiaries and successor trustees
- Tax management
- Risk minimization strategies
Please reach out to your Portfolio Manager if you are interested in discussing this subject in greater detail.
Sources:
https://www.thestreet.com/dictionary/great-wealth-transfer
This commentary reflects the opinions of Appleton Partners based on information that we believe to be reliable. It is intended for informational purposes only, and not to suggest any specific performance or results, nor should it be considered investment, financial, tax or other professional advice. It is not an offer or solicitation. Views regarding the economy, securities markets or other specialized areas, like all predictors of future events, cannot be guaranteed to be accurate and may result in economic loss to the investor. While the Adviser believes the outside data sources cited to be credible, it has not independently verified the correctness of any of their inputs or calculations and, therefore, does not warranty the accuracy of any third-party sources or information. Specific securities identified and described may or may not be held in portfolios managed by the Adviser and do not represent all of the securities purchased, sold, or recommended for advisory clients. The reader should not assume that investments in the securities identified and discussed are, were or will be profitable. Any securities identified were selected for illustrative purposes only, as a vehicle for demonstrating investment analysis and decision making. Investment process, strategies, philosophies, allocations, performance composition, target characteristics and other parameters are current as of the date indicated and are subject to change without prior notice. Registration with the SEC should not be construed as an endorsement or an indicator of investment skill acumen or experience. Investments in securities are not insured, protected or guaranteed and may result in loss of income and/or principal.