Insights and Observations
Economic, Public Policy, and Fed Developments
- After an escalation in US rhetoric before the G20 summit in Buenos Aires, President Trump and President Xi agreed to a “truce” in the trade war. Details are sparse, and the tone of Chinese media interpretation differs from US reports, but it appears both sides have agreed to a 90-day hiatus on additional tariffs, including previously-announced increases set for January 1st. Domestic equity markets gave up all of their gains and more after initially surging on the news, as the market struggles to digest an agreement to essentially continue talking.
- President Trump also told reporters he would begin the process of officially terminating NAFTA on the return flight from the G20 summit, a stance taken to increase pressure on Congress to approve his USMCA replacement deal. We view this as a modest negative, as the USMCA was likely to pass in some form. This move effectively seems to raise the consequences of a misstep.
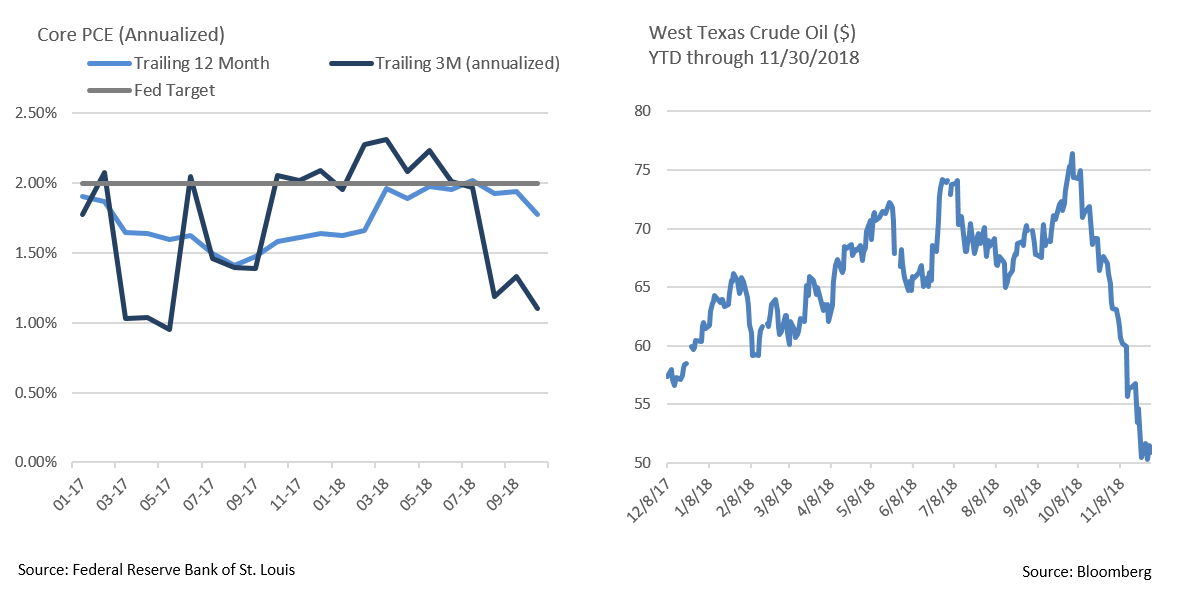
- As we had projected, the Fed’s preferred inflation measure, core PCE, fell on a YoY basis in October. Between a weak 0.1% October reading and a downward revision in September, core PCE fell from 2.0% to 1.8%. Headline missed as well, remaining at 2.0% vs expectations of 2.1%. Trailing 3-month core PCE now stands at an annualized 1.1%, well below the Fed’s 2% policy objective. Continued weakness in inflation data may make it difficult for the Fed to continue its current pace of rate hikes. Indeed, the Fed Funds futures market now does not consider a 2019 rate hike more likely than a coin flip until June, and the probability of two or more hikes occurring by the end of 2019 is only about 1-in-3. However, escalating political pressure from the President to not “hike” complicates the analysis.
- Q3 GDP came in unchanged at 3.5% in the first revision. Business investment, a large driver of growth in the first half, was revised up from 0.8% to 2.5%, while household spending weakened slightly from 4% to 3.6%. Nothing in the revision changes our outlook for a slight deceleration in the economy’s growth rate in the last quarter of the year.
- Oil entered correction territory in November, dropping from October’s intraday high of $76.72 to close the month at $50.93. Slack demand coupled with booming supply, particularly in US shale oil production, pulled prices lower. Low oil prices are a boon to consumers in the short run, but could have a dampening effect on the US economy (where the oil patch is a significant employer) and continue to weigh on inflation.
Equity News & Notes
Markets Grapple with Economic, Central Bank and Trade Uncertainty
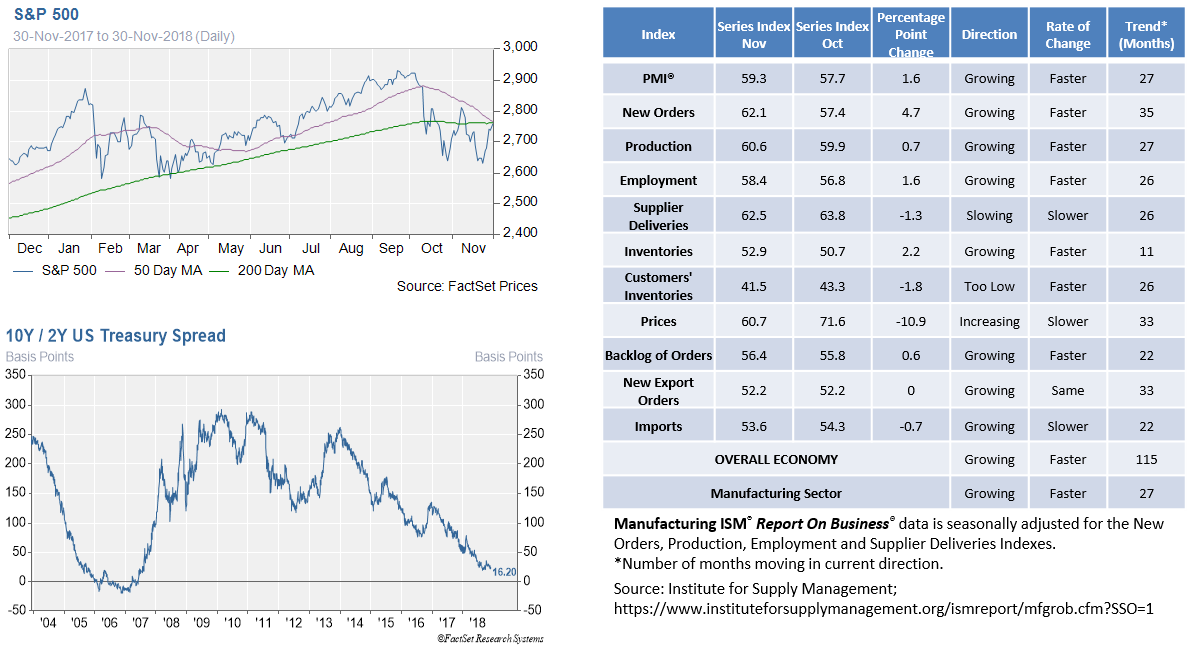
- Equity market volatility is making the tranquil days of 2017 and early 2018 seem like a distant memory. The latest bout started with an October 3rd talk by Fed Chairman Jerome Powell, in which he stated that rates were “a long way” from neutral. This implied that the Fed was going ahead with raising short-term rates not only in mid-December, but several times in 2019. Investor anxiety sparked a “risk-off” change in sentiment. During a speech in NYC last week, the Chairman conveyed a much more dovish tone, as he intimated that rates are close to neutral and the Fed is not on a predetermined policy path. Those comments, along with a benign PCE inflation reading, temporarily calmed investors, providing a lift to equities as November closed.
- Trade fears have dogged investors for much of 2018, although markets briefly turned hopeful after the G20 summit. As we commented earlier in this publication, the US and China appeared to agree to dial down tensions, at least during a three-month negotiation period. While this is positive in that it took the worst-case scenario off the table for now, the truce could simply be “kicking the can” down the road. As we write on December 4th, the S&P 500 fell 3.20% for the day, in part due to growing skepticism about the trade deal and economic growth.
- We are also closely watching the shape of the yield curve. As we pointed out in July, an inverted 2 to 10-Year spread is a well-followed indicator of potential future recession. The 2 to 5-Year Treasury spread recently inverted and the spread between 2s and 10s is now the narrowest it has been in a decade at 10 basis points. A host of factors are influencing curve structure, the two most prominent in our view being the Fed pushing up the front end and growth fears anchoring the long end. However, even if one believes in the inverted yield curve signal, the average lag time between an inversion and market peak is 8 months, with an average of 14 months separating inversion and recession.
- Furthermore, when looking at the 9 inversions since 1950, the average 10-Year yield at the time of inversion was just over 6%, more than double today’s level. An inversion at much lower nominal yields could introduce a very different dynamic.
- Global growth has shown signs of decelerating but not contracting. The November ISM/PMI reports, a survey of manufacturing activity, were better than expected. Levels above 50 signal expansion and major markets exceeded both this hurdle and expectations: US: 59.3 v 57.5; Eurozone: 51.8 v 51.5; UK: 53.1 v 51.5; China: 50.2 v 50.1. There is a big difference between a growth rate slowdown and actual contraction in the economy and corporate earnings. We see the former, not the latter, and repeat below an excerpt from last week’s private market update.
- Unless one’s personal circumstances, risk tolerance or goals have changed, we believe the best course of action is to stay invested in a manner consistent with your asset allocation strategy.
From the Trading Desk
Municipal Markets
- The latter half of November saw the municipal market strengthen with yields on the 5 to 10-yr portion of the AAA curve declining by 10–15 basis points. Weak housing numbers, reduced inflationary expectations, and concerns about slowing global growth prompted Treasury demand, and high quality munis generally followed suit.
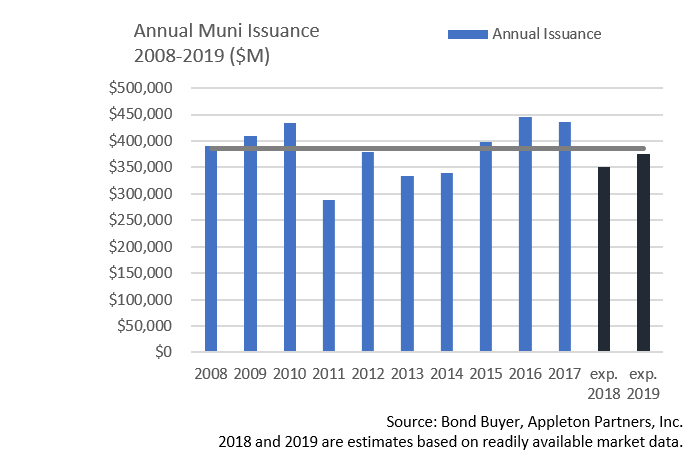
- The muni market has been supported in 2018 by tight supply. YoY issuance will end down significantly, in part due to issuers accelerating deals at the end of 2017 ahead of 2018 tax changes. As we look to 2019, strategists are expecting $375 – $380 billion in supply, an estimated 6-7% increase vs. the current year. Low Q1 2018 supply creates easier forward comparisons, and an expected increase in infrastructure project financing should also facilitate a growth in 2019 supply. Even assuming these estimates prove accurate, 2019 would still see net negative issuance, a positive technical factor.
- With nominal yields rising, the 10-Yr AAA muni ended November at 2.51% vs. 1.98% at the beginning of 2018. With increased 2019 issuance likely, we anticipate good opportunities to put assets to work.
- We also see an environment conducive to moving up in credit quality. Tight credit spreads have reduced the muni risk premium of lower-rated bonds. With the market offering relatively low compensation for taking credit risk, portfolio reallocations that enhance credit quality merit consideration.
Taxable Markets
- Corporate and Treasury sentiment in November followed a very similar path as the prior month, beginning on positive footing, but ending with risk assets out of favor. IG credit spreads pushed through 2-year highs to end the month, with the Bloomberg Barclays IG Index widening by 22 basis points to 137 over Treasuries. Uncertainty regarding global economic conditions was the primary culprit.
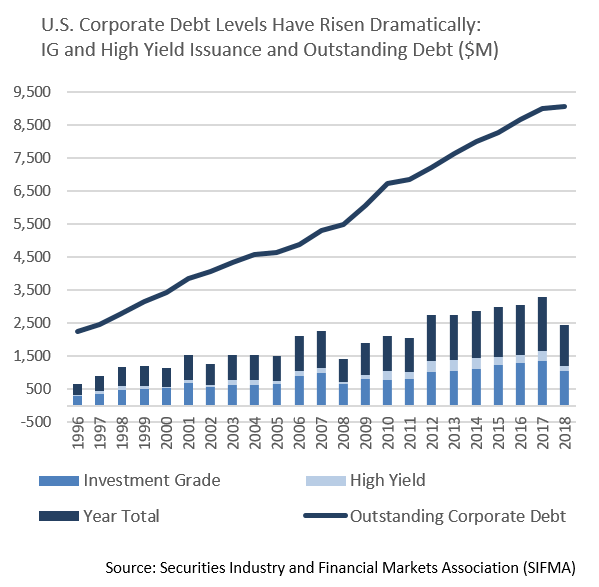
- Outstanding High Yield and lower quality IG debt has climbed to record levels, a development that has the Fed’s attention. The November 2018 FOMC meeting minutes stated that “several participants were concerned that the high level of debt in the non-financial business sector, and especially the high level of leveraged loans, made the economy more vulnerable to a sharp pullback in credit availability, which could exacerbate the effects of a negative shock on economic activity.” Lower grade credits tend to be more vulnerable to deteriorating market conditions, as once again demonstrated by reaction to recent equity volatility and slumping oil prices. While we do not anticipate an impending credit event, our higher quality orientation should help insulate portfolios as the market grapples with Fed policy and the economic outlook.
Financial Planning Perspectives
2018 Year-End Tax Planning Considerations
Following up on last month’s discussion of the 2017 Tax Cuts and Jobs Act (TCJA), here are some year-end tax planning suggestions. Taking proactive steps in December can help manage your 2018 tax liability while also aligning with personal goals and circumstances.
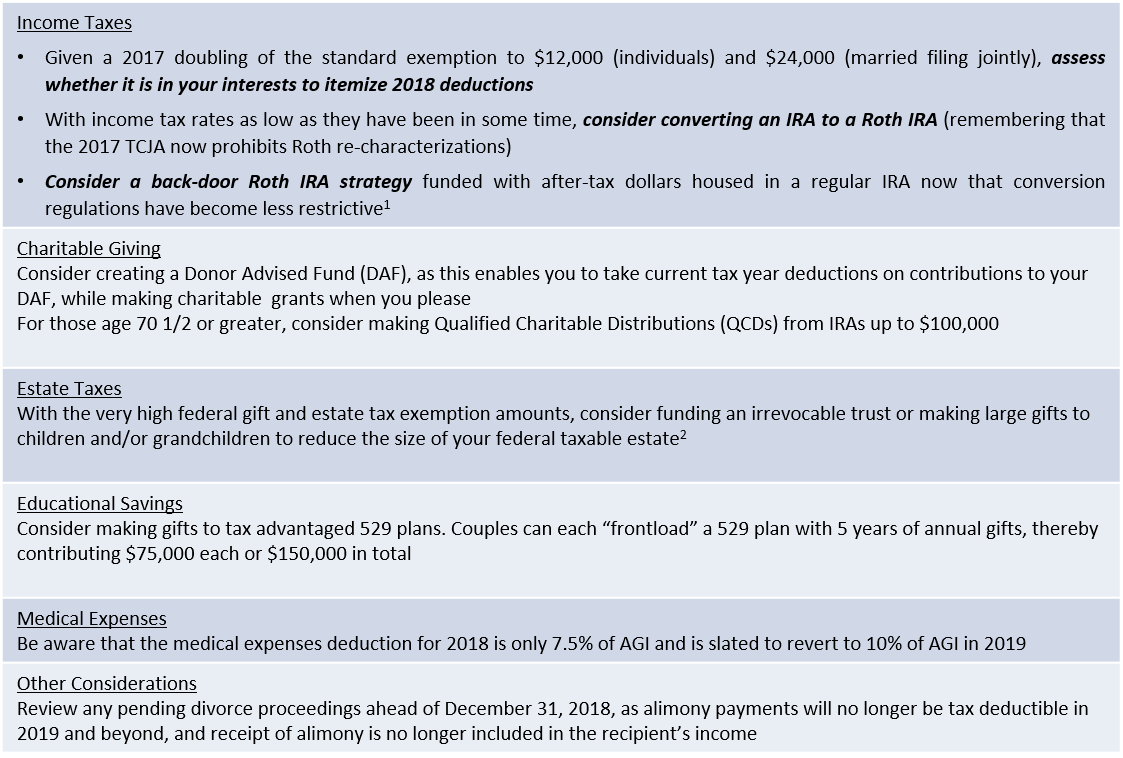
Above all, please do not hesitate to ask if we can help in thinking through tax planning strategies.
Wishing you all Happy Holidays and a Happy New Year!
- The IRS will look at all IRAs held by an individual in assessing Roth conversion eligibility.
- Remember that the individual tax provisions of the 2017 TCJA are expire as of 12/31/2025. The IRS also recently announced proposed regulations indicating that there will no “clawback” of any gift or estate tax exemption used if the unified credit amount reverts to pre-2018 levels ($5M indexed for inflation).
For questions concerning our financial planning or wealth management services, please contact
Jim O’Neil, Managing Director, 617-338-0700 x775, [email protected]


