Insights and Observations
Economic, Public Policy, and Fed Developments
- After several quiet months, trade tensions erupted in early May after President Trump accused the Chinese of “attempting to renegotiate” settled matters and implemented his long-delayed tariff increases on the 9th, the day before the parties had hoped to conclude a deal. China retaliated, extending tariffs which now encompass two-thirds of imports from the US. The conflict subsequently entered a new and dangerous phase with the US blacklisting Huawei (although granting a temporary reprieve), while the Chinese pondered a rare earth export ban and opened an investigation into FedEx. We have long held little hope for more than a symbolic deal, and even that now seems questionable; it is difficult to see how both sides can reach a meaningful agreement without losing face.
- Making matters worse, Trump spooked already-rattled markets by unexpectedly announcing a 5% tariff on all Mexican imports, steadily increasing to 25% by October unless Mexico takes undefined steps to stem the flow of immigrants at the border. As we publish, the White House announced an indefinite suspension of pending tariffs although agreement specifics are lacking. We are concerned that the Mexican tariff threats may impact business confidence beyond the immediate costs imposed, as are Congressional Republicans. Mexico was seen as a winner in the US-China feud as the USMCA agreement should have ensured certainty in cross border trade, but with even negotiated deals no longer offering protection from US tariffs, capital allocation decisions will be riskier. Further, simultaneously fighting trade wars on multiple fronts represents a concerning escalation, and the Administration merely delaying a decision on tariffs on cars from the EU and Japan did little to sooth markets.
- Political uncertainty also ticked up more broadly. Theresa May resigned as British Prime Minister after failing to deliver a Brexit deal, and with Conservative Party members (who favor a “hard” Brexit by more than 2-1) picking the next PM, the risk of a catastrophic no-deal Brexit has increased. At home, the ongoing fight over investigations into the President’s campaign and business dealings ground to an impasse. With the debt ceiling perhaps five months away and partisan rancor worsening, there may be further instability ahead.
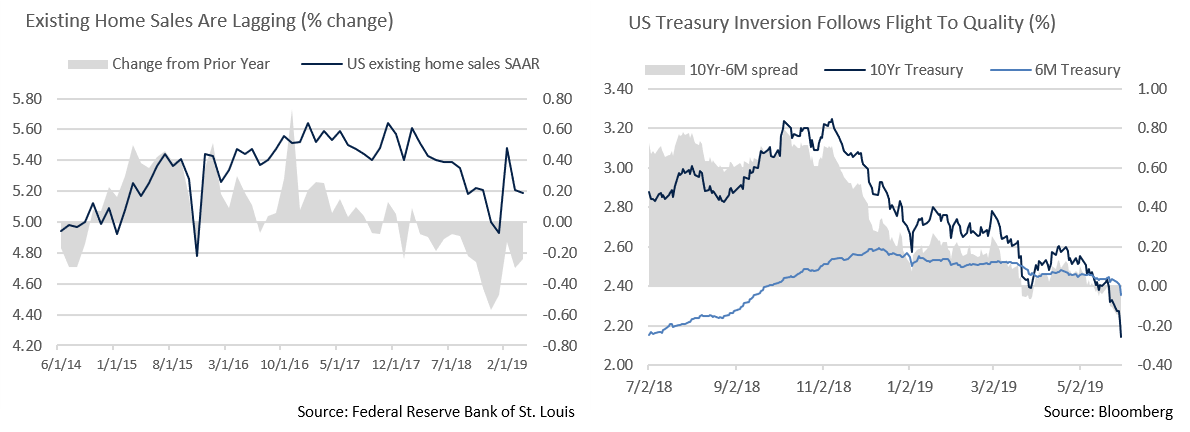
- Unsurprisingly, business confidence is suffering at home and abroad. The US ISM PMI index followed other world economies and dropped at month end to the lowest reading since 2016, missing expectations for a modest increase. US retail sales disappointed as well, with April sales ex-autos and gas dropping 0.2% vs. expectations of +0.3% growth, while housing sales continued what’s now a 14-month unbroken decline in year-over-year growth. With inventory levels high, both factors should weigh on the real economy, and we continue to expect a sharp drop off in Q2 US GDP.
- For these reasons, we are less inclined to dismiss May’s yield curve inversion in the same manner we did March’s. The sharp deterioration in trade talks with China and the significant disruption to cross-border supply chains Mexican tariffs would impose could have a long-term impact on growth, and we believe the likelihood of recession in the next 18 months has risen. Fed Funds futures now place odds of a rate cut by September at more than 92%, and we believe the Fed will have to bow to economic reality and cut rates. Powell acknowledged this on June 4th, noting the Fed was monitoring the implications of economic and trade developments, and opening the door to the potential for cuts if matters worsen. As has recently been the norm, the equity markets responded positively.

Equity News & Notes
A Look at the Markets
- Volatility returned to the equity markets in May as the major domestic indices experienced their first negative month of 2019. The S&P 500 ended on a four-week losing streak, the main driver of which was a ramp up in the global trade war and its anticipated impact on economic growth. How trade tensions will ultimately play out remains highly uncertain, but volatility is a part of investing. With the S&P 500 off nearly 7% from its all-time high at month’s end, it’s important to bear in mind that since 1980 the average annual drawdown has been 14%. Despite these intra-year declines, the S&P 500 has produced an average annual return of over 9.5% and positive returns in 3 out of 4 years.
- Stepping back from today’s headlines, the volatility we are experiencing is much more typical than the tranquility of February through April. The S&P 500 has experienced 16 daily moves of 1% or more in either direction YTD, 3 moves of 2% or more, and 1 of 3%. On a full year basis, since 1928 there have been an average of 60 1% moves, 17 2% moves, 7 3% moves, and 3 4% moves. The takeaway is that volatility, while often unsettling, is inherent in risk assets, and its presence can produce conditions from which attractive long-term returns materialize.
- At the risk of repetition, we return to trade, global economic expectations, and monetary policy, all of which are linked. It’s difficult to speculate day to day on trade, and negotiations might get worse before matters improve. Our guess is that we will have to wait until the G20 summit in late June before getting any real clarity. As for Mexico, government officials were meeting with their US counterparts as we write, and reports have surfaced suggesting that Mexico might do what it takes to avoid the tariffs. Pressure for a deal is also coming from within DC as many Republicans have been vocal in opposition. This administration has demonstrated that it measures its success on the health of the stock market, and we expect a more positive tone will emerge from the White House should volatility persist.
- The Fed temporarily soothed equity markets in recent days, with market averages regaining roughly 3% after Chairman Powell and colleagues emphasized that they will react to economic conditions as needed. Given recent global weakness and the lack of meaningful inflation, we see the Fed’s next move being at least one cut sometime in late 2019.
- May’s sector performance was typical of what you would expect in a risk-off environment. Defensives and bond proxies outperformed as the Real Estate, Utilities, Consumer Staples, and Healthcare sectors outpaced the broader market. Energy was the biggest laggard by far, as the price of oil dropped by over 15%. Technology shares also trailed once the trade war with China spilled over into technology bans and sanctions, while mega-cap leaders (AMZN, GOOG, FB, AAPL) were also hit by the possibility of FTC and DOJ investigations. Such investigations are not new and, if opened, would likely carry on for many months, if not years. With an election quickly approaching, we question the motivations of elected officials.
- Looking at the big picture, we are advising clients to stay the course for now. As of June 6th, the S&P 500 has regained its 200-day moving average and found support after hitting arguably oversold conditions. Weighing positives such as an accommodative Fed, low interest rates, subdued inflation, and still strong corporate earnings against uncertain global trade and related policy risks, we see the S&P 500 finding support in the 2700-2750 range. However, we will likely be capped at a 2850-2900 level unless there is favorable trade clarity relative to China, Mexico and other major partners.

From the Trading Desk
Municipal Markets
- Municipal technical factors remain supportive with strong demand showing no signs of abating amid recently volatile markets for equities and other risk assets. Municipal mutual funds have seen 21 consecutive weeks of inflows, bringing the YTD total to over $37 billion. For reference, this YTD net inflow is more than 3 times larger than the cumulative high of 2018 and double that of 2017. As for supply, through the end of May, issuance of $132 billion is up only 1% vs. the same period of last year. May’s monthly figure fell short of 2018’s comparable period by 17%.
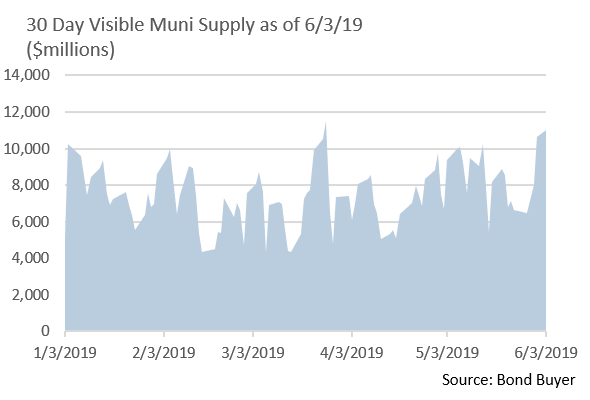
- We have commented on several occasions on how sustained demand coupled with limited supply, while positive for performance, has made finding municipal inventory challenging. It is worth noting though that 30-day visible supply is up to $11 billion, the highest it has been since March. This is a welcome development as we look to put client assets to work.
- May closed with a flight to quality, and yields across the muni curve fell along with Treasuries and are now down 10 to 25 basis points over the course of Q2. The 10-year muni/treasury ratio stood at 78.5% as of June 3rd after hovering in the low 70s for the early part of May. Despite strong municipal performance, the ratio moved up given the very sharp recent decline in US Treasury yields. We expect the muni/treasury ratio to recede a bit as we approach summer months that have traditionally been characterized by negative net issuance.

Taxable Markets
- In the face of renewed volatility and a late month risk-off trade, the US Treasury Curve experienced a significant flattening and inversion (10Yr relative to 3 and 6-month bills) for the second time this year. Maturities from 2 to 30 years moved between 34 to 40 basis points. While the very front end of the Treasury curve remained anchored, 10Yr yields sank to a YTD low of 2.13% at month’s end, a response to global growth concerns, another round of trade fears, and dovish Fed response expectations.
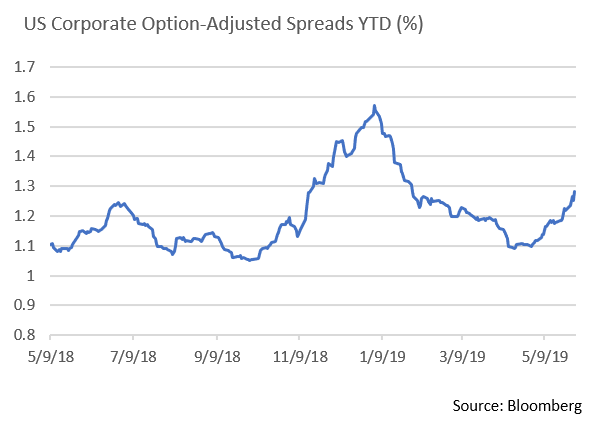
- Investor tolerance for risk assets appears to be weakening as the global economic and political picture becomes cloudier. On an OAS basis, US High Grade bond spreads widened 11 basis points in May to 122 and investors pulled money out of Investment Grade bond funds for the first time in 16 weeks. Signs of risk aversion after a long period of credit strength is having its effects on the new issue market, as issuers are finding it more challenging to offer debt. Lower-tiered BBB debt issuers are perhaps most impacted with the primary market place requiring higher concessions to get deals done. Of the roughly $485 billion in YTD Investment Grade issuance (ex-EM), 36% has been in the BBB rating category, a credit tier that now accounts for more than 50% of the total Investment Grade market. The implication we see is that a longstanding benign corporate credit environment is showing signs of strain. Although corporate credit conditions are still largely favorable, we continue to emphasize liquid, higher grade issues in our taxable and crossover portfolios.

Financial Planning Perspectives
Opportunity Zones Offer Economic Development and HNW Investment Promise
What’s the buzz all about?
The 2017 US Tax Cuts and Jobs Act created powerful tax incentives to promote private investment in economically distressed communities. In June 2018 the IRS released a list of 8,700 designated Qualified Opportunity Zones spread across all 50 states and 5 territories that will remain in effect for 10 years. According to the Economic Innovation Group, the average poverty rate within these census tracks is 29% vs. 13% for the US at large.
What are Qualified Opportunity Zone Funds?
Qualified Opportunity Zone Funds (QOZFs) operate as investment vehicles with the purpose of making capital investments within eligible Opportunity Zones. At least 90% of the QOZF’s assets must be invested in qualified opportunity zone businesses and property. Assets acquired by the QOZF must receive additional investment to “substantially improve” the property within 30 months.
What are the qualifications and benefits of investing in an Opportunity Zone Fund?
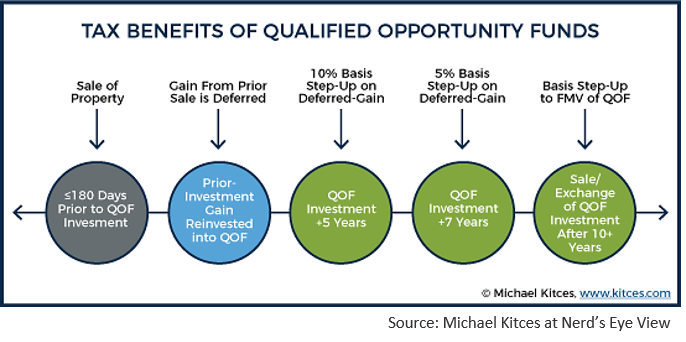
The IRS now affords private investors an ability to reinvest realized short and long-term gains from the sale of capital assets into a QOZF within 180 days from the date of the gain recognition. The benefits of doing so include deferral and/or reduction of capital gains taxes due, along with the possibility of tax-free appreciation of the investment in the QOZF.
Tax on a capital gain invested in a QOZF is deferred until the earlier of the date the interest in the QOZF is sold, or December 31, 2026. If investments are held for a minimum of 5 years, 10% of the capital gain invested is excluded from Federal tax owed upon the sale of the QOZF interest. If held for at least 7 years, 15% of the original capital gain invested can be excluded from Federal taxes. If the QOZF interest is held for 10 years, all appreciation is Federally tax-free.
Opportunity Zone legislation has given HNW investors with capital gain tax liabilities an ability to enjoy long-term tax benefits while contributing to economic development. For those looking to receive the entire 15% income tax basis increase, the initial QOZF investment must be made on or before December 31, 2019.

Introducing Appleton Municipal Opportunity Zone Credit
Appleton Partners does not offer Opportunity Zone Funds; however, we feel the benefits of Opportunity Zone legislation will extend to certain municipal bond issuers. Accordingly, we developed a specialized separate account strategy offering clients access to liquid, investment grade tax-exempt bonds where we anticipate Opportunity Zone-related credit catalyst potential is greatest. Our research team is identifying bond issues with both fundamental value and the potential for credit upgrades and price appreciation due to increased business activity within Opportunity Zones.
For questions concerning our financial planning or wealth management services, please contact
Jim O’Neil, Managing Director, 617-338-0700 x775, [email protected]


