


Insights and Observations
Economic, Public Policy, and Fed Developments
- Washington’s debt ceiling showdown might have dominated the news in May, but it ultimately proved to be a non-event. We became more confident in the outcome once President Biden and Speaker McCarthy stepped back and appointed a team of negotiators, and while both men’s public remarks continued to cause market gyrations, the eventual compromise passed with broad bipartisan support.
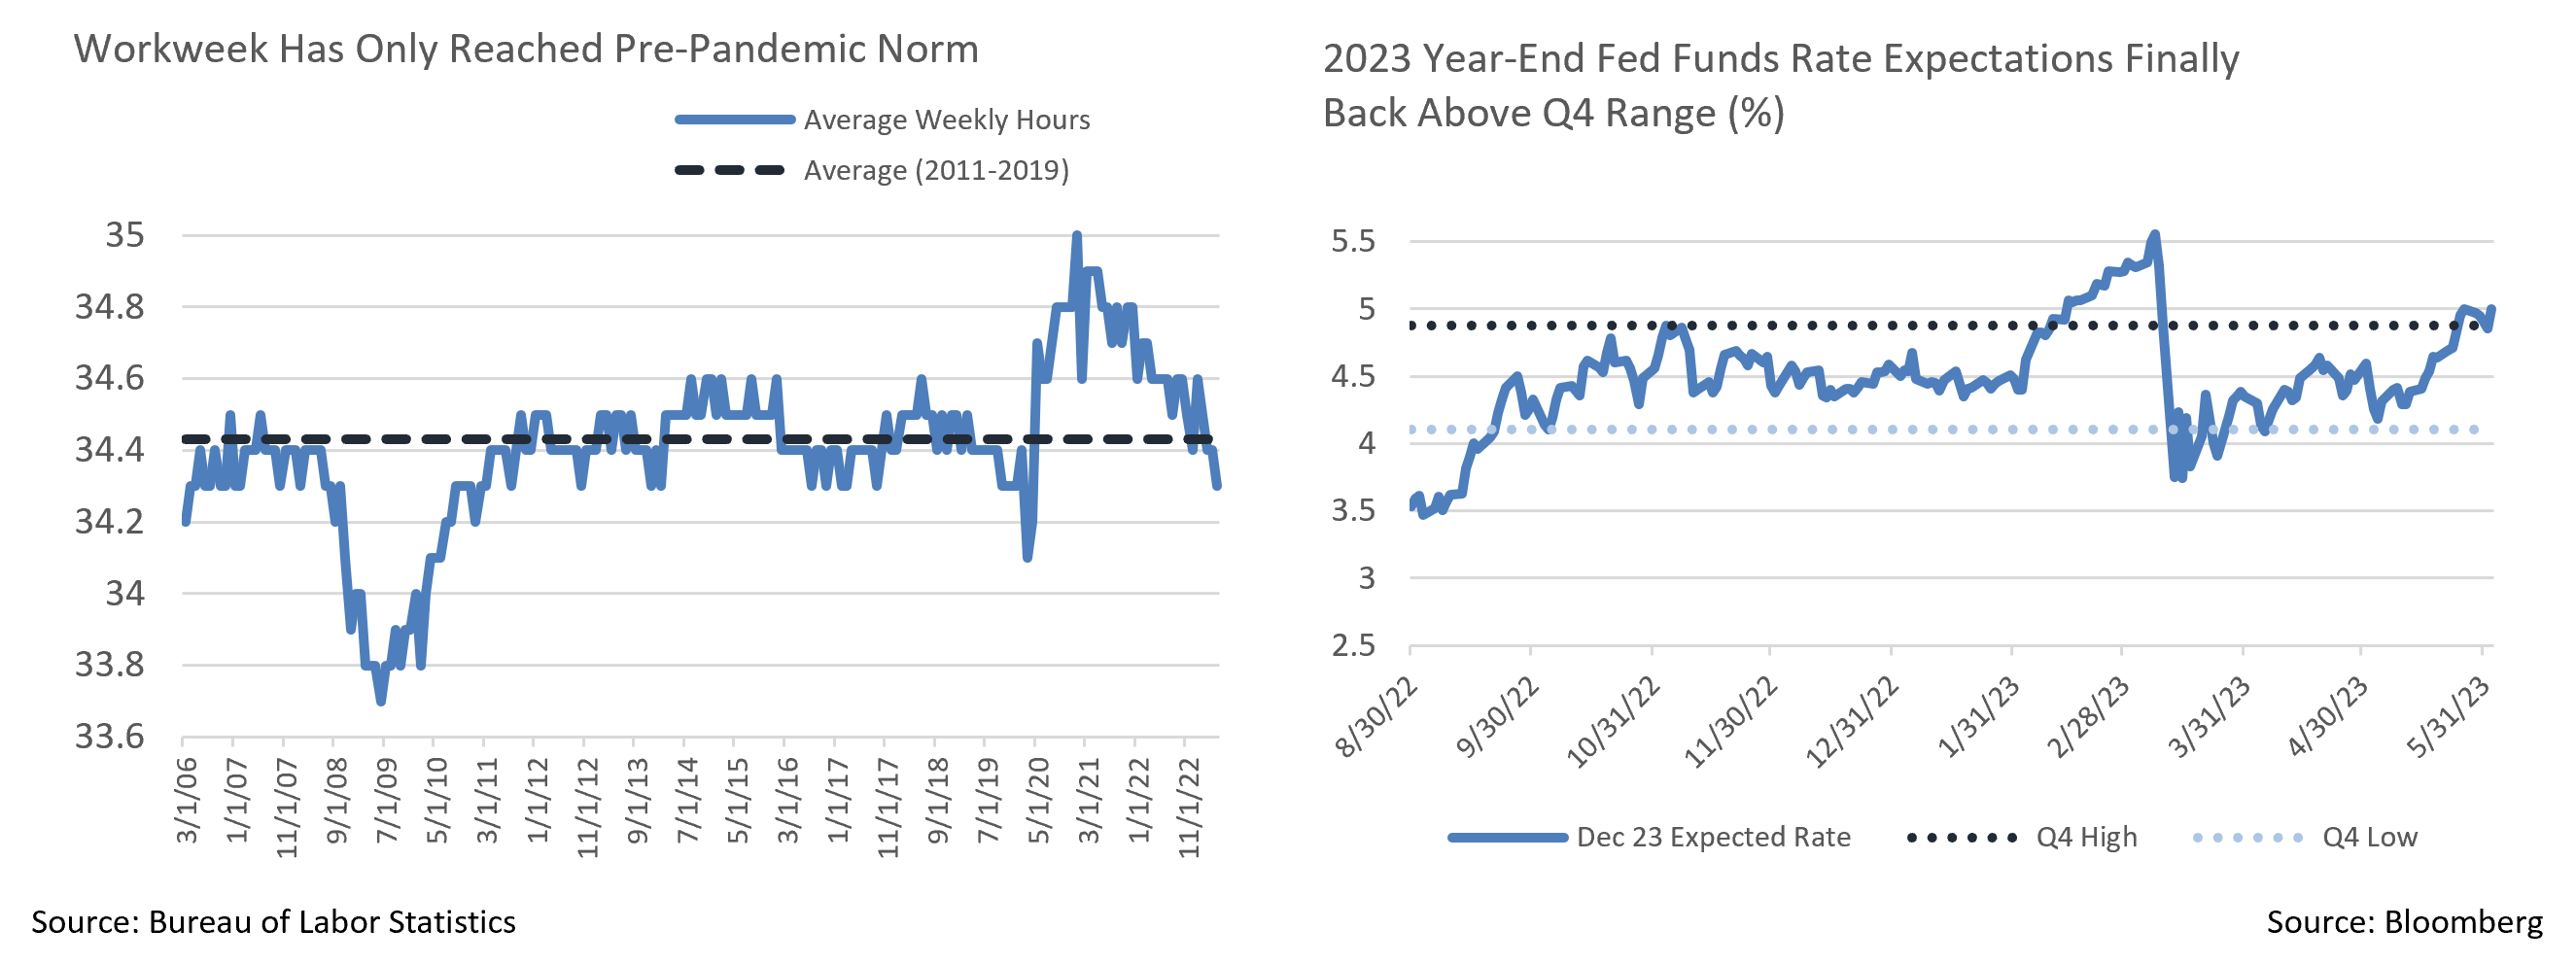
- This drama distracted from an important shift in market expectation concerning FOMC’s rate policy, however. At the start of the month, markets believed the FOMC hiking cycle was over and three rate cuts were likely before year-end. A hawkish litany of Fedspeak coupled with unexpected strength in economic releases shifted this consensus. At present, futures pricing suggests one more hike by July and then a reversal of that hike plus, possibly, a cut by December. This pulled up yields across the curve, with the policy-sensitive 2Yr UST rising about 50 bps and the 10Yr a more modest 20 bps. The market-implied year-end Fed Funds rate is now comfortably above the range of last fall and early spring. Commentary at the time widely attributed these increases to concern over default; we believe the recent shift reflected a change in expected Fed policy and renewed signs of economic strength.
- A pair of releases demonstrating this vibrancy were the retail sales and consumer spending reports. These followed a familiar pattern in May, where a superficially weak retail sales report (which was rather strong under the surface) lulled the markets before the consumer spending release called attention to that underlying strength. Headline retail sales came in at half the expected 0.8%. However, this series is very light on services spending, and both ex-autos and gas and “control group” sales (which feed GDP) handily beat expectations. Markets largely focused on the headline report, until the consumer spending report – which reflects services spending at actual weights – came in well above expectations. A surprise came with unexpectedly robust goods spending, which had been weak but mirrored an uptick in goods inflation in May’s CPI inflation.
- The inflation reports themselves also evidenced a healthy consumer. While PPI has returned to a range broadly consistent with price stability, the Fed’s preferred PCE measure remains uncomfortably high and has started to accelerate. Powell’s preferred “super-core” CPI measure meanwhile stands at about 4.5%, which we see as far too high to allow the Fed to ease their tightening campaign.
- May’s BLS employment report gave the Fed another reason to remain vigilant. The 339k newly created jobs were well over the consensus of 195k, making this the 14th consecutive beat. The report’s strength was widespread, and sustained growth in transportation and warehousing suggests economic softening is not imminent. While the average workweek fell a tenth, moderating some of this labor strength, it has only just returned to its pre-pandemic range. While some see this as evidence of a cooling economy, we disagree.
- May brought the market significantly closer to our internal Fed Funds forecast, but we still see differences. We expect at least one more hike, and the Fed to then hold rates steady through year-end and potentially beyond. The market consensus is for a June pause; we feel any further strength in June CPI and PPI could very well cause the Fed to hike on the 14th, and regardless of their policy decision, their year-end rate forecast is likely to be revised higher. This should cause further bear steepening and higher rates in the short term.
Equity News and Notes
A Look at the Markets
- Stocks were mixed in May as the S&P 500 and Nasdaq advanced for the third straight month while the DJIA fell -3.5% and the Russell 2000 dropped -1.1%, leaving the small-cap index with a fourth straight month of losses. The S&P 500’s modest monthly gain of +0.25% raised YTD total return to a healthy +9.6%, ~17% above the October low. Nasdaq has led the way of late, gaining +5.8% in May to bring the YTD return to +24.1%, ~27% ahead of December’s low.
- Narrow, mega-cap tech leadership was a main storyline in May as the FANG+ subset drove market performance with a +17.2% monthly increase. Renewed outperformance from big tech led to a divergence between the cap-weighted S&P 500 and its equal-weighted version. Notably, the equal-weighted S&P 500 is negative for the year vs. +9% for cap-weighted. This performance gap coincided with interest rates peaking in early March as higher interest rates had weighed down tech shares in 2022. That trade has reversed as rates have come down modestly with the Fed signaling a potential pause in the hiking cycle.
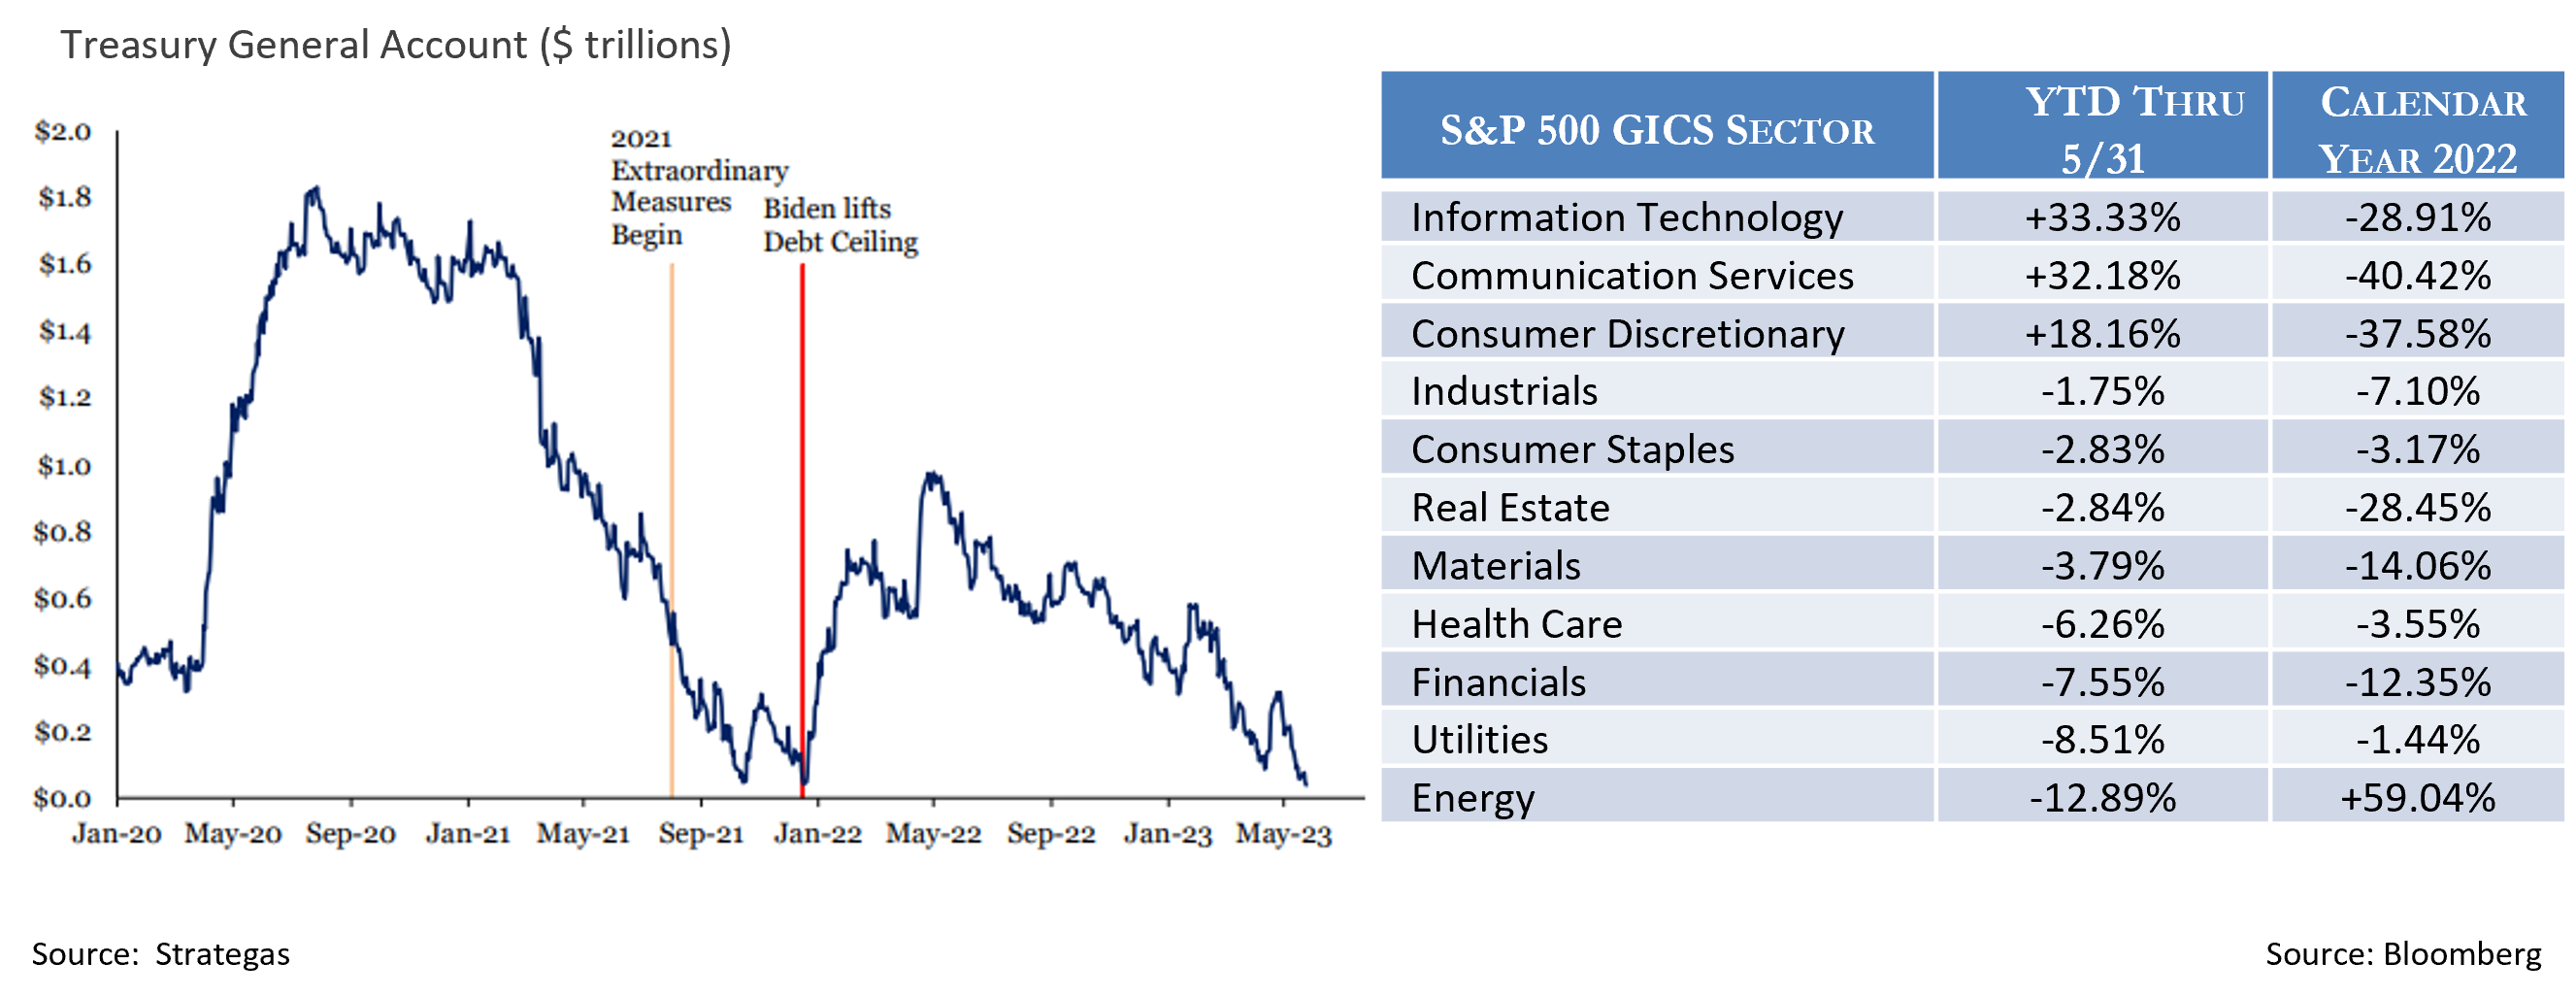
- The divergence underlying the aggregate index can clearly be seen through sector performance. Only 3 out of 11 sectors are positive on the year despite the headline index’s +9% advance. Those 3 sectors (Tech, Comm. Services, and Cons. Disc.) are largely comprised of growth stocks, and many were 2022 performance laggards in the face of sustained rate hikes. A shift in the environment so far in 2023 has fueled large cap growth stocks’ outperformance vs. large value of over 22%. Some of this is due to enthusiasm over artificial intelligence, along with money rotating into high quality, mega-cap names viewed as better situated to deal with a slowing economy. However, let’s remember that large value outperformed large growth by over 20% last year, so some of this year’s skew reflects a rotation back into last year’s laggards.
- The debt ceiling saga dominated the news in May, diverting considerable investor attention as negotiations transpired against the threat of a potential default. As expected, an agreement was reached towards the end of the month and investors cheered the news. While we are pleased to see this resolved, negative liquidity consequences of this deal can not be ignored. Over the past year, the Treasury has been withdrawing funds from the Treasury General Account (TGA) to avoid breaching the debt ceiling given constraints on issuing new debt. Winding down the TGA has provided liquidity to the market and likely blunted some of the impact of the Fed’s quantitative tightening (QT) program. With the debt ceiling raised, Treasury will need to flood the market with new debt and most of these proceeds will replenish their coffers rather than adding to market liquidity, a similar dynamic as played out in 2021.
- Against this backdrop, the Fed may not hike the Fed Funds rate at the coming June meeting, a prospect that cheered investors as June began. Fed officials will need to assess the impact of a potential drop in liquidity along with the state of the economy, still stubborn inflation, and tighter credit conditions stemming from recent bank stress.
- While the S&P 500 has struggled to meaningfully break above the 4,200 level, we see some positive signals from recent price action. The closely watched 200-day moving average is now more than 1% above its 52-week low set back in late March. This has happened 20 other times in the history of the index and in every instance, the index was higher a year ahead with a median gain of +14.4%. The index has also historically fared well when getting off to a strong start, defined as >8% through the first 100 trading days.
From the Trading Desk
Municipal Markets
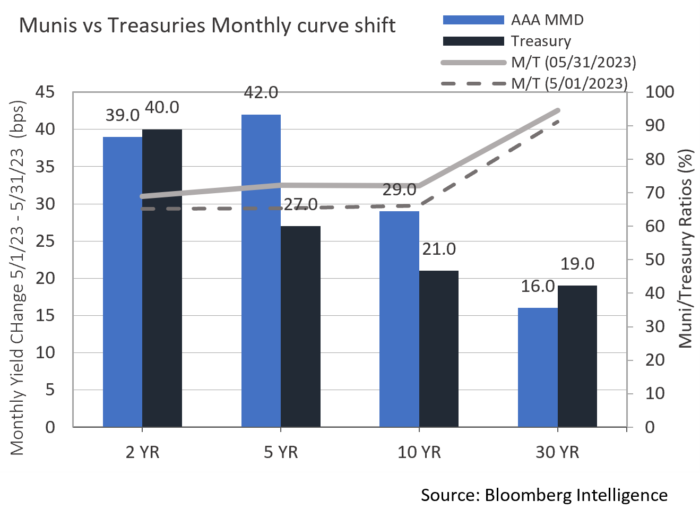
- May began with investors anticipating the results of a long awaited FOMC meeting. Municipal yields were mostly unchanged across the curve over the first week with a positive market tone. Modestly tightening credit spreads were driven by light supply and net cash inflows. The Fed’s decision to raise by 25 bps was not a surprise, and relative valuation remained steady as 5, 10 and 30-year Muni/UST ratios closed on May 4th at 69%, 69% and 91%, respectively.
- With the FOMC decision out of the way, municipal yields reacted more slowly than Treasuries due largely to positive technical factors. Cash inflows, pending June interest and maturity payments, and a lagging new issue market have offered support to municipal prices. June will have more than $45 billion coming back to investors, up from $28 billion maturing in May. Over the June – August period, it is expected that there will be a net negative supply of $33 billion, a dynamic that is keeping inventory relatively tight. Furthermore, new issuance in May fell 29% from the same period of 2022.
- Nonetheless, municipal yields began to rise as much as 36 bps by mid-month on the front end and 24 bps on 10-year issues. As the month moved on several large deals came to market along with a large bank list released for the bid, and the pressure of rising rates was felt. With more bonds available and new issue deals getting cheaper, we used the opportunity to invest at more desirable yields. Shorter maturity yields moved up more rapidly, 39 bps for the 2-year vs. 16 bps on 30-year AAAs. As the month closed, valuation modestly improved along the curve with 5, 10 and 30-year maturities bumping up Muni/UST ratios to 74%, 73%, and 92%, respectively.
- As we look ahead, duration should be a strong driver of performance and we are working to maintain our targets while still retaining the flexibility to offset longer positions in the 10+ year portion of the curve with attractive shorter maturities.
Corporate Bond Markets
- After a slight widening trend over the first half of the month, Investment Grade spreads moved into rally mode to close it out. A month ending 138 OAS on the Bloomberg US Corporate Bond Index was just 2 bps from where we began, but roughly 10 bps off the peak. While the market has not fully recovered on a spread basis from March’s banking debacle, it feels as if a trading range has been found that should hold over the near term as investors await the Fed meeting in June.
- Driving this past month’s spread move was a slight flight to quality as higher quality outpaced lower quality bonds in the face of a back-and-forth debate over the debt ceiling and its associated risks. We expect high quality credit spreads to remain range bound over the near term with a breakout in either direction unlikely. Reaching the YTD tights seen in February is improbable in our view.
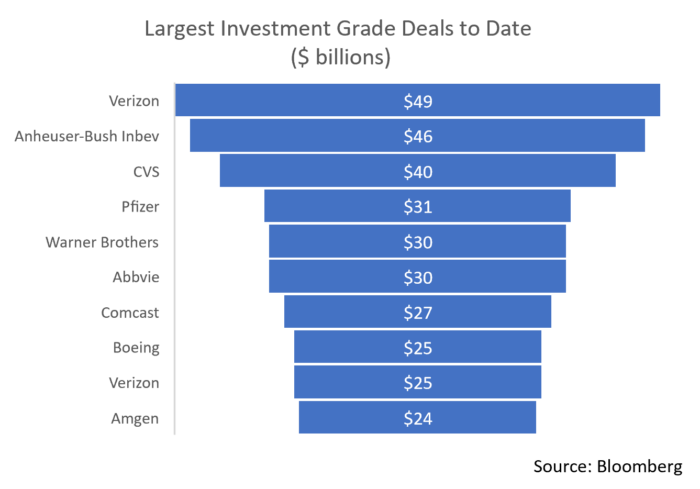
- May was well on its way to becoming 2023’s largest month of primary market issuance but missed the mark by about $2 billion. The $149.45 billion brought to market beat a consensus estimate of $135 billion, a result that speaks positively of IG market sentiment. Leading the charge was Pfizer’s $31 billion mega deal that is slated to fund a not yet approved acquisition of Seagen Inc. It was the fourth largest deal on record and the biggest since CVS came with $40 billion in 2018. It was priced accordingly, and deal concessions were unusually high for a solid A rated name. The deal’s attractive pricing created significant demand ($85 billion) and spreads quickly tightened in the secondary market once bonds were free to trade. The deal came off without issue, passing a meaningful test of investor appetite and the market’s ability to absorb substantial levels of debt. We see this as a positive as the end of Q2 approaches. June issuance is also expected to slow to $80 – $100 billion, a technical factor that should be supportive of IG Credit.
Financial Planning Perspectives
The Triple Tax Advantage of Health Savings Accounts
 As Americans contemplate retirement tax planning, the rising cost of healthcare and health care related expenses represent common concerns. According to the American Medical Association (AMA), the US spent 18.3% of GDP on healthcare in 2021, a statistic that speaks to the importance of healthcare planning.1
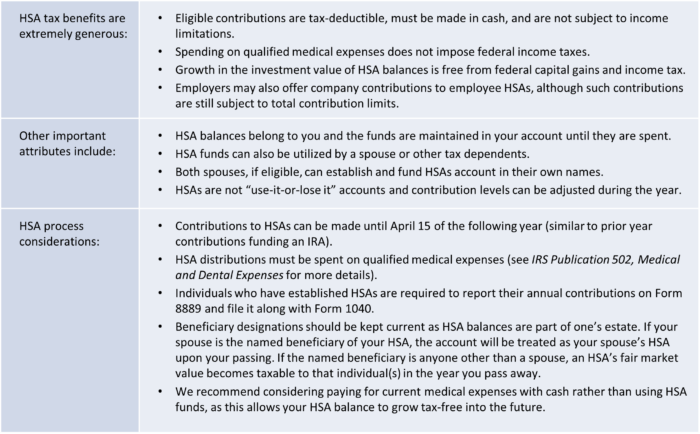
Against a backdrop of ever-increasing health care costs, Health Savings Accounts (HSAs) represent an appealing vehicle designed to meet current and future healthcare expenses more efficiently, while also providing significant income tax benefits. Introduced in 2003, HSAs became available to US taxpayers on January 1, 2004.
HSAs are only accessible to individuals and families with High Deductible Health Plans (HDHPs) who are not currently enrolled in Medicare. As per IRS regulation, HDHPs are plans with deductibles of $1,500 for individual plans and $3,000 for family plans. Furthermore, HDHPs must have yearly out of pocket maximum spending of no more than $7,500 for an individual and $15,000 for families.
In 2023 individuals became eligible to contribute up to $3,850 and $7,750 for families into an HSA provided they are enrolled in a qualifying HDHP. Those over the age of 55 can increase their HSA contributions through an additional $1000 catch-up provision.
For more information, we recommend visiting the following websites or speaking to your Appleton portfolio manager.
www.HealthCare.gov/high-deductible-health-plan
1.https://ama-assn.org/about/trends-health-care-spending