Insights and Observations
Economic, Public Policy, and Fed Developments
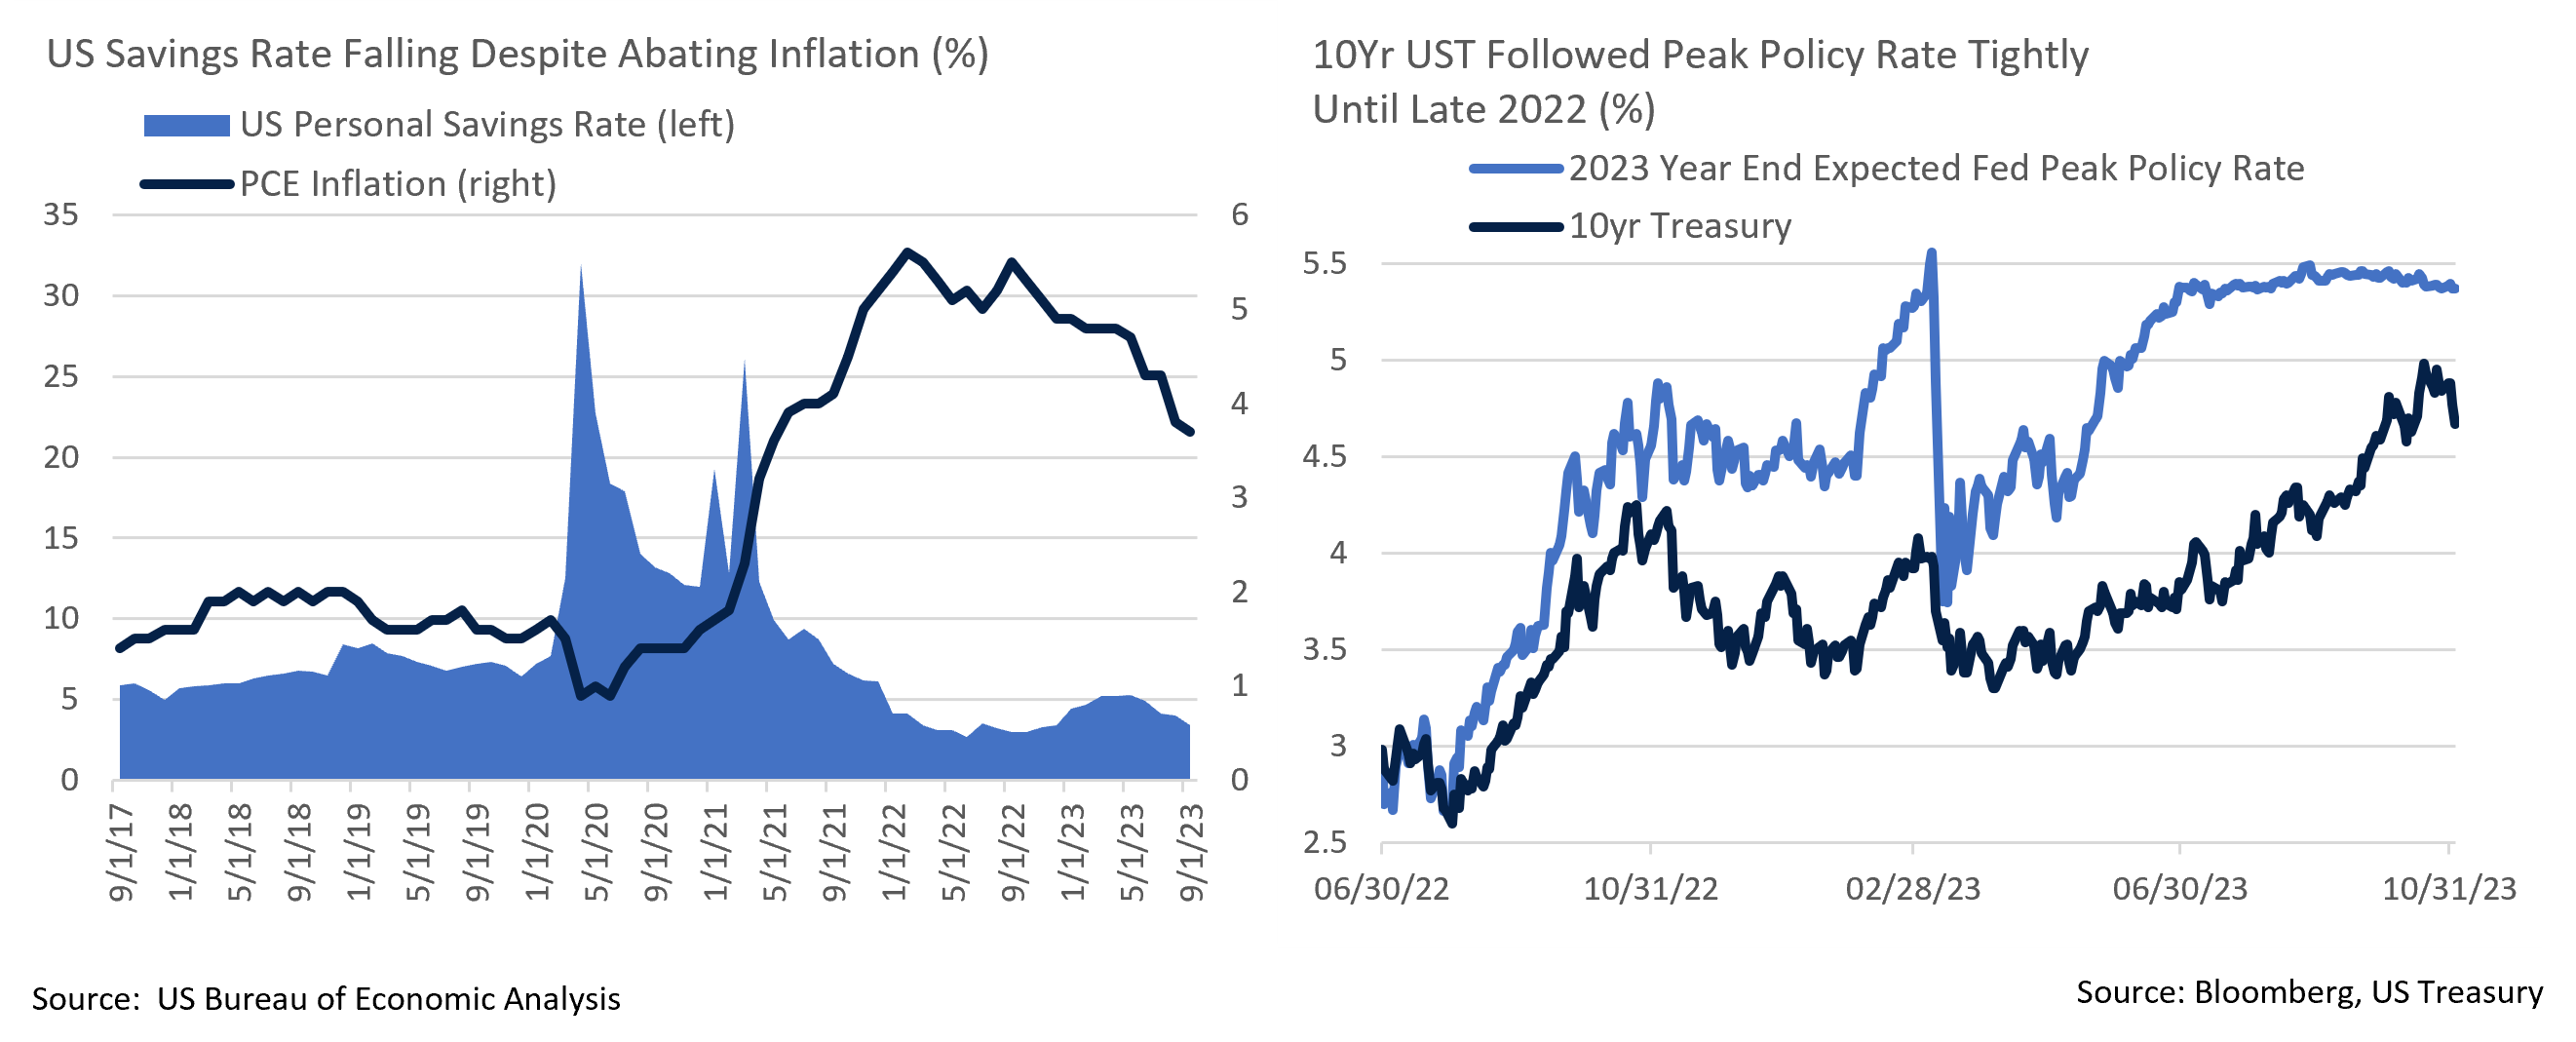
- As the end of the Federal Reserve’s hiking cycle approaches, the Fed Funds Rate has taken a backseat to other factors in explaining longer dated yields. This was evident through October’s rate volatility, as the 10Yr UST briefly breached 5% for the first time since 2007. We believe a combination of traditional supply and demand factors and investor sentiment are at play here.
- The supply side of the Treasury equation improved in October; first a quarterly refunding estimation of $776 billion came in well below expectations of $850 billion on higher deferred tax receipts, and then the next day’s announcement of lower-than-expected October issuance and only one more anticipated quarterly refunding increase was met with a market rally. There are still risks; we feel that the fourth times a charm election of Mike Johnson as Speaker of the House may be setting the stage for another shutdown in two weeks’ time, a story that should be getting more attention than it is. However, the US budget deficit being less bad than feared has provided support to bonds.
- The demand side is less encouraging. The Bank of Japan’s messaging around their yield curve control policies has been perhaps intentionally blurry. But, they are clearly easing, and with Japanese investors holding roughly $3 trillion in overseas bonds, any upwards movement in JPY yields will make domestic debt more attractive, potentially pressuring Treasuries. And while the default of Chinese mega real estate developer Country Garden brought surprisingly little market reaction, China’s real estate sector is clearly in trouble and the country has been selling Treasuries for some time to support their currency. Finally, in an impressively noncommittal press conference on November 1st, Jerome Powell indicated the Fed had no intentions of slowing their balance sheet reduction. With major price-insensitive Treasury buyers stepping back, it’s unsurprising that investor sentiment appears to increasingly be driving the Treasury market.
- If sentiment has become more important to rates, then the next few months should be interesting. Q3 showed impressive economic strength, with surging consumer spending driving GDP growth to an initial annualized estimate of +4.9%. However, we’ve also seen disagreement between backwards-looking hard data releases showing strength through quarter-end, and forward-looking investor surveys that suggest a sharp deterioration in October. Notably, the Fed Beige Book revealed economic activity coming to a standstill in most districts, and the ISM Manufacturing report slipped back towards its summer lows. Caterpillar, an industrial bellwether, also reported strong earnings in September but lowered guidance. It could very well be that sentiment has soured in spite of solid growth, but it’s possible that the surveys are picking up an inflection point that the activity-based indices will begin to show as October releases are reported. If so, this suggests rates may fall.
- Some evidence already supports this shift. The consumer savings rate continues to soften, and it is now well below its pre-pandemic average, even after recent upwards revisions suggested consumers were better off during the pandemic than data had initially shown. With consumer spending responsible for nearly 2.7 percentage points of Q3’s +4.9% growth, and inventory increases adding a further 1.3%, shrinking ability to spend could cause growth to stall. October’s somewhat tepid unemployment report also revealed moderating job growth in the establishment survey, but a sizable drop of nearly 350k in the household raised the unemployment rate to 3.9%. This is an early hard data point that supports recent survey weakness.
Equity News and Notes
A Look at the Markets
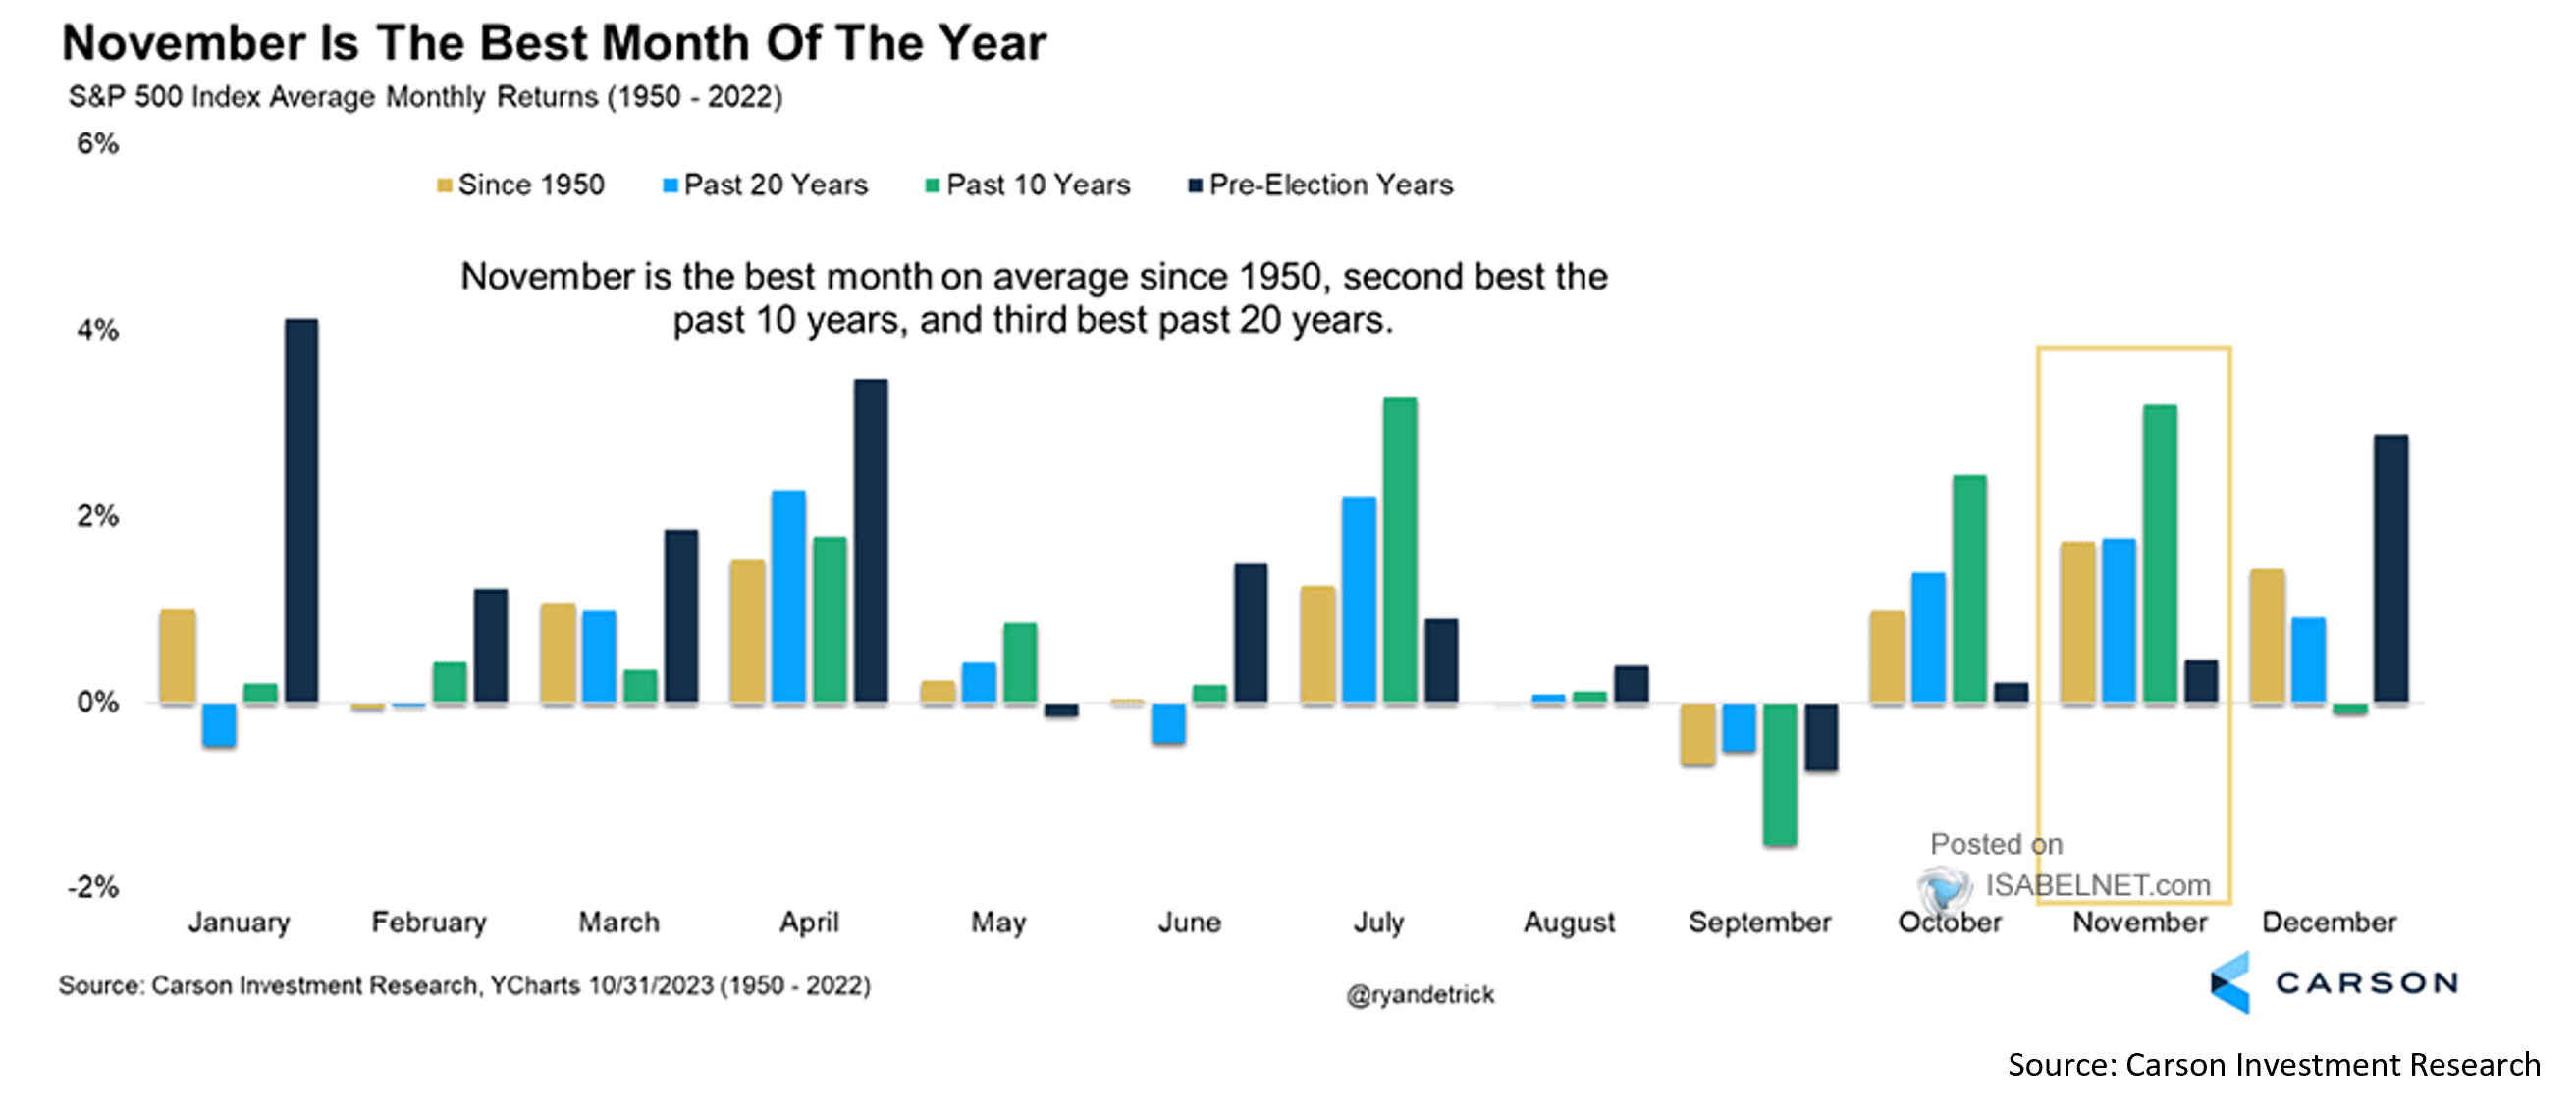
- Stocks continued to slide in October as the S&P 500 dropped 2.2% leaving the index with its first 3-month losing streak in over 3 years. Stocks fell each month from August through October for only the sixth time since 1950. The DJIA (-1.4%) and Nasdaq (-2.8%) each finished within a percent of the S&P, although small caps underperformed (-6.9% for the month). With stocks on the defensive, Utilities (+1.2%) were the lone sector to end the month higher, while Energy (-6.1%) lagged due to a 10.8% decline in WTI crude prices. Large Growth outpaced Large Value by over 2%, raising the YTD gap to nearly 26%.
- Volatility in the bond market was the most notable headwind for stocks in October. Positive economic data (resilient consumer, tight labor market, +4.9% GDP print) kept the Fed’s message of “higher-for-longer” top of mind. The 10Yr UST briefly traded above 5%, closing the month 36 bps higher due in part to increased supply, decreased foreign buying and softer overall auction demand, as well as continued quantitative tightening. Another notable headwind arose with the onset of war in the Middle East following the October 7th attack on Israel. Despite extensive humanitarian concerns, the stock market has historically looked past geopolitical turmoil, particularly in situations viewed as having limited global economic ramifications. Nonetheless, market participants will be looking for signs of escalation such as larger players entering the conflict.
- Another potential concern is lack of market breadth. The so called “Magnificent 7” (AAPL, MSFT, GOOG, AMZN, TSLA, NVDA, and META) have dramatically outperformed, posting a +78% equal weighted YTD return. The extent of performance divergence can be seen through the equal weighted S&P 500 as this index trails the more widely quoted capitalization weighted S&P 500 by 13.2% YTD, the largest gap in the history of the equal weighted index. In the current environment, we still favor larger companies with quality earnings and strong balance sheets. However, a catch-up trade that sees YTD laggards gain ground as breadth expands would not be a surprise and we are maintaining a diverse, quality biased approach.
- The market is also contending with Q3 earnings season, now just over 50% completed, and results have been mixed. While an above average 78% of reporting companies have exceeded EPS expectations, only 62% beat on revenues, lagging the recent trendline. The EPS beat margin is a healthy +7.7%, a result that has raised the S&P 500’s blended earnings growth rate to +2.7% for the quarter. This compares favorably to a September 30th expectation of -0.3% growth. Our research is emphasizing profit margins (recently reported at an above average 12.0%), and 2024 earnings estimates, which are stabilizing at +12% growth over 2023. While the forward P/E multiple is now a more reasonable 17.1x, further expansion will be challenging given the rate environment, making earnings growth ever more important.
- The silver lining to the 3-month correction in the S&P 500 and Nasdaq is that it sets up well for a YTD rally. Both indexes moved below their 200-day moving average and appear oversold based on several statistical metrics, including RSI, stochastics, and internals such as % of stocks >10-day moving average. Sentiment is weak, which can be a positive contrarian indicator. Commodity Trading Advisors ended the month with the highest net short position in over 8 years, hedge funds are the least long stocks they have been in over 11 years, and the AAII survey revealed the greatest percentage of bears since May. Should stability in the bond market materialize, it could be a catalyst for stocks to rebound from their recent downdraft.

From the Trading Desk
Municipal Markets
- As the calendar turns to November, the same themes that carried us through recent months remain evident – municipal yields are still at after-tax highs, and favorable technicals should be bolstered by about $14 billion of net negative supply in November and December. Treasuries are also beginning to rally. Given these factors, the outlook for municipal returns should improve after a negative period marked by positive economic surprises, Treasury yield pressure, and geopolitical tensions.
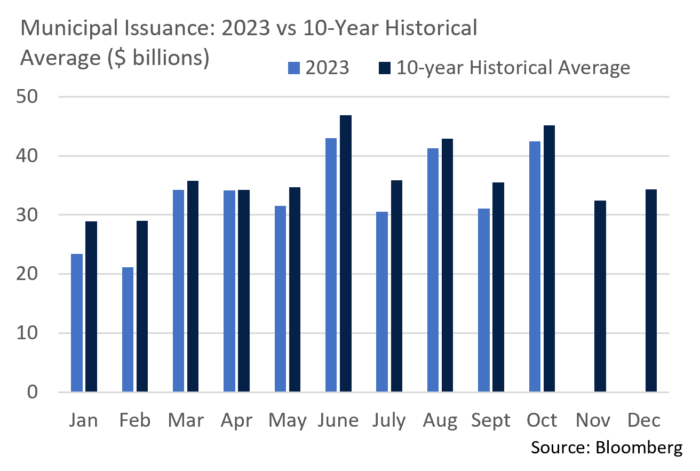
- Municipal supply gained some ground during October as YTD issuance now trails previous years by only about 7%, rather than early October’s 13%. However, November has historically been the 3rd weakest month, averaging about $32.4 billion over the past ten years. With a Federal Reserve meeting on the calendar, as well as Thanksgiving, we expect a seasonal primary market lull this year as well.
- Trading volume in the secondary market hit its highest level since December 2022 amid fund outflows and extensive tax related selling, much of which is being cycled back into new issues and well bid secondary market offerings. As we approach year end, tax motivated trading will drive the secondary market along with reaction to macroeconomic developments.
- Nominal yields on 10-year AAA munis of 3.60% exceed 6% on a tax-equivalent basis, the highest levels seen in over a decade. While the trajectory of Treasuries and other influences on the municipal market are inherently uncertain, we strongly believe current levels offer an attractive entry point for tax-exempt investors.
- The AAA curve is showing signs of normalization, as the inversion point has steadily shortened and now lies at 5 years. In intermediate accounts we are finding value in the 8 to 11-year maturity range, whereas more of a barbell structure had been emphasized earlier in the year.
Corporate Bond Markets
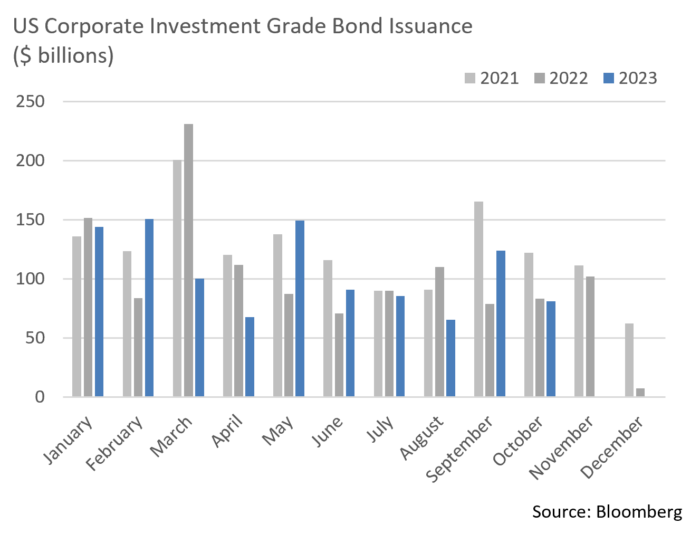
- In a surprise end to the month of October, the Investment Grade primary market engine kicked into high gear. Primary market issuance of $25.3 billion over the last week solidly beat expectations of $15-20 billion, raising the monthly total to a healthy $81 billion. Financials remain the most prolific sector coming to market, accounting for 65% of the monthly total and 45% of the YTD tally. Given curve structure, roughly 40% of all YTD IG issuance has come in maturities of 3 to 7-years. Despite considerable market volatility and upward pressure on rates, demand for credit has been sustained and we expect issuance to remain steady through the balance of 2023.
- Ford Motor Co. was not only in the news for being the first to cut a deal with the UAW, they were also granted a BBB- rating by S&P after being on positive outlook for two years. This not only propelled Ford back into the IG market for the third time, it added to the depth of the primary market. Demand for the $2.75 billion Ford brought to market was demonstrated by 10x oversubscription, another sign of healthy credit conditions, as was concessions of only 5 bps.
- The YTD average OAS on the Bloomberg US Corporate Credit Index was 129 at month’s end, exactly where it closed October. The 9 bps of widening experienced last month created some volatility as investors assessed economic conditions, but it was not unexpected. Spreads remain well within the ranges of the last 6 months and should stay steady as we close out the year.
- High Yield spreads have largely stayed stable, ending the month at 438 bps, roughly 18 bps above the YTD average. We do not invest in below investment grade names but follow the market carefully as an indication of credit appetite. Spread volatility occurs much more frequently in High Yield and, after a solid run, a risk off trajectory has begun to develop, a trend that warrants further scrutiny.

Financial Planning Perspectives
Tax Relief Comes to Massachusetts
An Onerous Estate Tax Is Finally Eased
Governor Maura Healey signed a much anticipated $561 million tax reduction package on October 4th that, in addition to curtailing short term capital gains rates and expanding the child and dependent care tax credit, increased the Massachusetts estate tax exemption to $2 million. This is the first update to Massachusetts estate tax laws since 2006. The update of the estate tax exemption becomes effective for individuals passing away on or after January 1, 2023.
In an attempt to make the Commonwealth more competitive from a tax landscape and to further stem the tide of resident outmigration, the General Court doubled what was the nation’s lowest estate tax exemption and made it a true $2 million exclusion. Under previous law, the $1 million estate tax exemption was a threshold, not an exemption, meaning that if an individual’s estate value surpassed that level, the Massachusetts estate tax kicked in and the decedent’s assets were effectively taxed back to dollar one (subjecting the entire estate to tax at progressive rates that began at 0.8% and increased to 16% for estates above $10 million).
After the passage of Bill H.4104, individuals can now fully exempt $2 million of assets from the reach of estate taxes ($4 million for married couples). Estate tax rates remain graduated, and the new rates start at 7.2% and rise as high as 16% for estates of more than $10 million (unchanged).
Estate tax details worth noting include the following:
- The estate tax applies to both residents and non-residents owning property in Massachusetts.
- For Massachusetts residents, property owned outside of the state is not taxed.
- There is no portability of the estate tax exemption (use it or lose it exemptions, unlike Federal).
- A Massachusetts estate tax return (M706) is required to be filed for estates in excess of $2 million.
- Unlike the Federal Estate Tax, the Massachusetts Estate Tax is not indexed for inflation.
- While the Commonwealth does not have a gift tax, MDOR continues to include previously taxable federal gifts in the value of the decedent’s estate.
We recommend several planning measures relative to the Massachusetts estate tax:
- Review trusts to insure they fully maximize estate tax exemptions.
- To the extent possible, make certain that both spouses have assets of $2 million in their own names.
- If a family member passed away in 2023 and an estate tax return will soon be filed, consider filing an extension as the MDOR will be updating forms and procedures based upon the new law.
Other Important Tax Developments
State short term capital gains rates also dropped from 12% to 8.5%, while the law also made several other important clarifications relating to the recently introduced Massachusetts Millionaires Tax. Under state law, married couples must file a joint Massachusetts income tax return in any year they file a Federal income tax return. It was previously understood that Massachusetts couples, while filing joint Federal income tax returns, had the option to file individually. If this loophole had not been closed, it would have allowed high income couples (up to $1 million each) to avoid paying the additional 4% surcharge on incomes above $1 million.
We are a resource for you and your family. If you have any questions on estate taxes or other financial planning matters, please contact your Portfolio Manager.
For questions concerning our financial planning or wealth management services, please contact:
Jim O’Neil, Managing Director
617-338-0700 x775 | [email protected]


