


Insights and Observations
Economic, Public Policy, and Fed Developments
- The biggest rate surprise last month came not from the US, but the UK. Prime Minister Liz Truss’s unexpectedly large, proposed tax cuts had the government engaged in stimulus while the Bank of England (BOE) was tightening, and adverse market reaction led to a collapse in the pound and a surge in Gilts. This briefly pushed the UST 10Yr above 4% intraday for the first time since 2010 until the BOE, fearing a collapse in leveraged pension funds, stepped in with another round of quantitative easing. This stabilized UK rates but will do little to quell inflation.
- This all came after an eventful start to the month. After welcome improvement in July, too-hot August CPI and PPI reports upwardly recalibrated market expectations for Fed Funds policy. Below the surface it was not all bleak – the percentage of CPI components increasing at an annualized rate greater than 4.0% fell to 71%. And, while the shelter component had the highest monthly print since 1991 at +0.69%, this represents a six-month rolling average and July and August median house price declines were the largest since 2009, suggesting a downward near-term trend.
- The Producer Price Index (PPI) garnered attention as core inflation surprised higher by a tenth to +0.4% month-over-month. Services inflation (+0.4%) was largely responsible, and with 60% of that gain attributable to a category including labor costs there was talk of a potential wage price spiral. However, two-thirds of the increase came from fuel and lubricants, and we believe the more likely explanation for PPI is that gas prices track oil price increases rapidly but decreases are reflected more slowly. This too should ease in coming months. Still, like CPI, this was hardly an inflation report the Fed was hoping to see.
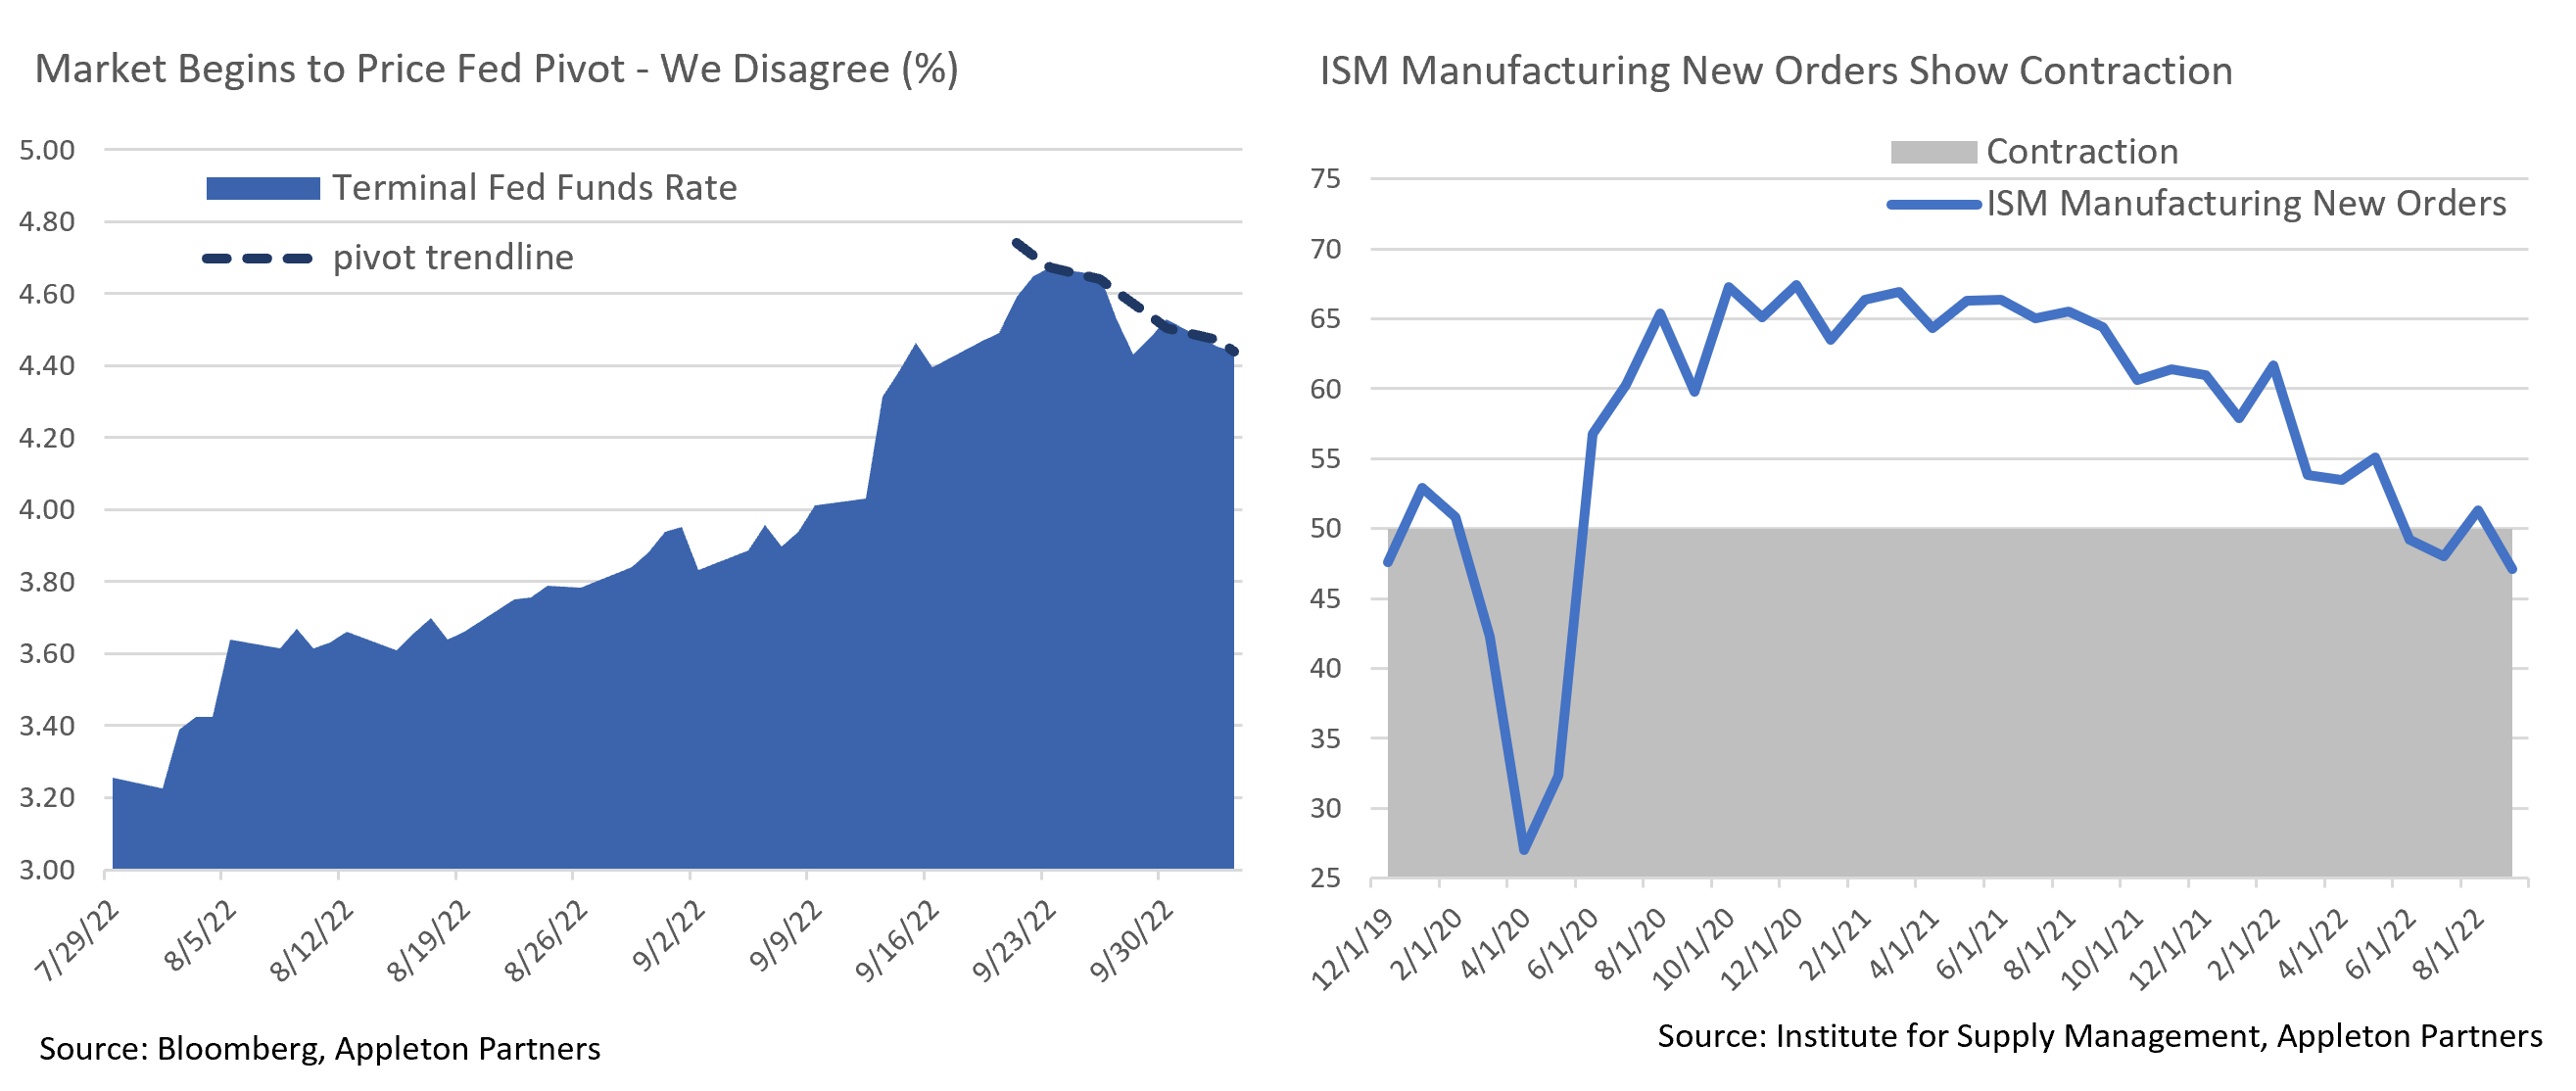
- The annual GDP re-benchmarking further complicates the Fed’s job. While 2022 headline growth was unchanged, revisions show an increase in consumer spending from 3Q ‘21 through 2Q ‘22, coupled with upwards inventory revisions to the most recent periods. Consumer spending now exceeds aggregate supply by an even greater margin, and it will likely require proportionately more action from the Fed to rebalance to supply. Inventories are sensitive to short-term funding rates, and companies will have incentive to right-size inventory. This would detract from GDP and make a recession harder to avoid. Evidence of this is already evident in the ISM Manufacturing Index, which fell to just above contraction territory in September.
- Labor conditions are still strong, and Friday’s employment report forecast calls for an additional 265k new jobs. Hiring is occurring amid economic weakness because employers were badly short-staffed going into the slowdown and even depressed conditions have not changed that situation. The JOLTS survey showed the ratio of openings to unemployed fell sharply from 1.97 to 1.67 in August, although these are elevated levels. We expect hiring to remain resilient for several more months, but when it does slow it is likely to be abrupt.
- Despite a bleak macro environment, in the relative calm following the BOE intervention markets have begun to price a future Fed pivot and a moderation of terminal Fed Funds rates, with equities rebounding strongly as October trading began. We believe these monetary policy expectations are misguided; the Fed has been clear they will hike until inflation has fallen materially from current levels.
Equity News and Notes
A Look at the Markets
- We noted last month that September is historically the weakest stock market month, and this year proved no different. The S&P 500 dropped -9.3%, its worst month since March 2020, a decline that left the Index into the red for the quarter (-5.3%) and created the first 3-quarter losing streak since 2008. All eleven sectors finished lower, led down by Technology as the Nasdaq fell -10.5%, while Large Growth underperformed Large Value by 0.83%.
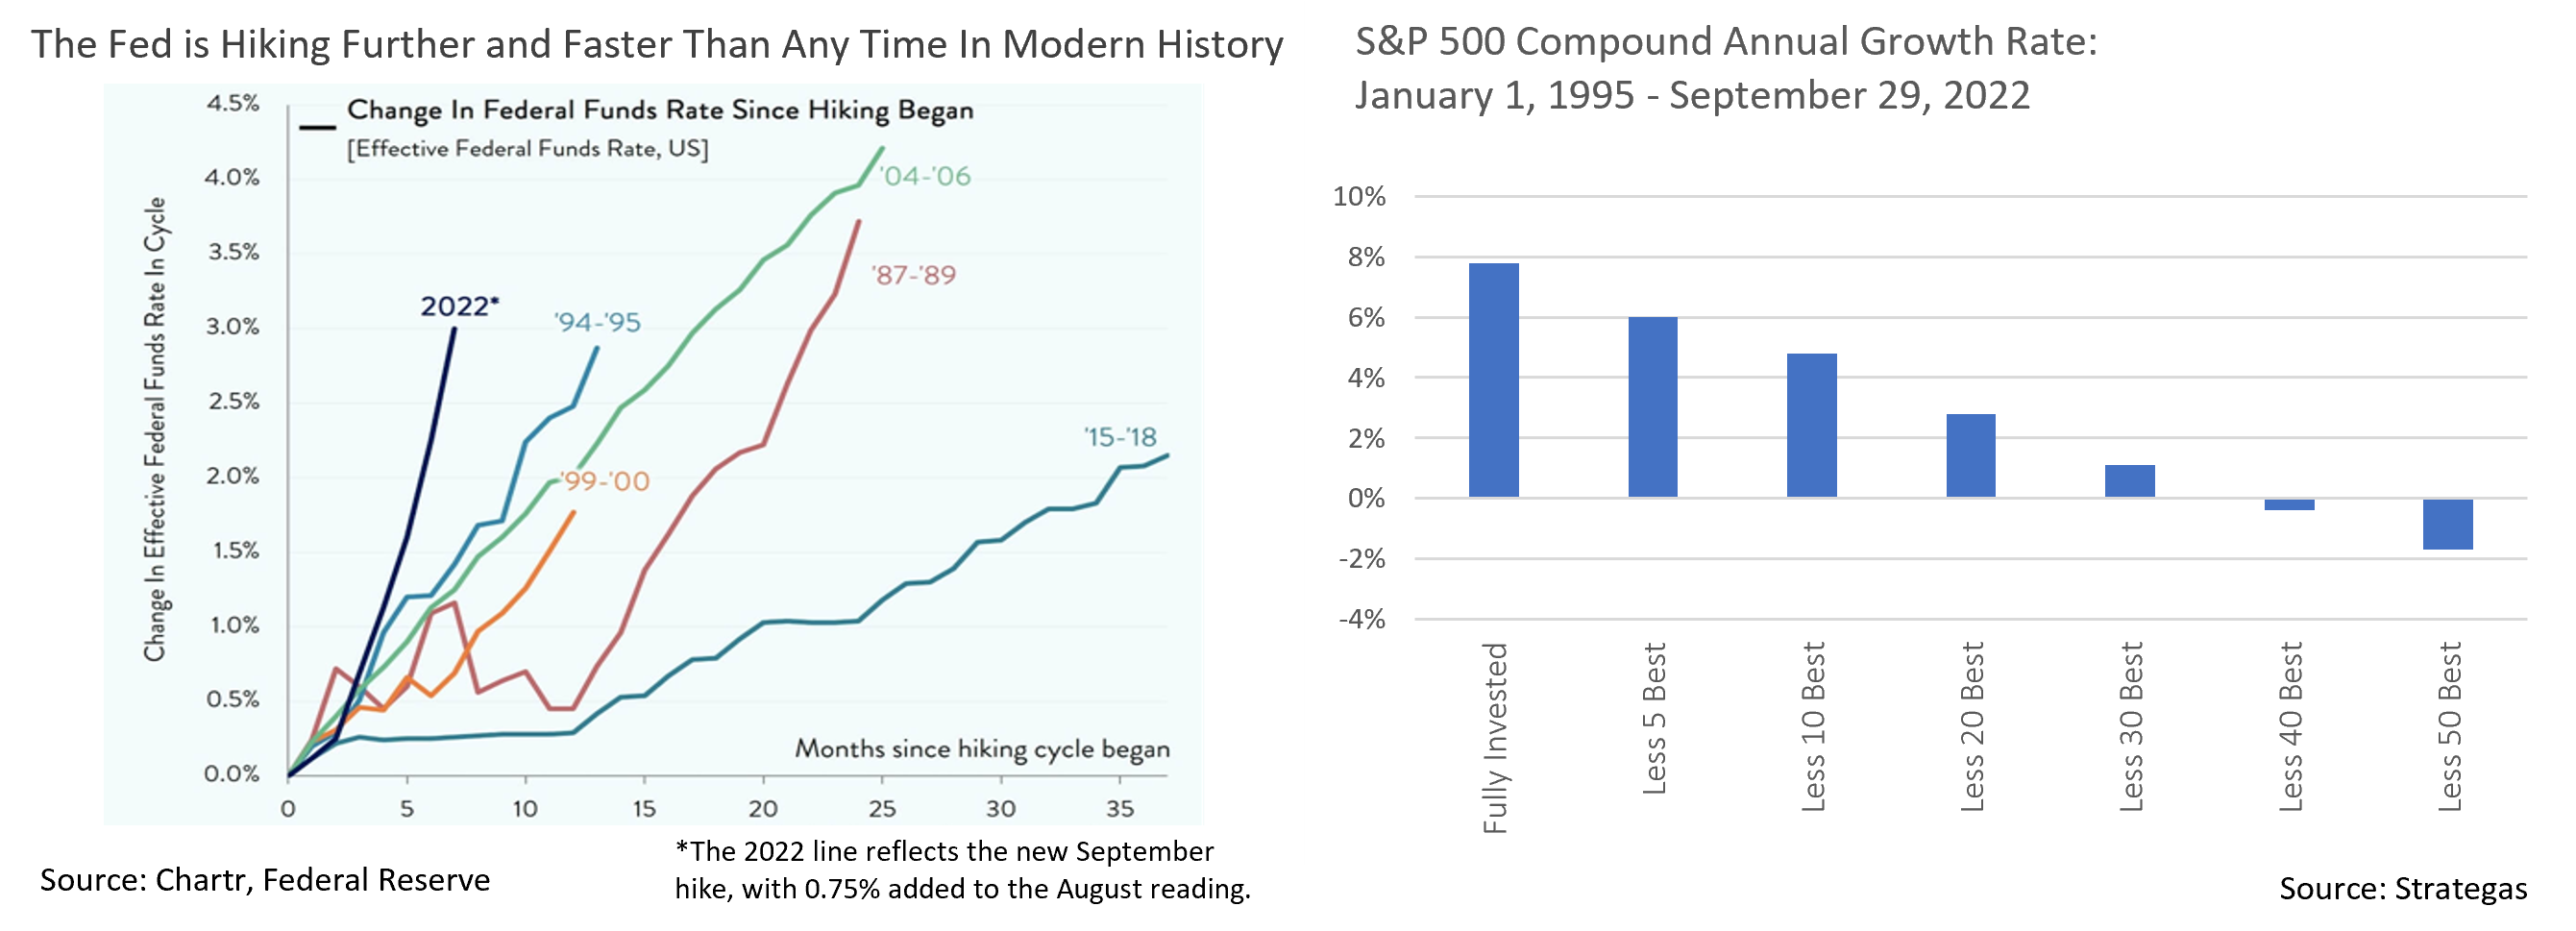
- Market weakness was primarily driven by a relentless rise in global interest rates as central bankers sought to tighten monetary policy and slow demand. The Fed hiked rates by 0.75% for a third straight meeting, an unprecedented move, and has now gone faster and further than any other hiking cycle in recent history. Higher interest rates present three primary problems for stocks. First, upward rate pressure reduces liquidity and makes money more expensive, thus tightening financial conditions and applying brakes to the economy. Slower economic growth typically suppresses corporate earnings. Second, higher interest rates hurt valuations as they lower the present value of future cash flows and typically dampen investors’ willingness to pay for future earnings. Third, elevated interest rates now offer investors an appealing alternative to stocks. We have talked in recent years about the TINA trade (“There is no alternative”) as being supportive of stocks in an environment when real yields (inflation adjusted) were close to zero, if not negative. Given recent rate moves, the 10Yr real yield recently hit 1.67% (a 14-year high) as nominal 10Yr USTs touched 4% for the first time since 2008. With higher nominal and real rates, investors may now be looking at TARA (“There are reasonable alternatives”).
- September’s trading was dominated by macroeconomic factors as investors eschewed company fundamentals and seemingly viewed the market as an “all-in/all-out” proposition. One-third of September’s trading days saw at least 400 of the S&P 500 stocks either advance or decline, the most since March 2020. For the year, we are on pace for 42 such “+/- 400” trading days. We typically see such conditions during times of stress, and it is not a good environment to be making long term asset allocation changes.
- We frequently emphasize to clients that patient investors are usually rewarded. Provided an appropriate time horizon and risk tolerance is established, staying invested through downturns is much more effective than trying to time the market. The market’s best and worst days over any given period tend to be clustered, and half of the S&P 500’s best days over the past 2 decades have occurred during bear markets. An additional 34% have occurred during the first 2 months of a bull market, a period before market bottoms become apparent. As you can see below, missing the best days of any market cycle severely diminishes a portfolio’s long-term growth potential.
- The S&P 500 hit its YTD low on the last trading day of the month, falling roughly -2% below the prior low set in June. We expected a short-term bounce given how many indicators were flashing “oversold”, and trading over the first couple days of October responded accordingly. However, uncertainties such as the trajectory of interest rates remain, which will likely be a source of indigestion for risk assets until there is sustained evidence that inflation is being contained. We will monitor rates and the US dollar for signs of an inflection lower knowing that stocks are likely to remain under pressure until that time.
- Bulls have not had much to hang onto of late, but at least the calendar might become a bit friendlier. Strategas reports that the S&P 500 has posted a positive Q4 return in 19 of the past 23 midterm election years, or 82.6% of the time. Furthermore, the S&P 500 has had positive Q4 returns 9 of the 11 midterm years in which the Index was negative over the first nine months.
From the Trading Desk
Municipal Markets
- Municipal bond price declines accelerated in September with the Bloomberg Barclays Managed Money Short/Intermediate Index falling by 3.05%. Tax-exempt yields ended Q3 at highs not seen in many years with 2-year AAAs at 3.09%, the highest rate since December of 2007, while 10-year AAA bonds yielded 3.30%, the highest level since early 2009. Income streams have increased dramatically with 2 and 10-year AAA yields equating to 5.47% and 5.78% respectively on a tax-equivalent basis.1
- The municipal curve remains steep relative to USTs but is relatively flat by historical standards. The 10-year Muni/UST ratio at quarter-end was 86.2%, slightly above long-term norms. During rate hike periods over the past few decades, ratios generally declined leaving tax-exempt valuations somewhat rich versus similar duration high quality taxable bonds, a dynamic we have not seen this cycle.
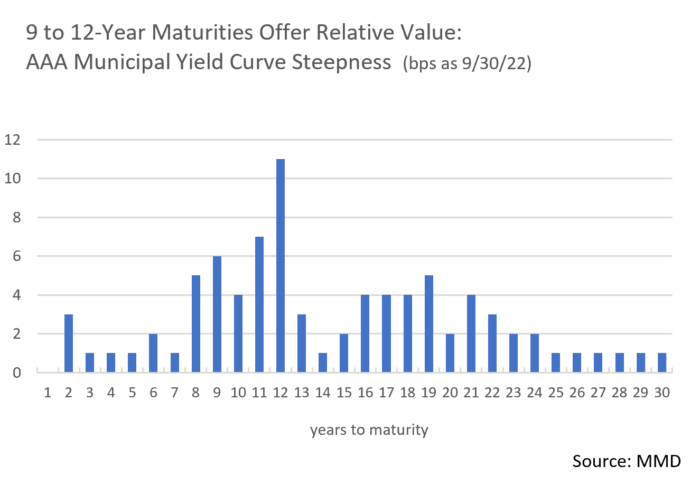
- Our typical intermediate maturity target range has been pushed out a bit as we are finding the greatest relative value among 9 to 12–year maturities. Although short maturity yields jumped by 80 bps in September, UST yields rose even more sharply, and we now see greater opportunity farther out on the curve.
- A highly volatile market characterized by rising yields coupled with strong balance sheets has suppressed municipal issuance. New issuance in September fell 43% YoY and 26% QTD. This has reduced primary market bond availability and pushed more of our buying into the secondary market.
- The positive effect of sluggish issuance on technical factors has been more than offset by mutual funds incurring $91.5B of YTD net outflows, reversing 2021’s strong inflows. We expect flows to return as markets settle, particularly given current yield levels.
Corporate Bond Markets
- Investment Grade primary market issuance missed September expectations by nearly 50% as trading volatility and higher rates drove funding costs to levels not seen since 2009. September is typically packed with deals – new issuance averages ~$150 billion – although last month’s $78.6 billion came up far short. Concessions needed to get deals done have remained well above average, adding to the cost of new debt and discouraging issuance. On a more positive note, most deals have done well as they break out into the secondary market, suggesting there is still appetite for credit. Looking ahead, market syndicates have cautiously projected another $75 billion of new debt in October and a below average Q4.
- Investment Grade credit spreads touched YTD highs in a risk-off final week of September, but quickly retraced to end 6 bps below a YTD peak of 164 bps on the Bloomberg Barclays US IG Corporate Index. Supply limitations have helped keep spreads range bound, although lack of market conviction across the rating spectrum is producing periodic volatility swings.
- Lagging retail fund flows reflect recent market jitters. Investors redeemed $10.3 billion (3rd largest redemption on record) from IG funds over the last week of September. YTD net outflows now stand at $100.3 billion, an indication of weak market sentiment. We feel outflows are likely to continue with high levels of market volatility and economic uncertainty expected over the near-term.
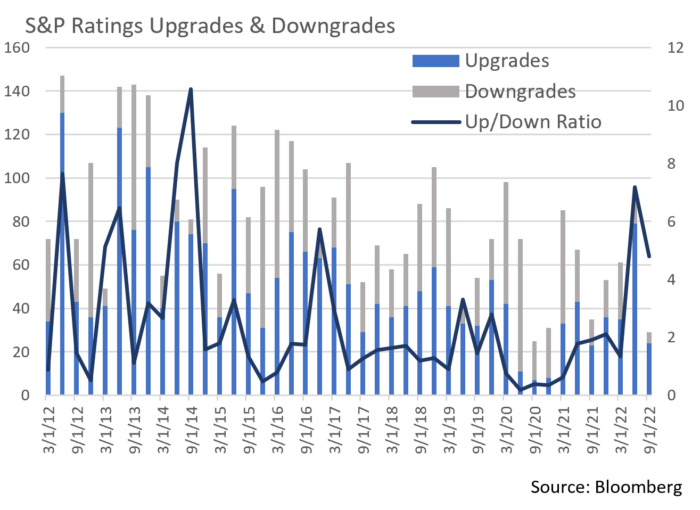
- Corporate credit fundamentals generally remain healthy, and this offers support for credit spreads in the face of a challenging interest rate and technical environment.There have been 138 upgrades and only 42 downgrades YTD, raising the upgrade/downgrade ratio to a vibrant 3.29x, the highest level since 2014. High Yield presents quite a contrast, with 262 upgrades and 265 downgrades, an almost 1:1 ratio.
- Upcoming quarters will prove to be interesting as recession fears, inflation, and growth concerns remain top of mind and may pressure the Investment Grade market. In our view, high quality issuer fundamentals should remain solid and downgrade pressures will most likely come among credits tipping over the IG/HY threshold.
Financial Planning Perspectives
The Federal Reserve, the Dual Mandate, and the Fight Against Inflation
 As the battle against inflation rages on, we offer context concerning the Federal Reserve’s role in steering US monetary policy. The Federal Reserve Bank and its twelve regional Federal Banks serve as the US central banking system as established by the Federal Reserve Act of 1913. The purpose of this legislation was to “provide the nation with a safer, more flexible and more stable monetary and financial system”.1 The Federal Reserve’s responsibilities fall into four broad categories:
- Conducting US monetary policy;
- Containing system risk and maintaining a stable financial system;
- Providing supervision and regulation of banks and thrifts as well as state-chartered banks that are part of the Federal Reserve System; and
- Operation of a national payment system to depository institutions.
The Federal Reserve has come under the microscope this year given a need to reign in persistent inflation it once suggested was “transitory” in nature. The Federal Open Market Committee (FOMC) is the Fed’s primary monetary policy body with responsibility for:
- Maximization of US employment;
- Price stabilization; and
- Tempering longer term US interest rates
The first two categories are often referred to as the Fed’s “dual mandate”, the latter of which is influenced by setting the Fed Funds interest rate, or the rate at which banks lend and borrow excess reserves to one another overnight.
Inflation remains a challenge that has roiled the global economy and capital markets. August numbers remained elevated with Consumer Price Index (CPI) coming in at an annualized rate of +8.3%. Core inflation, which excludes food and energy, rose at an annualized month-over-month pace of +6.3%. That is why we have seen such significant increases in short term interest rates as the Fed seeks to dampen excess demand.
The FOMC finds itself in a bit of a predicament as lowering inflation risks imposing significant economic costs and will likely come at the expense of a still hot labor market, albeit hopefully only short-term. By repeatedly hiking interest rates and making credit more expensive (credit cards, mortgages, other consumer loans, etc.), the Fed has indicated that they are willing to tolerate economic pain to get inflation back under control.
It is widely expected that the FOMC will raise interest rates by another 50 or 75 bps at the November meeting, a move that would increase Fed Funds to roughly 3.75 – 4.00%. We are experiencing the sharpest and most rapid series of rate hikes in Federal Reserve history, and how this ultimately plays out remains to be seen, as rate hikes tend to be a lagging economic indicator. Nonetheless, the cost of debt is rising, and we recommend taking this into account in personal financial planning. A long era of encouraging consumer borrowing and penalizing savings has clearly reversed, although on a brighter note, yields on cash and other short-term instruments have dramatically increased.
- https://www.federalreserve.gov/faqs/about_12594.htm#:~:text=It%20was%20created%20by%20the,Federal%20Reserve%20Act%20into%20law.
At Appleton, we take great pride in the wealth management and financial planning services provided to our clients.
Is there someone you care about who might benefit from working with us, but you’re unsure how to make the introduction?
If so, please let us know. We’re happy to help.
Please contact your Portfolio Manager or reach out to:
Jim O’Neil, Managing Director
617-338-0700 x775 | [email protected] | www.www.appletonpartners.com