


Insights & Observations
Economic, Public Policy, and Fed Developments
- The labor conditions picture shifted substantially in March, after the February jobs report brought a combined 167k in prior period downwards revisions. Coupled with unexpectedly hot CPI and PPI inflation reports, market fears turned to stagflation. We think some context is important, however. December and January had been concerningly hot as initially published (and were part of why the markets were primed to worry over inflation even before January’s inflation reporting surprised to the upside). Post revision, job growth remains strong, but not abnormally so. Rather than harbinger of weakness to come, we found the revised employment reports more consistent with the Fed’s projections of a “soft landing.”
- The inflation picture remains complicated. Critics of the Fed are right to point out that a lot of the progress fighting inflation to date, driven by supply chain normalization and falling energy prices, is not likely to lead to further improvement; the path from 4% to 2% is going to look a lot different than the path from 8% to 4%. However, we believe that as goods and energy cost improvements fade the Fed is likely to get an assist from shelter costs.
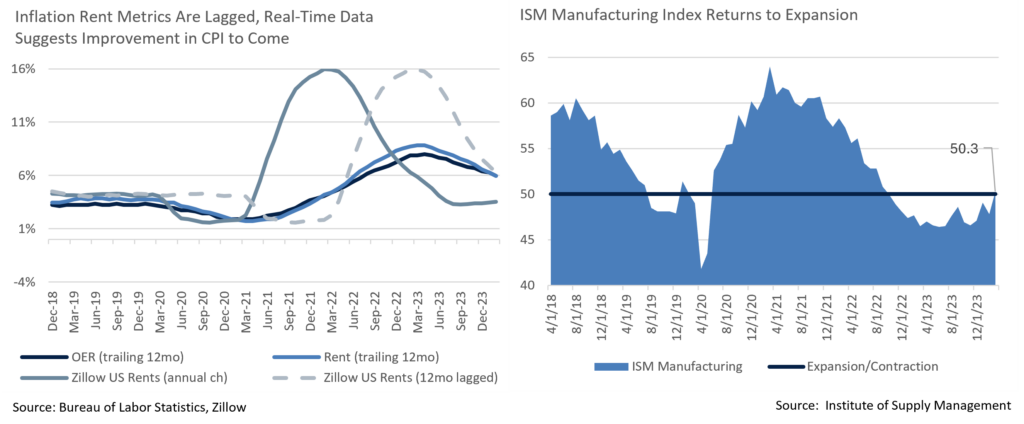
- One of the more technical reasons core inflation has proven sticky this cycle is that shelter costs, which are more than a third of headline and nearly half of core, are heavily lagged, with only about one twelfth of the sample updating monthly. Live rental data indices exist, however, and can provide insight on how CPI shelter components should look in the coming year. Zillow’s monthly index has fallen from around a 6% annual increase a year ago, close to CPI shelter inflation today, down to about 3.5%. While higher than the Fed’s 2% target, this is in the normal 3-4% historical range that’s been consistent with 2% headline inflation. As long as nothing new disrupts shelter costs, this component of CPI should decelerate enough to finish pulling inflation back to the Fed’s target.
- The growth outlook is increasingly robust, meanwhile. The final Q4 GDP revision bumped growth to the originally reported 3.4%, showing strong momentum coming into Q1. More importantly, it did so in part with further downward revisions to inventory levels (suggesting future strength as retailers restock) and even stronger consumer spending. While retail spending was a little weaker than (admittedly high) expectations for March, personal spending was nearly twice as strong as forecast; the latter tilts heavily towards services and suggests consumers continue to prioritize services spending.
- Survey data, weaker than hard data for much of the past year, was excellent, too. The University of Michigan consumer sentiment unexpectedly hit the highest levels since 2021, and ISM Manufacturing, after slowly improving all winter, finally came out of contraction for the first time since late 2022. The Atlanta GDPNow projection for Q1 stood at a robust 2.8%, above trendline and only modestly slower than Q4.
- The Fed meeting on March 20th contained few surprises, but one thing we would note and will be watching in future “dot plots” is a gradual upwards movement in the Fed’s long-term “neutral” Fed Funds rate. While the median only increasing from 2.5% to 2.6%, the full dot plot shows a growing upwards skew to the distribution, and only a few members’ votes moving upwards from here would lead to a sizable increase in the median long term Fed Funds rate.
From the Trading Desk
Municipal Markets
- March issuance was strong at $36.78 billion according to Bloomberg, 6.8% higher than the same month last year. On a YTD basis, issuance is roughly 30% above last year’s supply, a positive trendline given past supply constraints. If issuance is sustained at the same rate as last year, the annual total should be in line with Street expectations of about $400 billion. We are encouraged by recent issuance trends as it enables us to more readily source quality, liquid names that meet client portfolio needs.
- As part of the issuance story, Build America Bonds (BABs) are back in the headlines. BABs were initially introduced in 2009 to facilitate municipalities accessing the market during the Great Financial Crisis by offering a subsidy to the issuers. Many BABs were issued with an extraordinary redemption provision (ERP) which would be triggered if the subsidies are cut, an occurrence that happened as part of sequestration. BABs with ERP calls make up about 13% of the taxable municipal market. However, the current narrow spreads of taxable municipals have prompted issuers to consider the cost savings of calling their ERP BABs and reissuing in the market. We find this dynamic interesting to note, despite BABs with ERPs being a relatively small portion of the overall market and thus having limited implications.
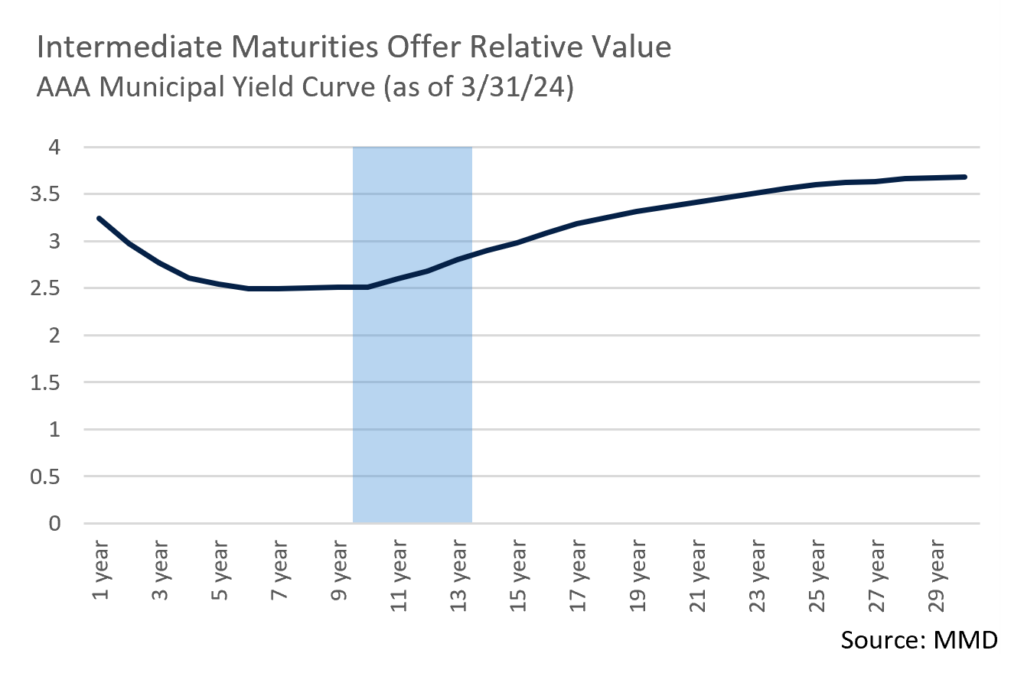
- The short end of the yield curve moved up over 20bps in March with the 2Yr AAA closing the quarter at 2.97%. Slightly longer maturities of 10-years saw yields move up much more modestly over the month. Given this yield curve dynamic, we are finding value in the short end of the curve and offsetting the duration effect with longer names of 10 to 12-years. Recent curve movement has bumped up Muni/UST ratios on the shorter end of the curve, with the 2-year now at 64.3%, while the 10-year ratio rests well below long-term averages at 59.8%.
Corporate Markets
- Investment Grade Corporate issuance once again beat consensus estimates in March with $142 billion of new debt hitting the market, as compared to an expectation of $130 billion. This marked the third straight month in which new issuance exceeded projections, leading to a record setting $529 billion of new supply in Q1. Covid concerns in March of 2020 prompted the prior record, whereas today’s primary market conditions are largely a reflection of issuers tapping into robust demand from domestic and foreign buyers, attractive borrowing costs, and lingering concerns about the potential for a mild recession that could pressure the debt markets. We anticipate slowing issuance and are maintaining relatively short maturity and a selective sector focus likely led by Financials.
- The song remains the same as credit appetite has kept Investment Grade spreads incredibly resilient. The OAS on the Bloomberg Corporate Bond Index began 2024 at 100bps and reached a high of 105bps a few days later. A subsequent tightening has not significantly reversed, as the quarter-end OAS of 89bps was only 2bps wider than the low reached on March 21st. A 7bps tightening of the Index’s OAS over the month of March produced 0.56% of excess return. At this stage in the cycle, we see the potential for further tightening, although in our view this will be dependent on sustained economic strength and looming Federal Reserve interest rate decisions.
Public Sector Watch
Census Bureau Population Update
- The Census Bureau’s 2023 US County Population Update released in March revealed several demographic insights, led by more counties experiencing population gains than losses last year. Southern counties drove the result as they are experiencing faster than average growth relative to the rest of the country.
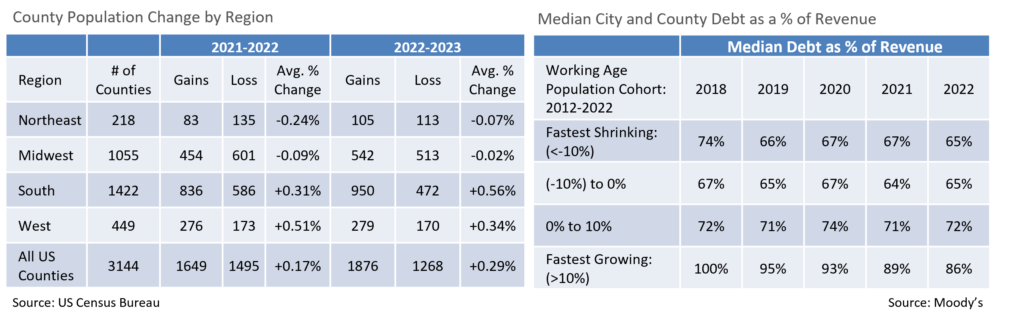
- Approximately 60% of US counties gained population from 2022 to 2023, an increase from 52% between 2021 and 2022. Among all counties, the average change was +0.29% in 2023 compared to +0.17% the prior year.
- This is the first year since 2020 that more counties in the Midwest saw population gains than losses (542 vs. 513), although population losses in the Northeast continued to outpace gains (113 vs. 105). Of positive note, the average annual change in the Northeast region slowed to -0.07%, from -0.24% in 2022.
- Counties in the South grew at an average annual pace of +0.56% vs. +0.31% the year prior, and in the West, the average annual change among the region’s 449 counties slowed from +0.51% to +0.34%.
- On a nationwide basis, large and moderate-sized counties grew on average, while small counties saw population declines. Among the 618 counties with populations above 100,000, the average change was +0.76%, while the smallest counties (populations below 10,000) experienced an average annual decrease of -0.27%.
- A forward-looking outlook on population trends indicates that a decline in the working age population should accelerate in most parts of the country over the next decade. Falling birthrates and rising mortality rates associated with aging populations are drivers of this demographic trend.
- A declining working age population typically has considerable economic effects, including lower consumption, negatively impacting regional industries and disincentivizing new ones from entering. This impacts revenue growth for US cities and counties, making financial flexibility increasingly important.
- Moody’s estimates that 77% of the nation’s roughly 3,100 counties are forecasted to lose working age residents over the next decade. The expected median change from 2022-2032 is -5.5%, an increase from -4.6% over the prior decade. These adverse trends are widespread, although rural areas and areas that once had high industrial presence throughout the Midwest and Northeast face some of the sharpest declines. Even regions that have enjoyed vibrant economies and are expected to sustain growth will likely experience slowing conditions, a dynamic that will demand fiscal adaptability.
- Proactive, conservative financial management will become increasingly important to credit standing as localities manage potentially sluggish revenue. Nonetheless, according to Moody’s, data from nearly 1,400 cities and counties that have had declining populations over the last decade, suggests that most have been able to successfully manage through these fiscal challenges, and localities that fail do to so will likely have pre-existing credit challenges that are exacerbated by population declines.
- Notably, the revenue impact of a shrinking working age population is a slow, gradual trend which gives management ample time to adjust budgets and control expenses. Shrinking localities also often require less capital investment and therefore less debt. This allows management to address their budgetary needs on a pay-as-you-go basis, or by issuing debt without having a material impact on their credit profile.
- Appleton’s investment approach is disciplined by nature, and we place significant research attention on financial trends and management’s ability to adapt to economically challenging times. Given the wide breadth of local governments impacted by declining working age populations, we cannot avoid these credits altogether, although we seek bond issuers with management teams that are attuned to such fiscal strains and have demonstrated an ability to successfully adapt.
Strategy Overview
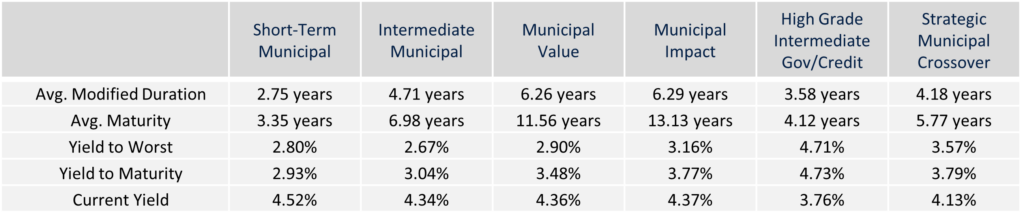
Composite Portfolio Positioning (As of 3/31/24)
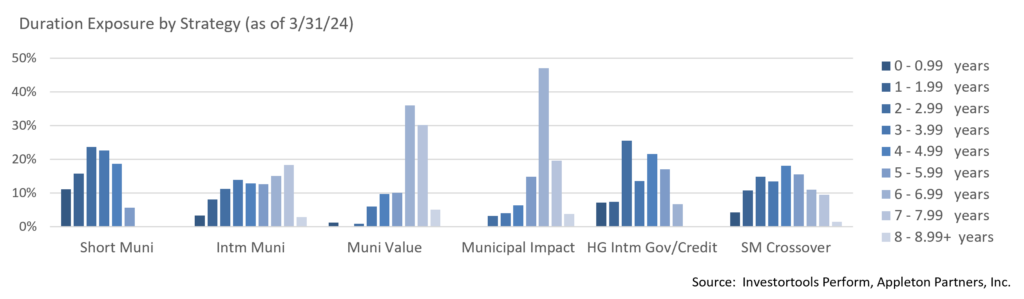
Duration Exposure (as of 3/31/24)
The composites used to calculate strategy characteristics (“Characteristic Composites”) are subsets of the account groups used to calculate strategy performance (“Performance Composites”). Characteristic Composites excludes any account in the Performance Composite where cash exceeds 10% of the portfolio. Therefore, Characteristic Composites can be a smaller subset of accounts than Performance Composites. Inclusion of the additional accounts in the Characteristic Composites would likely alter the characteristics displayed above by the excess cash. Please contact us if you would like to see characteristics of Appleton’s Performance Composites.
Yield is a moment-in-time statistical metric for fixed income securities that helps investors determine the value of a security, portfolio or composite. YTW and YTM assume that the investor holds the bond to its call date or maturity. YTW and YTM are two of many factors that ultimately determine the rate of return of a bond or portfolio. Other factors include re-investment rate, whether the bond is held to maturity and whether the entity actually makes the coupon payments. Current Yield strictly measures a bond or portfolio’s cash flows and has no bearing on performance.
Our Philosophy and Process
- Our objective is to preserve and grow your clients’ capital in a tax efficient manner.
- Dynamic active management and an emphasis on liquidity affords us the flexibility to react to changes in the credit, interest rate and yield curve environments.
- Dissecting the yield curve to target maturity exposure can help us capture value and capitalize on market inefficiencies as rate cycles change.
- Customized separate accounts are structured to meet your clients’ evolving tax, liquidity, risk tolerance and other unique needs.
- Intense credit research is applied within the liquid, high investment grade universe.
- Extensive fundamental, technical and economic analysis is utilized in making investment decisions.
This commentary reflects the opinions of Appleton Partners based on information that we believe to be reliable. It is intended for informational purposes only, and not to suggest any specific performance or results, nor should it be considered investment, financial, tax or other professional advice. It is not an offer or solicitation. Views regarding the economy, securities markets or other specialized areas, like all predictors of future events, cannot be guaranteed to be accurate and may result in economic loss to the investor. While the Adviser believes the outside data sources cited to be credible, it has not independently verified the correctness of any of their inputs or calculations and, therefore, does not warranty the accuracy of any third-party sources or information. Specific securities identified and described may or may not be held in portfolios managed by the Adviser and do not represent all of the securities purchased, sold, or recommended for advisory clients. The reader should not assume that investments in the securities identified and discussed are, were or will be profitable. Any securities identified were selected for illustrative purposes only, as a vehicle for demonstrating investment analysis and decision making. Investment process, strategies, philosophies, allocations, performance composition, target characteristics and other parameters are current as of the date indicated and are subject to change without prior notice. Registration with the SEC should not be construed as an endorsement or an indicator of investment skill acumen or experience. Investments in securities are not insured, protected or guaranteed and may result in loss of income and/or principal.