


Insights & Observations
Economic, Public Policy, and Fed Developments
- While the war in Iran clouds the economic outlook, data released in March continues to support our view that the market has been worried about the wrong side of the Fed’s dual mandate.
- February’s employment report, released after our last Review and Outlook, may have been abysmal, with an initial estimate of -92k jobs lost. But, with BLS disclosing a large strike and data suggesting a substantial weather effect, we anticipated a sizeable March rebound. Fed Chair Powell’s reference to a “combined strike and weather effect of about 80k” in his FOMC Q&A should have garnered more attention than it did. Even so, we were surprised by the magnitude of the beat, with new jobs gains of +178k in March nearly tripling the consensus estimate.
- We think this report should be interpreted with caution, though. About half of that gain reflected an unwinding of strike and weather effects in February if Powell’s estimation was correct. The average hourly earnings miss in March was probably due to weather effects and lower income workers returning to work, but the annual growth rate is now down to +3.5%; still elevated, but the slowest wage growth since the pandemic. Finally, after leading the Establishment survey throughout the second half of last year, the Household survey is now lagging the Establishment survey’s growth. We think the YTD hiring average of 68k a month is probably a better indicator of labor demand than the most recent report.
- All the same, the economic event most likely to take the Federal Reserve off hold would have been a bad March labor report. With March as strong as it was, this raises the bar to interest rate cuts, and we feel the market is finally right in expecting the Fed to remain on hold for some time.
- The inflation picture appears to have not been improving even before war broke out. While CPI and PCE inflation reports were both in line with expectations, February’s PPI producer inflation was hot, +0.7% headline and +0.5% at the two “core” readings. Trade services was no longer the culprit, suggesting producers are no longer hiking prices to rebuild margins, but services input prices rose broadly and risk aggravating consumer inflation.
- Additionally, the March ISM Manufacturing showed the “prices paid” sub-component registering the largest two-month increase since 2016, first on tariffs, and then war. The ISM Services Prices Paid index rose as well, from 63.0 to 70.7, pushing prices up to the highest level since 2022. Chair Powell indicated the Fed would likely look through an oil shock so long as core inflation remained in check. This is good, because it appears inflation is about to accelerate sharply; the Bloomberg consensus for March headline CPI is now +1.0%, which if realized would be higher than all but two months of Covid-impacted 2022.
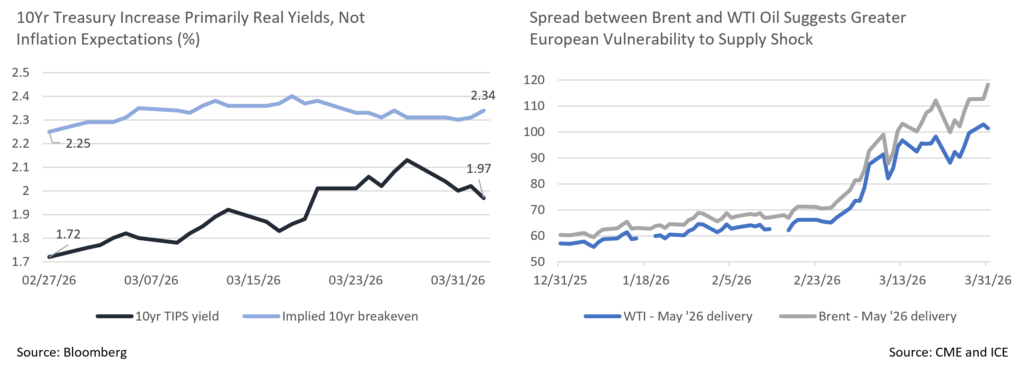
- The war will have profound impacts on the economy. It does appear that the US is trying to wind down operations with or without control of the Strait of Hormuz, though it is too soon to know if President Trump’s latest “two to three week” timeline will hold. The US is better insulated from the economic impact of restricted oil supply than Europe, as we purchase less oil that flows through Hormuz; this explains the growing spread between Brent and WTI oil futures. Oil producer and refinery income will help cushion some of the economic harm, as well, as we are sizable producers. Long term inflation expectations remain stable; while the front of the curve saw a combination of increased inflation expectations and rising real rates, the increase in the 10Yr UST in March was almost entirely in real rates following changes in Fed Funds expectations.
- A Fed on hold for the foreseeable future is a reasonable base case, though there are now risks to both sides; hikes if energy prices start to pressure service prices and inflation accelerates, and cuts if higher energy prices causes consumer pain and recession risk. We will watch carefully for evidence of either.
Sources: Bloomberg, Bureau of Labor Statistics, Institute of Supply Management, the Federal Reserve
From the Trading Desk
Municipal Markets
- Municipal performance experienced a sharp downturn in March as the market contended with the onset of war in Iran and elsewhere in the Middle East, and its implications on the economy and interest rates.
- Municipal yields moved higher in line with or selectively exceeding US Treasuries. All spots on the curve rose, with the strongest impact being felt from 5 to 12-years. The overall sell-off was bell-shaped with tapered moves at the front and long ends, and the largest increase in the belly of the curve.
- Relative to absolute yield moves, 3-year and shorter maturities saw yields push higher by from 37 to 45bps. The 5 to 12-year maturities moved up in a parallel fashion by 55 to 60bps, while the 15-year spot rose by 48bps. Meanwhile, the long end of the curve (25 to 30-years) finished the month higher in yield by 30bps.
- Spreads between 2s and 30s flattened by 3bps but effectively saw a twist with a 21bps steepening inside of 10 years (i.e.2s-10s) and 10 to 15-year yields falling by 12bps.
- Municipal ratio moves were equally dramatic with all spots out to and including the 10-year maturity experiencing ratio widening as the municipal selloff exceeded the UST move. Ratios in the 2- to 3-year part of the curve widened by 3 – 5% while 5 to 10-year maturities saw levels move cheaper by 7-8% relative to USTs. The month closed with 3-year ratios at 65.2%, 5-years at 67.8%, and 10-years at 72.2%. As we move into April, municipals look quite attractive with 10-year AAA yields above 3% and ratios exceeding 70%.
- According to JP Morgan, March tax-exempt issuance totaled $49B, while total gross issuance reached $52B. Long-term tax-exempt supply set a new March highwater mark, besting the prior record of $45B set in 2007, and closing the month 25% ahead of March 2025’s $39B.
- Municipal funds continued to gather net new subscriptions throughout the month reaching a total of $3.85B (weekly reporting funds only), with over 88% of the flows accounted for by ETFs and the balance open-end funds.
- Weaker seasonal reinvestment anticipated in April should pressure tax-exempt bond market technicals. JPM estimates that net supply should be about $18B during the upcoming month.
Corporate Markets
- The month of March began with the war on Iran tipping the scales towards a risk-off tone causing Investment Grade credit spreads to tighten. That trend was fueled by signs that the conflict would last longer than initially expected and spreads climbed to a YTD high of 93bps OAS on the Bloomberg US Investment Grade Index by mid-month. While the Index ended the month down slightly to 89bps, wider spreads along with a move in rates created a monthly performance loss. The recent move in credit spreads has not been nearly as pronounced as the “Liberation Day” sell off in credit last April, and a little spread widening can be healthy for the market. Despite modest credit pressure in certain sectors, we feel credit spreads will likely remain within near-term averages for the foreseeable future.
- Amid significant volatility and uncertainty, Investment Grade issuers successfully navigated windows of opportunity to issue new debt in March. The $231B that came during the month was the second highest March issuance behind the $259B seen in March of 2020. We also saw one of the largest weeks on record despite higher funding costs and yields on some deals tipping over the 5% mark. Future uncertainty and earnings season should slow down issuance in April, although the YTD total of $636B is on track to reach the $1.85 trillion of new debt expected to hit the market in 2026. We expect new supply to continue to be met with strong buying support.
- UST rate action was the story of the month as yields across the curve moved up in a parallel manner. This erased a long-standing dip at the 2Yr and 3Yr portions of the curve where yields had been sitting well below the 1Yr. The 5Yr benchmark rose 44bps to 3.94%, 10Yr yields reached 4.32%, and the long bond inched closer to 5%. The war in Iran and its accompanying impact on energy production across the region has reignited inflation concerns and prompted speculation that the Federal Reserve could be forced at some point to raise rates instead of cutting them. In our view, rate hikes are unlikely as the Fed remains focused on longer term data, although prospect for near-term cuts has been greatly diminished.

Sources: Bloomberg, Bond Buyer, Barclays, JP Morgan, and Lipper Inc.
Public Sector Watch
Credit Notes
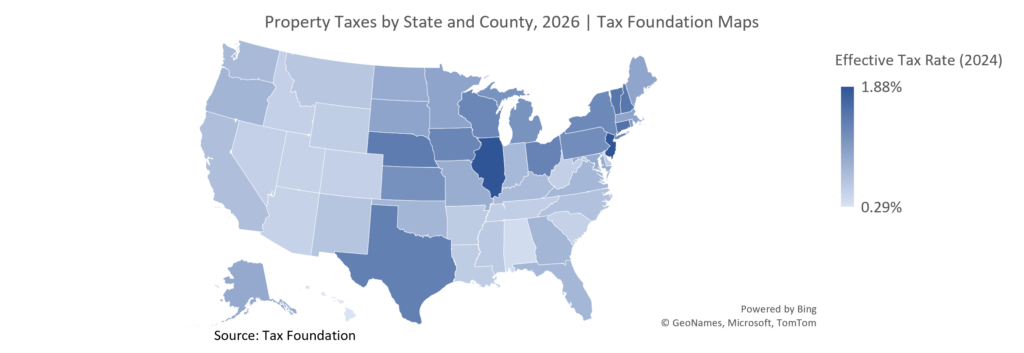
Over the last year, tax policy divergence among U.S. States has continued to grow. Some, such as Florida and Georgia, are exploring ways to reduce their overall tax burden, while others, most notably Washington and Virginia, are evaluating a potential millionaire’s tax. Florida is an interesting case study, as there is no state income tax, and the prospect of a property tax cut aimed at easing the burden on homeowners is growing.
What Has Happened?
- The Florida House approved HJR 203 across party lines in February after several options to reduce property taxes were put forth.
- HJR 203 calls for the elimination of non-school taxes for homestead properties, a repeal that would commence in 2027.
- A repeal would result in an ~$18.5 billion loss of annual tax revenue. To fill the gap, the state sales tax would have to double from 6% to 12%. This proposed fiscal shift intends to transfer the tax burden to non-residents and renters via increased consumption taxes, a policy stance that considered to be a more regressive in nature.
- HJR 203 also requires maintaining current levels of police and firefighter spending, which is a questionable proposition if a major funding source (property taxes) is lost without adequately replacing it.
- A study from the Florida League of Cities found that 116 Florida municipalities would not be able to generate sufficient revenue to cover 2024 public safety expenses. This analysis included cities such as Tampa, St. Petersburg, Fort Lauderdale, and Hollywood.
What is the Current Status?
- The most recent legislative session ended on March 13th, and the Florida Senate did not act on HJR 203 or pass any of their own proposals concerning property taxes.
- This same issue may be brought up again in a special session later in the spring (mid-April), or this coming summer.
- Reducing property taxes has been a priority for Governor DeSantis over the past year. He has been surprisingly quiet to date in 2026, and some Democratic officials believe he intends to wait until the last minute to push his version of an ideal bill through. DeSantis has called the House’s actions confusing and insufficient.
- Even if the proposal passes the Senate, 60% of voters would need to approve the measure in the November 2026 election. Recent polling indicates that about 56% of voters are in favor of eliminating property taxes.
Credit Implications:
- There is still a long way to go in Florida as it relates to the possibility of reducing property taxes, as many hurdles remain.
- We would view an elimination of property taxes as a credit negative for local Florida municipalities and prefer to invest in bond issuers with diverse revenue sources. Elimination of property taxes would put much greater pressure on the sales tax, which is already volatile given a reliance on tourism.
Sources: https://floridapolitics.com/archives/785341-house-property-tax-proposals-fizzle-without-senate-interest/, https://floridapolitics.com/archives/787100-gov-desantis-trying-to-figure-out-timing-of-property-tax-phaseout/, https://taxfoundation.org/data/all/state/property-taxes-by-state-county/, https://www.floridapolicy.org/posts/roughly-18-5-billion-at-stake-for-florida-counties-school-districts-and-municipalities-if-property-taxes-on-homesteads-are-eliminated-think-tank-finds
This commentary reflects the opinions of Appleton Partners based on information that we believe to be reliable. It is intended for informational purposes only, and not to suggest any specific performance or results, nor should it be considered investment, financial, tax or other professional advice. It is not an offer or solicitation. Views regarding the economy, securities markets or other specialized areas, like all predictors of future events, cannot be guaranteed to be accurate and may result in economic loss to the investor. While the Adviser believes the outside data sources cited to be credible, it has not independently verified the correctness of any of their inputs or calculations and, therefore, does not warranty the accuracy of any third-party sources or information. Any securities identified were selected for illustrative purposes only, as a vehicle for demonstrating investment analysis and decision making. Investment process, strategies, philosophies, allocations, performance composition, target characteristics and other parameters are current as of the date indicated and are subject to change without prior notice. Not all products listed are available on every platform and certain strategies may not be available to all investors. Financial professionals should contact their home offices. Registration with the SEC should not be construed as an endorsement or an indicator of investment skill, acumen, or experience. Investments and insurance products are not FDIC or any other government agency insured, are not bank guaranteed, and may lose value.