


Insights & Observations
Economic, Public Policy, and Fed Developments
- July ended with a bang, with the final week so packed with macroeconomic data that the Federal Reserve meeting on 7/30 was almost an afterthought. The bad news is that very little of the week’s data was pretty. The good news is that data is at least telling a consistent story after a long period of uncertainty.
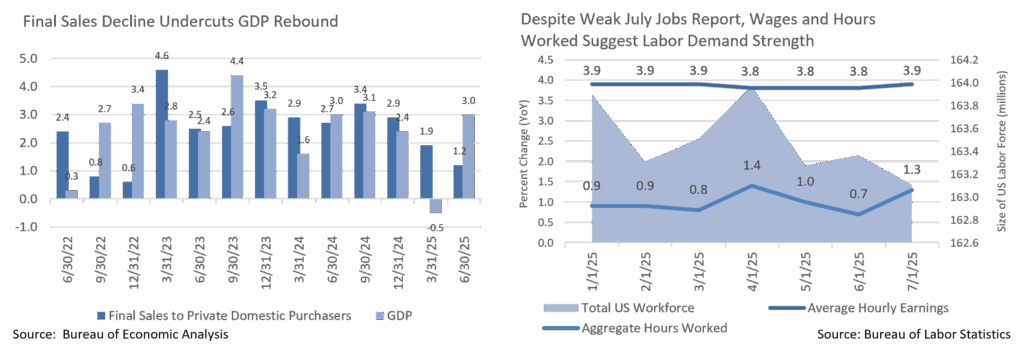
- The first estimation of Q2 GDP came in slightly better than expected at +3.0%. There are several major caveats, however. Markets were expecting a strong rebound after Q1’s -0.5%, with the wave of imports that pulled down Q1 reversing in Q2. They did, although the rebound still left net imports falling -3.9% over the first half of the year, a worrying sign for domestic demand. However, Final Sales to Private Domestic Purchasers weakened substantially in Q2, falling from +1.9% to +1.2%. This is a good “core” read on consumer demand, excluding fluctuations related to trade, inventory levels, and government spending, and it suggests consumers are pulling back. First half GDP is now running at about +1.2%, well below trendline +2-2.5%.
- Second, both CPI and PCE inflation reports are starting to show price increases and suggest – as we expected – tariffs are beginning to flow through after a several month lag. So far, the effect is not substantial, but certain categories such as home furnishings and sporting goods are now undeniably accelerating. PPI inflation suggests that service spending may be in contraction; the PCE report’s personal spending data was essentially flat for the month, so it’s too soon to say that with confidence. But a strong retail sales report earlier in July now looks like an outlier.
- The week’s biggest market event was an abysmal employment report. Not only did growth of 73k jobs come in well below (weak) expectations of 105k, but substantial downward revisions for the prior two months of -258k meant July was the strongest report of the last three, with May and June now a mere 19k and 14k. A contribution of 73k jobs from the anti-cyclical healthcare sector meant that, ex-healthcare, hiring was at a standstill. After having largely been priced out of the futures market, odds of a September rate cut jumped after the report.
- Interestingly, the details of the report suggest labor tightness. The workforce fell over the month and there was no job creation to speak of, yet average hourly earnings rose. Meanwhile, aggregate hours worked increased on an unchanged workweek, suggesting productivity gains, normally a product of labor shortages. All of this is unusual given the extremely weak headline.
- However, a fairly coherent economic picture is coming into focus. Tariffs are starting to show up in prices, a process that should accelerate as another wave of increases comes this week. Consumers are responding to price increases by cutting back on spending. Companies expect demand to continue to fall and are understaffing now rather than hiring and then risking layoffs.
- This creates a “Schrödinger’s Inflation” dilemma for the Fed; if they don’t cut rates for fear of inflation, demand and growth will continue to slow, making inflation unlikely. If they do cut, growth will still slow but fall short of recession, at the cost of swinging the impact of tariffs from demand destruction towards higher prices and inflation.
- We do not take a September rate cut for granted. The inflation trend is upwards, and one hot inflation print could quickly temper market expectations for cuts. But, if the Fed were to cut in September, Powell would likely telegraph this in his late August Jackson Hole speech by shifting the Fed’s focus squarely back to labor weakness, rather than describing labor as merely “not a risk to inflation.” How he chooses to describe labor conditions will be an important indicator for Fed policy through year-end.
Sources: Bureau of Economic Analysis, Bureau of Labor Statistics, US Census Bureau
From the Trading Desk
Municipal Markets
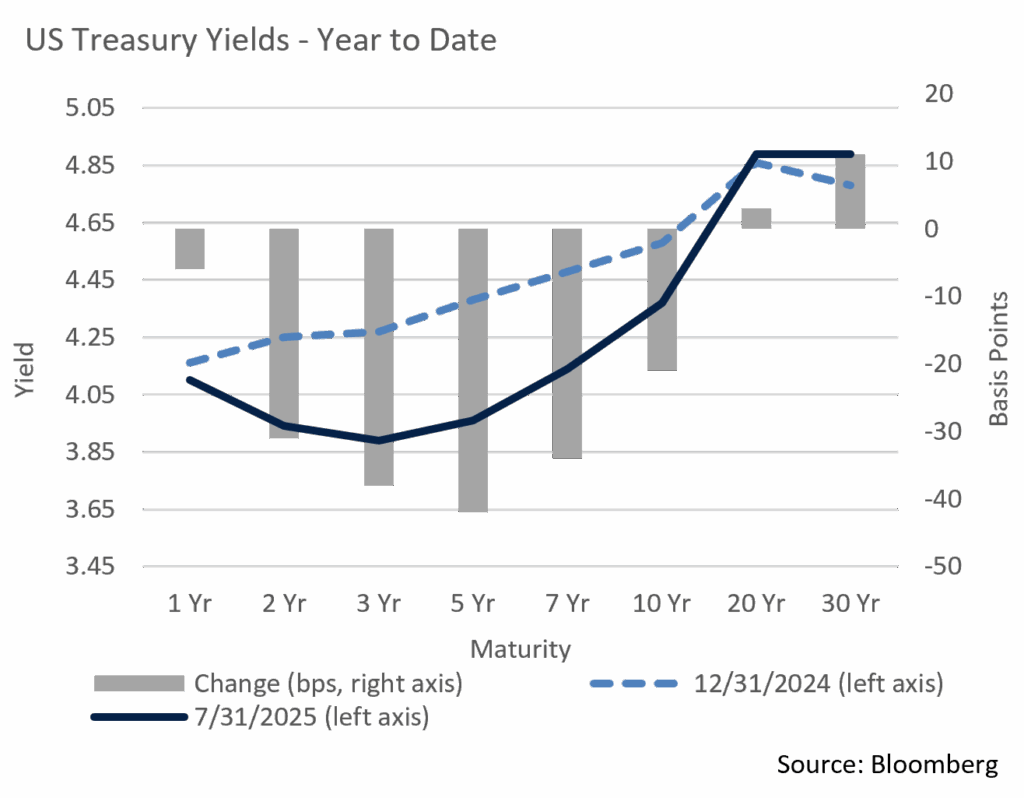
- July saw a sustained bull steepening trend that initially emerged at the end of April. The front end of the curve moved sharply lower due to tailwinds generated by optimism around Fed action, while 10-year+ portions of the curve lagged.
- Yields on the 1 to 3-year part of the curve declined by 18 bps while 5-year maturities experienced a yield drop of 14 bps. The 10-year maturity increased in yield by 6 bps, while yields rose by 13 to 15 bps from 10-years and out.
- The 2s-30s curve slope steepened 32 bps, topping the significant move in slope we saw in June. The bulk of relative steepness can be found inside of 10 years with 25 bps of steepening coming just from the 2 to 10-year portion of the curve. This shift in curve structure has fueled the positive price performance recently enjoyed by shorter maturity strategies.
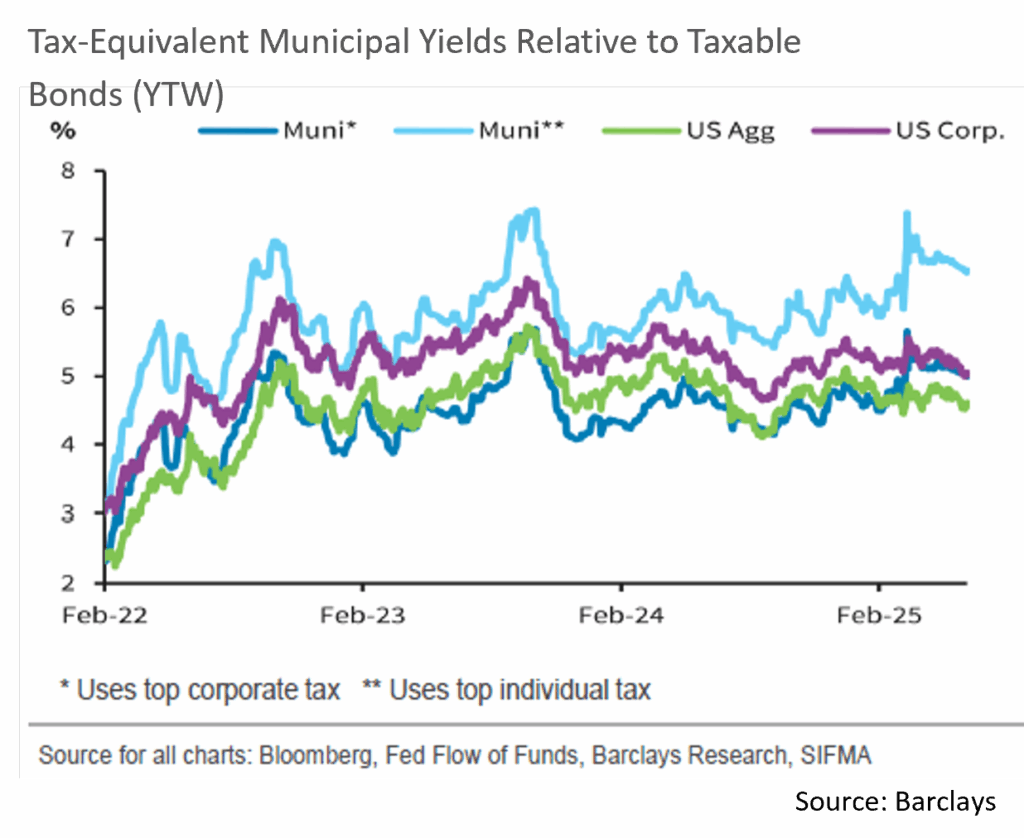
- Against a backdrop of Treasury volatility, municipals followed suit, and for a 3rd month in a row relative valuation ratios closed richer in the front end than on the longer part of the curve. Specifically, 2-, 3- and 5-year AAA municipal/UST ratios declined by 4.9% – 6.7% relative to same maturity Treasuries, while and 30-year ratios largely stayed flat. Ratios closed the month at 68% over 5 years, 77% for 10 years, and 95% at 30 years.
- July tax-exempt new issuance rose to a high of $60B, while gross issuance totaled $64.1B, marking the 3rd highest month on record, according to JP Morgan. This brings the YTD tax-exempt total to $335B, up 17% over last year’s record level.
- Demand remains strong though with $2.6B of positive municipal net fund flows according to Barclays. The bulk of the +$17.3B of YTD net flows is accounted for by ETFs, inflows that have largely come at the expense of mutual funds.
Corporate Markets
- Investment Grade issuance during the month of July was unseasonably light with just $84.4 billion coming to market. It was a $15.6 billion miss on expectations and the meager $12.2 billion brought to market during the last week of the month did not help. YTD, total issuance hovers around $979 billion and the supply projection for $125 billion should tip the balance to over $1 trillion, in-line with overall expectations for this point in the year. Given this, market volatility and interest rate moves will continue to be drivers of the issuance backdrop going forward.
- Credit spreads over the month were relatively benign and stayed within a band of 1-3 bps for much of the time. The 76bps OAS end of month print on the Bloomberg US Corporate index was the low for the year and just 4 bps lower than where we began 2025. Continued uncertainty surrounding the President’s plan for global tariffs has been a focus of many market participants and has put pressure on sentiment at times. High demand and the prospect of current yield levels fading have balanced each other out.
- US Treasury rates were generally higher over the course of the month. The benchmark 10Yr bond rose 15bps to 4.38% whereas the 2Yr bond rose 24bps to 3.96%. The move in the very front end of the curve eased some of the deepening of the 6-month to 5Yr troth that has been in place for quite some time. The flattening trend during the month was, again, inconsistent, and future moves in that range will be dictated by the commentary and potential action coming out of the federal reserve.
Sources: Bloomberg, JP Morgan, Barclays, Lipper
Public Sector Watch
Credit Notes
President Trump signed into law the “One Big Beautiful Bill Act (“OBBBA”)” on July 4th. While there are wide-ranging implications for the economy, individuals, and corporations, it is our opinion that the effects of the OBBBA provisions on the municipal market will be modest, particularly as it concerns stronger credits. Near-term repercussions are particularly limited, as many provisions do not go into effect for several years or will be phased in over multi-year periods. This horizon provides time and opportunity for issuers to adjust even if such responses do not fully mitigate the effects. Given our longstanding preference for investing in high-quality municipal issuers, we are not expecting to make significant changes to our clients’ portfolios due to the new law.
Municipal Market Implications
Tax-Exempt Borrowing
- The ability of municipalities and other qualifying entities to issue federally tax-exempt debt remains intact. Even those issuers that sit on the peripheral of qualifying for the public good, such as corporations, stadiums, quasi for-profit projects, were untouched.
- The status quo is a benefit for national infrastructure, as state and local governments play an outsized role in financing essential infrastructure across the country and have been doing so for decades.
SALT Cap Expansion
- The OBBBA expands the deduction of state and local taxes from the federal income calculation to $40,000 from the current $10,000 cap. This higher threshold phases out for taxpayers with adjusted gross income above $500,000.
- We do not feel that demand for municipal bonds will be negatively affected. Tax-exempt bonds provide an attractive means of generating income that is exempted from federal income tax.
Municipal Credit Implications
Hospitals
- One of the most significant provisions of the OBBBA lies in changes to Medicaid. Changes to eligibility and access to subsidized insurance are likely to result in 11 to 15 million people losing health insurance over the next 10 years.
- Hospitals will face lower revenues, higher bad debts, and increased charity expenses, negatively impacting operating margins.
- The OBBBA also made changes to supplemental funding mechanisms – Provider Taxes and State Directed Payments – which will also crimp cash flows.
- Health systems that serve a large Medicaid population and have a greater reliance on supplemental payments face the largest challenges, reinforcing our preference for investing in large, well-run hospitals with experienced management teams that serve markets with favorable demographics.
State & Local Governments
- Medicaid cuts will impact states, as they share in the funding of the program. While some of the changes will be passed on to healthcare systems, states are responsible for a portion of the costs and will need to make financial adjustments to offset negative budget implications.
- States will need to increase revenues, reduce benefits, or restrict eligibility in response to federal Medicaid funding changes. Medicaid is one of the largest, if not the largest, state budget line items, highlighting the decisions lawmakers will need to address.
- States will also see increased costs resulting from changes to the Supplemental Nutrition Assistance Program (SNAP), with individual states becoming responsible for a greater share of the administrative costs as well as a portion of the benefit costs for the first time.
Higher Education
- The bill expands an existing Endowment Tax for specific universities and colleges and creates a tiered system where some private universities will see their tax levy increase. The tax rate will vary from 1.4% (pre-OBBBA rate) to 8% for those universities with more than $2M in endowment per student. The tax excludes those schools with less than 3,000 students and public universities and those with less than $500k endowment per student.
- Notably, the impacted institutions, by definition, have sizeable financial resources. While the tax will negatively impact budgets, it should be very manageable for these wealthier entities.
Source: “One Big Beautiful Bill Act” Public Law No.: 119-21 (07/04/2025)
Composite Portfolio Positioning (As of 7/31/25)
Strategy Overview
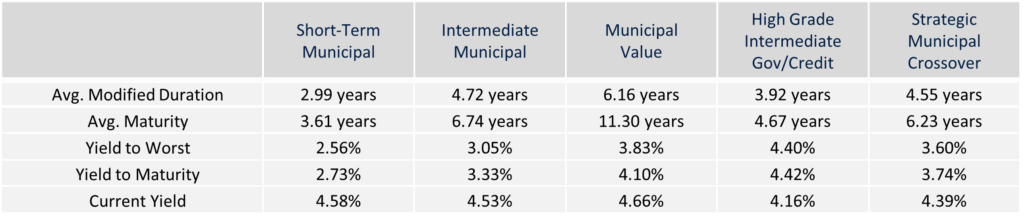
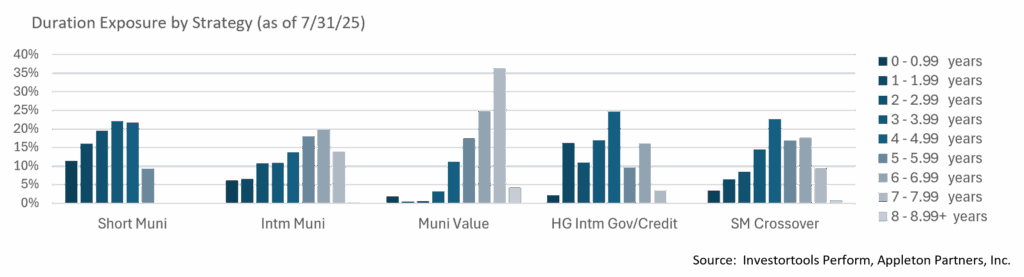
Duration Exposure (as of 7/31/25)
The composites used to calculate strategy characteristics (“Characteristic Composites”) are subsets of the account groups used to calculate strategy performance (“Performance Composites”). Characteristic Composites excludes any account in the Performance Composite where cash exceeds 10% of the portfolio. Therefore, Characteristic Composites can be a smaller subset of accounts than Performance Composites. Inclusion of the additional accounts in the Characteristic Composites would likely alter the characteristics displayed above by the excess cash. Please contact us if you would like to see characteristics of Appleton’s Performance Composites.
Yield is a moment-in-time statistical metric for fixed income securities that helps investors determine the value of a security, portfolio or composite. YTW and YTM assume that the investor holds the bond to its call date or maturity. YTW and YTM are two of many factors that ultimately determine the rate of return of a bond or portfolio. Other factors include re-investment rate, whether the bond is held to maturity and whether the entity actually makes the coupon payments. Current Yield strictly measures a bond or portfolio’s cash flows and has no bearing on performance. For calculation purposes, Appleton uses an assumed cash yield which is updated on the last day of each quarter to match that of the Schwab Municipal Money Fund.
This commentary reflects the opinions of Appleton Partners based on information that we believe to be reliable. It is intended for informational purposes only, and not to suggest any specific performance or results, nor should it be considered investment, financial, tax or other professional advice. It is not an offer or solicitation. Views regarding the economy, securities markets or other specialized areas, like all predictors of future events, cannot be guaranteed to be accurate and may result in economic loss to the investor. While the Adviser believes the outside data sources cited to be credible, it has not independently verified the correctness of any of their inputs or calculations and, therefore, does not warranty the accuracy of any third-party sources or information. Any securities identified were selected for illustrative purposes only, as a vehicle for demonstrating investment analysis and decision making. Investment process, strategies, philosophies, allocations, performance composition, target characteristics and other parameters are current as of the date indicated and are subject to change without prior notice. Not all products listed are available on every platform and certain strategies may not be available to all investors. Financial professionals should contact their home offices. Registration with the SEC should not be construed as an endorsement or an indicator of investment skill, acumen, or experience. Investments and insurance products are not FDIC or any other government agency insured, are not bank guaranteed, and may lose value.