


Insights & Observations
Economic, Public Policy, and Fed Developments
- The federal government reopened on November 12th after the longest shutdown in American history. The resulting continuing resolution will only fund most of the government through January 30th, so a second shutdown is possible, maybe even probable. Until then, however, we will be wrestling with two concurrent problems.
- First, a sizable backlog of federal economic data needs to be worked through. Some data, notably most of the October releases, will be missed altogether, with subsequent reports representing two-month changes. These reports are not expected until after the December FOMC meeting, therefore, the Fed will not have clarity on economic conditions after September when they next meet.
- The second and more subtle issue is that it’s unclear how much of an impact the shutdown had on the economy. A traditional rubric is a protracted shutdown can strip around 0.1% per week off GDP; this would suggest Q4 growth slowed more than a half point more than it might otherwise have. Even if the Fed did have more contemporaneous data, it would take a few more months to fully assess the impact the shutdown had on the real economy beyond a simple lack of data.
- Of the delayed releases we do have, the September jobs report was arguably the most encouraging. The 119k jobs created were still objectively weak, but more than double the Bloomberg consensus estimate of 51k, and higher than any of their surveyed forecasts. There were modest downward prior revisions, and the market response was driven by an unemployment rate increase from 4.3% to 4.4%. However, the rate rose due to marginally attached workers re-entering the workforce rather than a decrease in employment; this isn’t necessarily a “bad” reason.
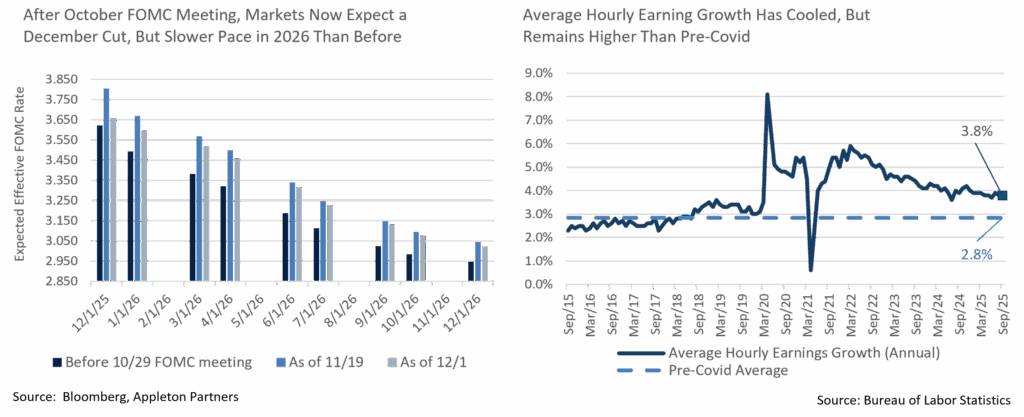
- If low job growth is due to low labor availability rather than demand, as a popular hypothesis holds, then one place you might find support for this is the average hourly earnings data that BLS releases with labor reports. For now, the evidence is inconclusive; earnings rose by less than forecast in September, though to be fair, this was a month when the potential workforce unexpectedly increased as more workers began searching for jobs. On a year-over-year basis, earnings are still showing healthy growth, at a better-than-expected +3.8%. This is a full point above the pre-Covid trend.
- After the October FOMC meeting, December rate cut expectations came full circle, driven largely by Fed speak. Quite possibly by design, the hawkish members most inclined to hold rates spoke early in the month and drove December cut probabilities down to an intra-month low of 29%. As dovish speakers took the floor in the second half of the month, market expectations reversed and now a December cut is fully priced in. However, while December expectations shifted significantly, longer-term ones were little changed. The Fed is now expected to cut in December (though, we would caution that markets are still too confident, given how closely the Fed is divided), but forward rate expectations for 2026 and 2027 gave back very little of their post-meeting movement. The market in aggregate expects the Fed to move slower in 2026 than before. While rate expectations are only 10bps higher by the end of 2026 than they were before October’s meeting, the cuts that will get us there are expected to occur later in the year, and a third cut is now less certain. The drama around a potential December cut has, in our eyes, obscured a meaningful shift in next year’s policy expectations.
Sources: Bloomberg, Appleton Partners, and Bureau of Labor Statistics
From the Trading Desk
Municipal Markets
- November saw little change in the municipal yield curve in the face of record municipal supply and intra-month volatility in UST rates. As investors contended with an inverted front end of the curve, the curve steepened slightly on the month, particularly within 10-year or shorter maturities. Specifically, the 2 to 30-year curve steepened by 3bps, while the 2 to 10-year and 2 to 5-year curves steepened by 4bps and 5bps, respectively.
- Relative to absolute yield moves, the 1-year saw the largest magnitude move, dropping by 6bps, while the 3-year stayed flat. The 5- and 7-year parts of the curve saw yields increase between 3 and 4bps, creating a curve twist. All spots on the curve north of 7 years saw yields either remain flat or change by only 1bp. Directionally, all experienced a yield increase other than the 15-year spot, which experienced a 1bp decline.
- AAA municipal ratios cheapened by 1-3% across the board and ended the month at 70% for 3 years, 67% over 5 years, 69% for 10 years, and 89% in 30 years.
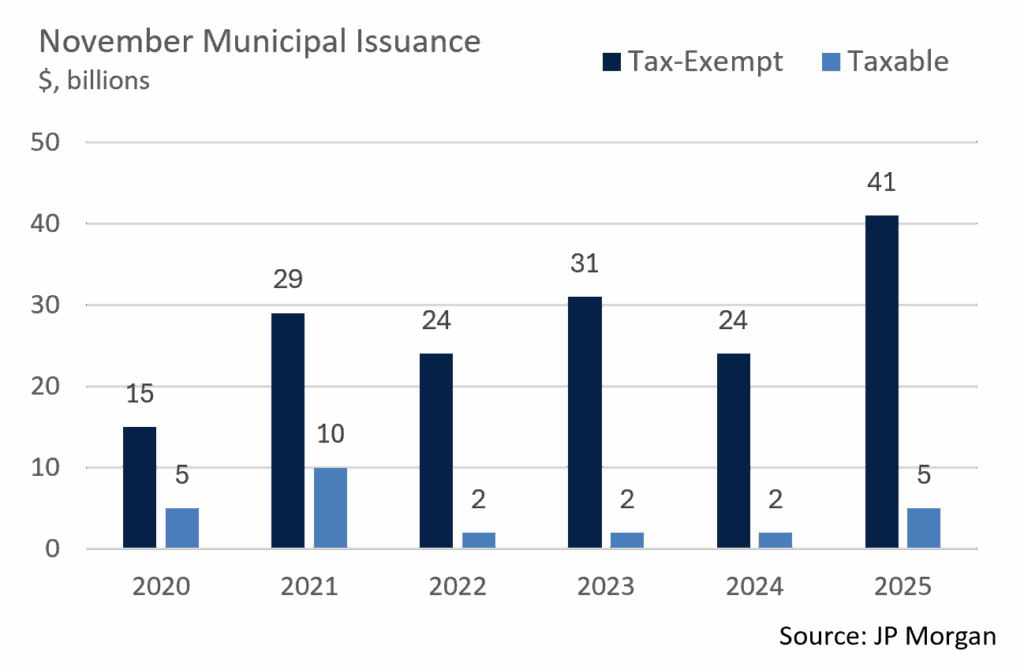
- According to JP Morgan, November gross municipal issuance totaled $45.2B, substantially higher than the same month of the prior year, marking the 3rd highest gross supply for the month on record, trailing only November 2010 and 2017. On a purely tax-exempt basis, supply of $40.7B marked the largest issuance month ever, slightly outpacing November 2017. This brings the YTD gross supply to $529B, of which tax-exempt issuance is $483B, levels that exceed 2024’s pace by 15 and 14%, respectively. New supply has been receding somewhat after a period of aggressive issuance, a trend that may prove to be supportive for municipals. This technical factor is also indicated by November estimated redemptions of more than $30B, along with subdued market activity around the Thanksgiving holiday.
- In anticipation of another 25bp Fed rate cut at the December 10th meeting, municipal fund flows sustained their upward momentum. November’s net flows of about $1.4B increased the YTD total to over $45B, the bulk of which (>$29B) is accounted for by ETF subscriptions.
Corporate Markets
- Investment Grade Credit spreads within the Bloomberg US IG Corporate Bond Index began the month at an OAS of 82bps before ending 2bps lower at 80bps. While that level is still elevated relative to the last few months, it is narrower than the YTD average of 85bps. The backdrop in Investment Grade remains strong, with demand continuing to outpace supply. Technical drivers have been persistent and do not appear to be letting up anytime soon as spreads remain range-bound. With a Fed rate cut in the cards for December, there could be further downward pressure on spreads as we close out the year.
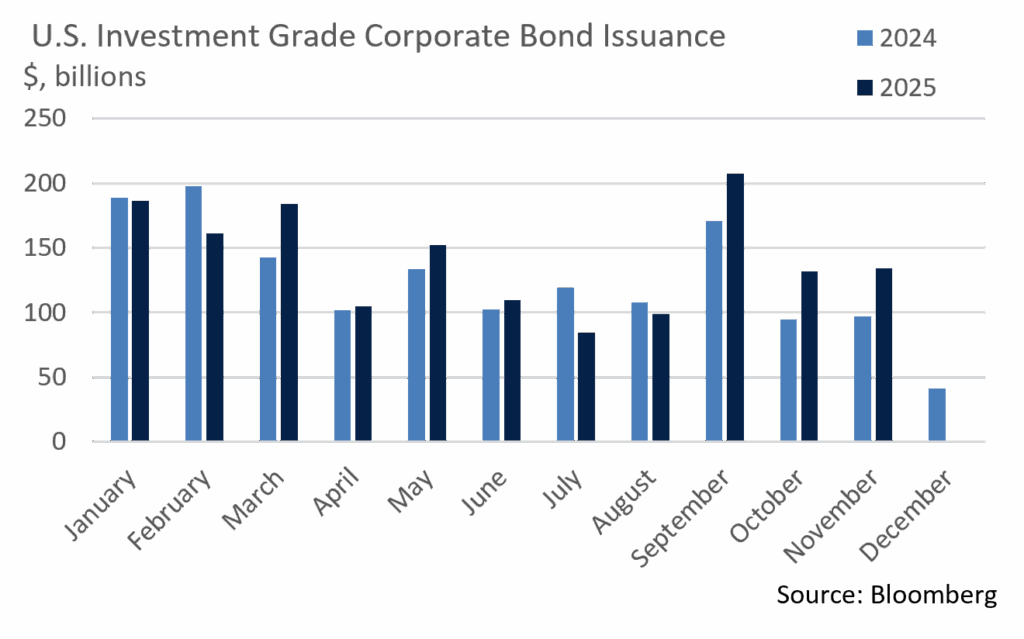
- November’s supply of $134B of Investment Grade bonds fell $3 billion short of November 2012’s record level. Several large deals came over the course of the month, and most offerings were met with considerable support from buyers chasing yield. On average, deals were 3+ times oversubscribed, with pricing coming in much tighter than initial expectations. December supply tends to be on the lower and slower side, and syndicate desks are calling for $40B of new deals to end the year. While there is potential to reach the $1.6T issuance mark for 2025, issuers will pick their spots going into year-end.
- High Yield bonds sustained their rally in November with the yield on the Bloomberg US Corporate High Yield Index ending the month at 6.57%. That ties the previous YTD low of September 18th and is 65bps off the average and 190bps below the YTD high. Issuers took advantage of lower yields and tighter spreads to bring $21B of new high yield offerings to market. This is an indication of favorable overall credit conditions, marking the largest November issuance since 2021. However, we anticipate that buyers will be more cautious in December given the delay in economic data and a dovish Fed.
Sources: Bloomberg, Barclays, JP Morgan, and Lipper
Public Sector Watch
Managing Data Center Driven Public Power Demand
Data centers are currently top of mind in the public power community as management teams are excited about the opportunity they present for load growth after stagnant conditions from 2007-2022. According to the International Energy Agency, data centers accounted for about 4% of the US’s total electricity consumption in 2024, a share that is projected to double by 2030. From a credit perspective, we are looking closely at how public power utilities are handling this newfound demand and whether management teams are being thoughtful about managing their credit quality in this new era.
Our analysis was affirmed after attending a recent public power conference of many large issuers. By and large, management teams are being thoughtful about ringfencing the credit risk associated with data center related demand surges. The terms of negotiation vary case-by-case, although many public power providers are taking prudent financial measures such as:
- Assessing upfront payments from high volume users to protect the utility and retail customers;
- Requiring hyperscalers (Large cloud companies that provide services such as computing and storage at enterprise level scale. Examples include Amazon Web Services, Microsoft Azure, Google Cloud Platform) to bring their own power with them to reduce the impact on the overall grid;
- Instituting supplemental agreements that mitigate risks with large customers.
Data center demand could also increase electricity bills for mainstream users. According to a Carnegie Mellon University study, electricity bills could increase by 8% nationally and up to 25% in certain markets that have a high concentration of data centers such as Northern Virginia. This could pressure affordability over time and highlights the importance of a strong service area.
With a month remaining in 2025, issuance for the public power sector will likely come in lower than 2024. However, we are expecting strong issuance in 2026 to the tune of a 10-15% year-over-year increase. The US requires a lot of infrastructure investment, especially in terms of the power grid and transmission lines. We foresee ample issuance in the public power sector in 2026 and in the next few years to help finance these improvements.

Management teams in the public power space are cognizant of the AI bubble headlines and do not want to recreate the dot com bubble. The nightmare scenario would be for these public power utilities to overleverage themselves and build/buy new supply only for the data center to abandon the project. It is a difficult problem, and as one power utility CEO put it, “we have to determine if we want to power one large data center or 100,000 homes.”
From an investment standpoint, we are targeting public power utility bond issuers that are large, enjoy significant scale, operate in strong service areas, have adequate financial profiles, and significant rate setting authority. These characteristics are seen by our Credit Research team as important ingredients in maintaining long-term credit quality in a rapidly changing sector.
Sources: https://www.iea.org/reports/energy-and-ai/energy-demand-from-ai, https://www.cmu.edu/work-that-matters/energy-innovation/data-center-growth-could-increase-electricity-bills
Composite Portfolio Positioning (As of 11/30/25)
Strategy Overview
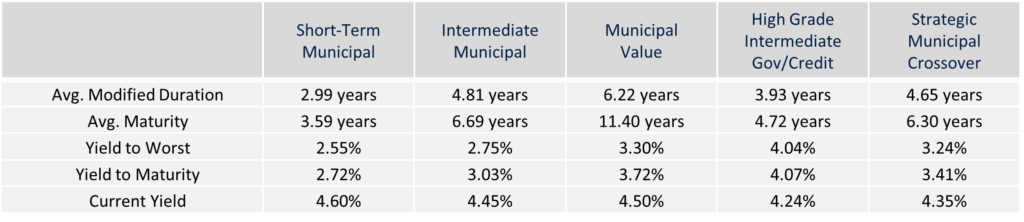
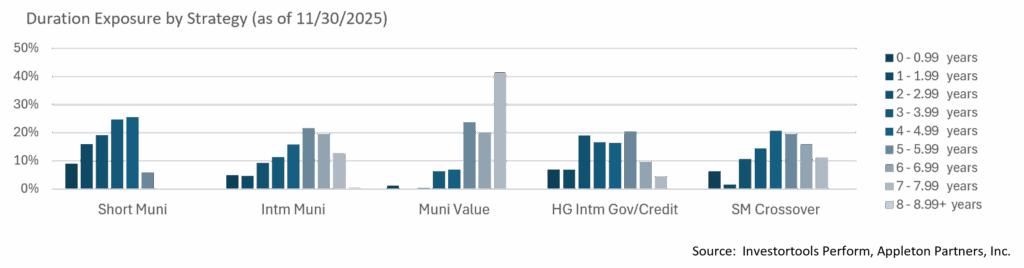
Duration Exposure (as of 11/30/25)
The composites used to calculate strategy characteristics (“Characteristic Composites”) are subsets of the account groups used to calculate strategy performance (“Performance Composites”). Characteristic Composites excludes any account in the Performance Composite where cash exceeds 10% of the portfolio. Therefore, Characteristic Composites can be a smaller subset of accounts than Performance Composites. Inclusion of the additional accounts in the Characteristic Composites would likely alter the characteristics displayed above by the excess cash. Please contact us if you would like to see characteristics of Appleton’s Performance Composites.
Yield is a moment-in-time statistical metric for fixed income securities that helps investors determine the value of a security, portfolio or composite. YTW and YTM assume that the investor holds the bond to its call date or maturity. YTW and YTM are two of many factors that ultimately determine the rate of return of a bond or portfolio. Other factors include re-investment rate, whether the bond is held to maturity and whether the entity actually makes the coupon payments. Current Yield strictly measures a bond or portfolio’s cash flows and has no bearing on performance. For calculation purposes, Appleton uses an assumed cash yield which is updated on the last day of each quarter to match that of the Schwab Municipal Money Fund.
This commentary reflects the opinions of Appleton Partners based on information that we believe to be reliable. It is intended for informational purposes only, and not to suggest any specific performance or results, nor should it be considered investment, financial, tax or other professional advice. It is not an offer or solicitation. Views regarding the economy, securities markets or other specialized areas, like all predictors of future events, cannot be guaranteed to be accurate and may result in economic loss to the investor. While the Adviser believes the outside data sources cited to be credible, it has not independently verified the correctness of any of their inputs or calculations and, therefore, does not warranty the accuracy of any third-party sources or information. Any securities identified were selected for illustrative purposes only, as a vehicle for demonstrating investment analysis and decision making. Investment process, strategies, philosophies, allocations, performance composition, target characteristics and other parameters are current as of the date indicated and are subject to change without prior notice. Not all products listed are available on every platform and certain strategies may not be available to all investors. Financial professionals should contact their home offices. Registration with the SEC should not be construed as an endorsement or an indicator of investment skill, acumen, or experience. Investments and insurance products are not FDIC or any other government agency insured, are not bank guaranteed, and may lose value.