


Insights and Observations
Economic, Public Policy, and Fed Developments
- The most important moment of the Federal Reserve meeting on January 31st was Powell’s response to the final question about the risks posed by economic strength. He indicated in no uncertain terms that the Fed was no longer very concerned about strong consumption or growth, since inflation had continued to fall the entire second half of the year despite a fast-growing economy. For a Fed that spent the past two years focused on demand destruction, this represents a critical paradigm shift on their part, and the clearest indication yet that the Fed’s planning for a “soft landing” may no longer be merely aspirational.
- It’s a good thing, too, because otherwise, the Fed might have had plenty to worry about; the meeting was bookended by extremely strong data releases. The week before had brought a robust Q4 GDP report, with growth of +3.3% a full percentage point above consensus. The details were excellent, too – strength was broad, and notably private sales to domestic purchasers (which strips out trade, inventory changes, and government contributions and is a great measure of underlying demand) came in at +2.6%, closer to consensus but still very robust. The quarter’s early shakiness proved fleeting.
- Then came Friday’s blowout jobs report, at 353k, nearly double the consensus estimate, plus 2023 annual revisions totaling an additional 359k jobs over the full year. This is roughly equal to a month and a half of job growth at the pre-revision 2023 monthly average and represented an exceptionally strong report.
- The market reaction was also encouraging. Powell had pressed back strongly against expectations of a March rate cut in his Q&A, but the futures market still considered a cut in March a tossup (we consider this wildly optimistic) and the 10Yr had started to drift below 4% and into the 3.80s. After the report, a March cut fell to a 1-in-5 probability, and the 10Yr popped back up just above 4%. The jobs report didn’t push the rates market in a new direction, so much as it shocked it back to its senses.
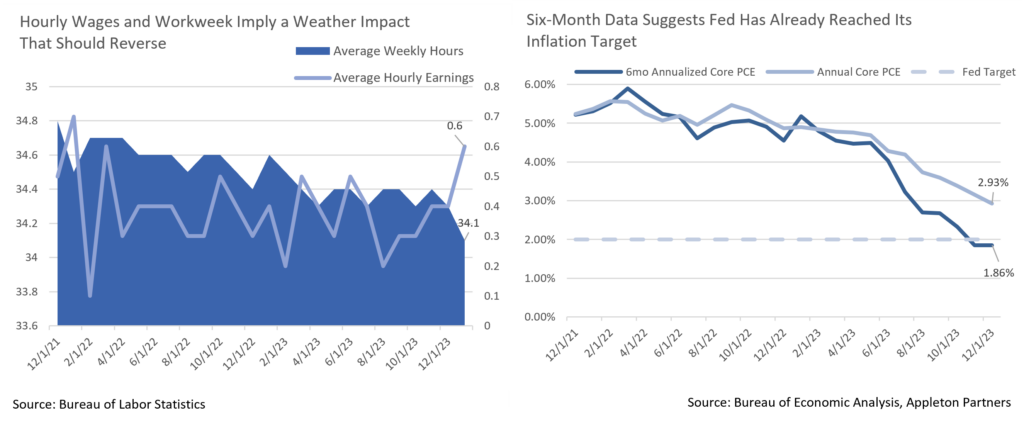
- Another aspect of the labor report that garnered attention was the sharp rise in hourly earnings, +0.6% on the month and +4.5% for the trailing year. This deserves some context. The increase came with a fall in the average workweek, dropping out of the tight range of 34.3 to 34.4 hours where it had spent essentially all of 2023, to 34.1, and in a month with a national cold snap and nearly double the monthly average of employees not working for weather-related reasons. This looks like weather-related composition shifts favoring higher paid job that will likely unwind next month.
- Otherwise, incoming data continues to look good. GDP reports now show two consecutive quarters of +2.0% PCE, despite above-trendline growth. ISM Services never weakened, and while ISM Manufacturing remains in contraction, it is in a strong upwards trend. Powell’s optimism is understandable. The risk here is no longer that the Fed cannot get on top of inflation; they have. Rather, the risk is now reacceleration if the Fed eases too quickly. And, with the Fed now committed to not reflexively tighten based on consumption alone without separate evidence of inflation, a major risk of policy error has been taken off the table.
From the Trading Desk
Municipal Markets
- January is typically a positive performance month for municipal strategies as demand often drives favorable technicals. This year was not the case though, as a Bloomberg Municipal Bond Index gain of +2.32% in December was followed by a -0.51% monthly return, the worst January since 2011. Municipals have been taking their cue from Treasuries, and their higher yields to start the year have impacted the tax-exempt markets.
- New municipal issuance of $30 billion was up 25% from January 2023, marking the highest level since 2017. As has been the case with investment grade corporates, tax-exempt supply continues to be well received. Bloomberg’s 30-day visible supply is now estimated to be $7.8 billion. On the demand side, retail investors have warmed to municipals with net fund inflows of $1.5 billion over the last week of January alone. February is expected to produce almost $42 billion of coupon and principal payments, sources of cashflow for reinvestment that should fuel sustained demand.
- Relative to portfolio positioning, we are finding opportunities to sell shorter duration bonds and reinvest on the intermediate to longer ends of the curve. At present, the trough is in the 2029 to 2030 maturity range, beyond which relative steepness improves. Modestly higher yields allow us to buy income streams at cheaper levels, with market expectations for a Fed cut in March diminishing with May now far more likely.
Corporate Bond Markets
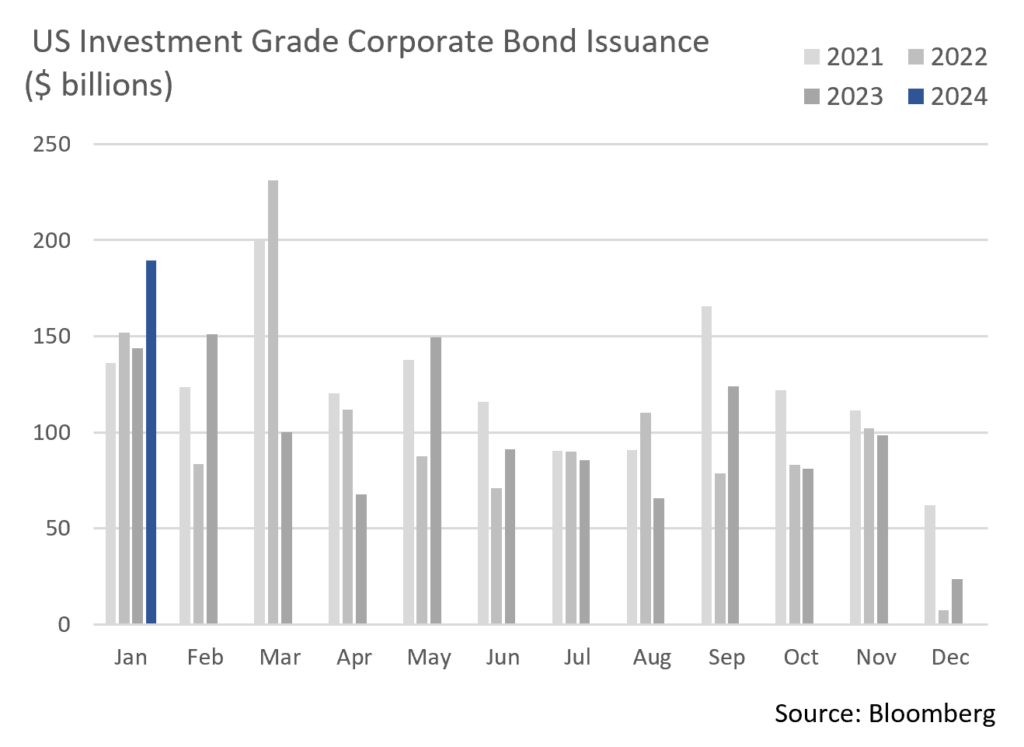
- Primary market action drove the Investment Grade storyline to begin 2024 as new issue volume topped $189 billion, shattering the previous January record of $175 billion set in 2017. The surge also beat market expectations of roughly $160 billion. This supply was met with robust demand as investors moved to get ahead of the potential for receding interest rates. New issue concessions fell to just 2.7 bps on the month reflecting the strength of new deals coming to market. A couple of notable deals even priced with negative concessions to the same issuers’ outstanding bonds.
- Market appetite for credit was also illustrated by January’s new offerings being oversubscribed by an average of nearly 4x, as well as by an average of 23 bps of spread compression on bonds as they broke into “free to trade” territory.
- The financial sector represented 59% of this month’s Investment Grade Corporate issuance, higher than is typically the case, although January is generally an active month for Financials as they emerge from earnings blackouts. Wall Street analysts are calling for about $150 billion of new issuance in February, a figure we find very plausible given positive market sentiment.
- Risk tone typically reacts to market “jolts” such as the NY Community Bank losses announced late in January. This development reflects ongoing pressure on commercial real estate although we feel risk is largely isolated. Our investment focus in this area remains with Globally Systematically Important Banks (GSIBs) given their more stringent capitalization requirements.
- Demand strength was reinforced when Lipper Inc. reported a massive $2.68 billion of net inflows into Investment Grade mutual funds over the week that ended 2/1, cash flow that followed $1.24 billion of net inflows the prior week. January’s net of $5.38 billion has been integral to absorbing new issuance and maintaining downward pressure on credit spreads.
- The OAS on the Bloomberg Barclays US Corporate Bond Index began the year close to a one-year low of 99 bps, and after quickly hitting 105 bps spreads fell back to 96 bps at month’s end. Initial selling pressure was prompted by a better-than-expected job market, although sustained demand pushed spreads back down. A widening breakout from here seems unlikely over the near term.
Public Sector Watch
Preliminary Budget Highlights
State of California
- Governor Gavin Newsom submitted his proposed 2024-2025 budget in January, projecting a $38 billion shortfall. This compares to the non-partisan Legislative Analyst Office’s (LAO) $68 billion estimated deficit released a month prior. The primary differences relate to the Governor’s projecting revenues $15 billion higher than LAO and his more optimistic economic outlook.
- A challenging fiscal outlook reflects a swift drop in personal and corporate tax revenues over the last year and tax revenue that is expected to be $44 billion lower than the three-year budget enacted in June.
- Proposed budget adjustments include utilizing $13.1 billion of reserves out of a $38 billion balance, fiscal measures including internal borrowing of $5.7 billion, and fund shifts of $3.4 billion, $8.5 billion of various reductions in funding levels, and $7.2 billion in funding deferrals to later years. Notably, the proposal does not include any significant revenue raising tax measures.
- The Governor’s economic outlook and revenue assumptions appear somewhat optimistic, creating a risk factor should the economy falter later in 2024 or 2025. Also of concern is the use of delayed and deferred spending, as this may not be sustainable. More favorably, despite drawing on reserves, budget plans retain a still sizeable balance.
- If the Governor’s budget is approved in its current form (a rarity), we see growing downside risk and will closely monitor revenue collection and subsequent budget projections. While the risk profile of California is softening, we remain comfortable with the state debt we hold and continue to approve California GOs (“AA-” internal credit rating) and related debt. Relative value is always central to our investment process and is an important factor in portfolio management decisions.
New York City
- Mayor Eric Adams has warned of an imminent dire financial situation for months, however his preliminary FY 2024 budget paints a much rosier picture than the spending plan revealed just eight weeks ago. The more recent spending plan includes $2.9 billion in additional tax revenue over a two-year period in FY 2024 and FY2025, greater state support for housing migrants, and a reduction in the estimated cost of migrant care.
- Migrant costs are now projected at about $10 billion, down from November’s $12.5 billion estimate. NY State’s contribution of $2.4 billion will increase by $500 million to support the City’s migrant crisis.
- Mayor Adams now faces skepticism as he intends to scale back $3.7 billion of budget cuts that were to be enacted over four years. Budget critics had said reductions of that size were unnecessary given revenue projections that were $1.5 billion greater than the Mayor’s initial forecast.
- Despite a much healthier financial outlook, New York City is still facing budget gaps of $5 billion in FY2026 and $6 billion in FY2027. Out-year budget gaps are common, and we believe the Administration has the expertise and fiscal flexibility needed to close budget shortfalls, as they have done repeatedly in the past. We continue to approve this credit (“AA” internal credit rating).
2023 Defaults: Limited and Concentration in Typical Sectors
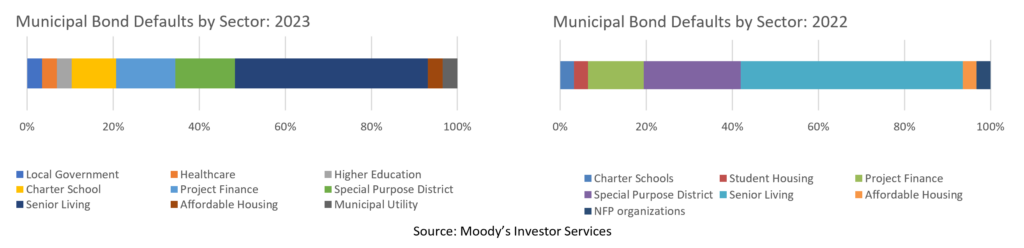
- Delinquencies in the US municipal bond market reported by Moody’s ticked up slightly in Q4 2023, although they were limited to unrated debt within select sectors. Of the thirteen defaults, seven were in the senior living sector, three were charter schools, one a municipal utility, one a local government, and two were special purpose districts.
- Over the past two years, two sectors have accounted for nearly 75% of defaults – senior living and special purpose districts. Special purpose districts are frequently small, specialized entities with a narrow revenue pledge and lack of government backing. Senior living facilities often operate with thin margins and faced outsized impact from the COVID-19 pandemic.
- We generally do not invest in either sector, as investments in these areas rarely align with our risk conscious investment approach.
Strategy Overview
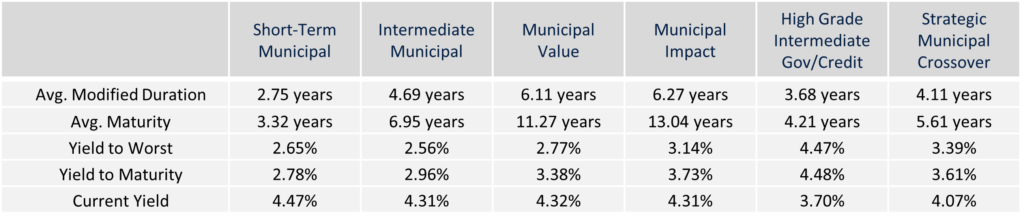
Composite Portfolio Positioning as of 1/31/2024
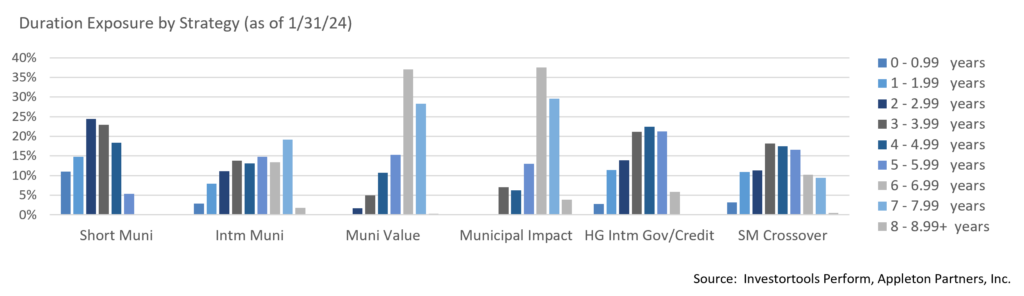
Duration Exposure as of 1/31/2024
The composites used to calculate strategy characteristics (“Characteristic Composites”) are subsets of the account groups used to calculate strategy performance (“Performance Composites”). Characteristic Composites excludes any account in the Performance Composite where cash exceeds 10% of the portfolio. Therefore, Characteristic Composites can be a smaller subset of accounts than Performance Composites. Inclusion of the additional accounts in the Characteristic Composites would likely alter the characteristics displayed above by the excess cash. Please contact us if you would like to see characteristics of Appleton’s Performance Composites.
Yield is a moment-in-time statistical metric for fixed income securities that helps investors determine the value of a security, portfolio or composite. YTW and YTM assume that the investor holds the bond to its call date or maturity. YTW and YTM are two of many factors that ultimately determine the rate of return of a bond or portfolio. Other factors include re-investment rate, whether the bond is held to maturity and whether the entity actually makes the coupon payments. Current Yield strictly measures a bond or portfolio’s cash flows and has no bearing on performance.
Our Philosophy and Process
- Our objective is to preserve and grow your clients’ capital in a tax efficient manner.
- Dynamic active management and an emphasis on liquidity affords us the flexibility to react to changes in the credit, interest rate and yield curve environments.
- Dissecting the yield curve to target maturity exposure can help us capture value and capitalize on market inefficiencies as rate cycles change.
- Customized separate accounts are structured to meet your clients’ evolving tax, liquidity, risk tolerance and other unique needs.
- Intense credit research is applied within the liquid, high investment grade universe.
- Extensive fundamental, technical and economic analysis is utilized in making investment decisions.
This commentary reflects the opinions of Appleton Partners based on information that we believe to be reliable. It is intended for informational purposes only, and not to suggest any specific performance or results, nor should it be considered investment, financial, tax or other professional advice. It is not an offer or solicitation. Views regarding the economy, securities markets or other specialized areas, like all predictors of future events, cannot be guaranteed to be accurate and may result in economic loss to the investor. While the Adviser believes the outside data sources cited to be credible, it has not independently verified the correctness of any of their inputs or calculations and, therefore, does not warranty the accuracy of any third-party sources or information. Specific securities identified and described may or may not be held in portfolios managed by the Adviser and do not represent all of the securities purchased, sold, or recommended for advisory clients. The reader should not assume that investments in the securities identified and discussed are, were or will be profitable. Any securities identified were selected for illustrative purposes only, as a vehicle for demonstrating investment analysis and decision making. Investment process, strategies, philosophies, allocations, performance composition, target characteristics and other parameters are current as of the date indicated and are subject to change without prior notice. Registration with the SEC should not be construed as an endorsement or an indicator of investment skill acumen or experience. Investments in securities are not insured, protected or guaranteed and may result in loss of income and/or principal.