


Insights & Observations
Economic, Public Policy, and Fed Developments
- December’s FOMC meeting offered plenty for market participants to digest despite none of the main elements being surprising. For one, both the statement and Chairman Powell’s press conference made it clear the Fed now expects to be on hold for at least several months. The “dot plot” guided to a cut in 2026 and 2027, though high dispersion and no clear consensus suggests the bigger message is the Fed will be taking a wait and see approach as data comes in. We welcome an extended pause, in part because we see significant distortions in the economic data pertaining to both the maximum employment and price stability sides of the Fed’s dual mandate.
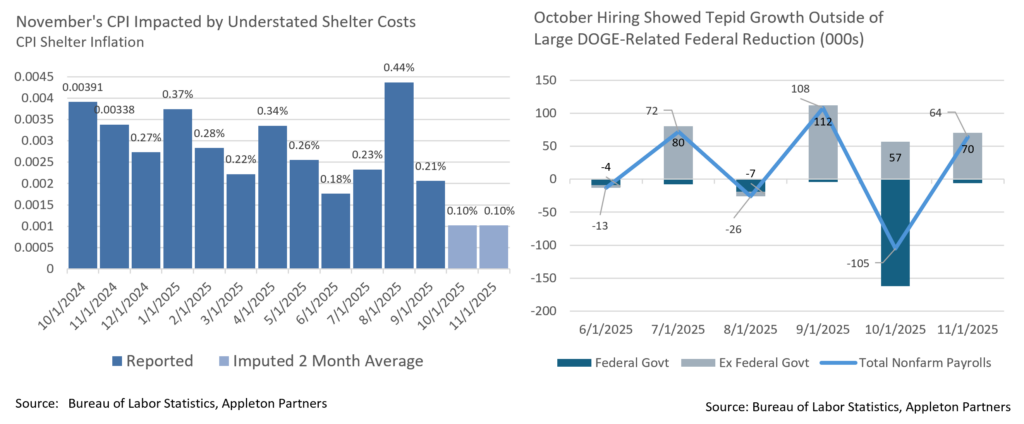
- On the labor front, October’s -105k print was ugly, but we’ve known it would be for months now. The DOGE voluntary severance package would have recipients filing claims at the start of October, so a sharp drop in federal employment was expected. Excluding this -162k decline, the workforce expanded, though at a still soft 57k. There is still room for caution; most of the 270k or so workers who took the package appear to have been unable to find a new job. And, expected or not, the loss of income for 162k consumers will still weigh on aggregate demand. We are not seeing widespread private sector reductions just yet, however, and the private sector is healthier than the jobs report alone suggests.
- Turning to inflation, while the CPI drop to +2.7% headline and +2.6% core looks like significant progress towards the Fed’s +2% objective, the reports’ details warrant caution. By our measure, 0.265 points of the 0.313-point improvement was related to a fall in shelter costs. Except, with BLS closed throughout October, no shelter cost survey was performed. As BLS protocol is to roll forward prior prices when data is missing, this effectively resulted in 0% shelter price inflation over October. While no two-month component price index was released, it’s possible to derive one from the rest of BLS’s published data, yielding a 0.203% increase. This is below the YTD one-month average, implying possible November impacts as well. As shelter inflation is based on a six-month sample, this component will be understated through at least April even without a second shutdown, and with a January 30th stopgap deadline, that’s far from certain. We believe a focus on ex-shelter measures like the Fed’s “Supercore” will become even more important in the first half of 2026 to make sense of inflation data.
- One true surprise from the Fed’s meeting, however, was a resumption of QE in all but name, with the Fed buying Treasury bills to support short term market liquidity. While not intended as monetary stimulus, the scale of the operation will still have impact; initial guidance suggests between open market purchases and ongoing balance sheet runoff reinvestment, the Fed will purchase close to $600B in Treasury bills before the end of 2026, out of estimated Treasury bill issuance of $768B. Regardless of any future Fed rate actions, we expect this to steepen the yield curve by pulling down rates in the frontend.
- After months of simmering tensions, a new macro risk came to the forefront when, in a late-night weekend raid, US special forces captured Venezuelan President Nicolas Maduro and extradited him to New York City to face narco-terrorism charges. The move was unexpected, if not broke then at least bent international norms, and was widely condemned abroad. While markets have thus far digested it calmly, spill-over effects are possible, including similar actions by China or Russia within their spheres of influence, or other forms of retaliation.
Sources: Federal Reserve, Bureau of Labor Statistics, Bloomberg
From the Trading Desk
Municipal Markets
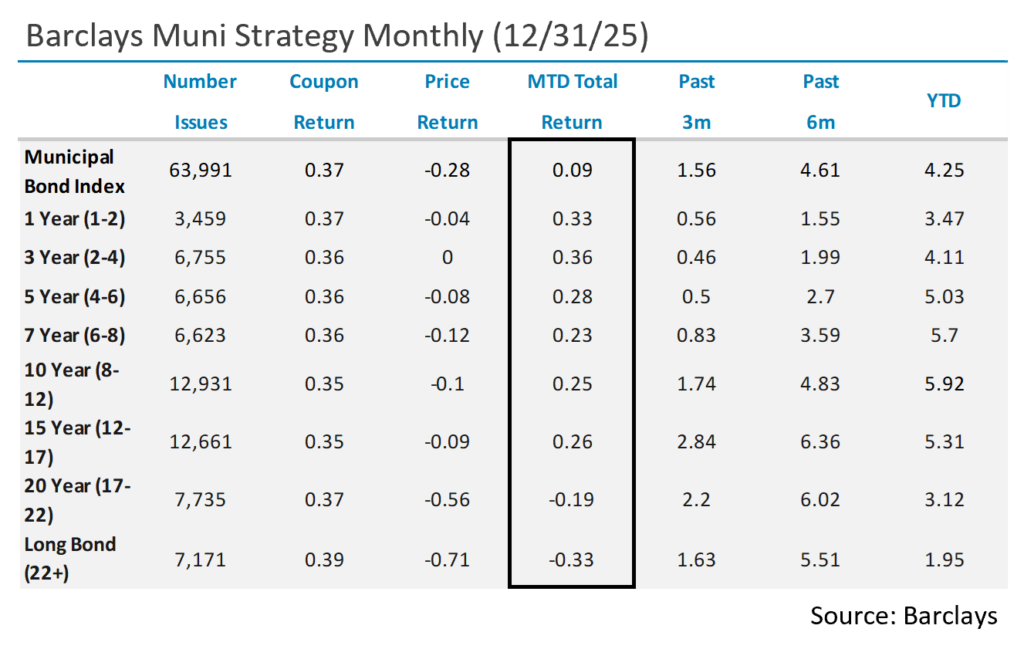
- While intra-month volatility in UST rates was evident (with an upward sloping bias), municipal rates remained relatively anchored in December despite the Fed action in the first half of the month. The curve sustained a slight steepening trend established in November, with the 2s-30s curve moving up in steepness by 13bps, while 2s-10s steepened by 6bps, and 2s-5s moved up 5bps.
- With regards to absolute yield levels, the 3-years and shorter portion of the curve saw yields move modestly lower, specifically by 4bps for 1-year issues and 5bps for 3-years. While the belly of the curve stayed flat, maturities of 10-years and longer saw yields push higher in an ascending manner. There was a modest 1bp increase from 10 to 12-year issues, while 15-year and longer maturities sustained more meaningful moves of 3 to 8bps.
- Municipal ratios remained within a relatively narrow range, although the trend was towards flat to slightly richer ratios across maturities. Ratios out to 3 years settled at 68%, while 5- and 7-year ratios closed the month just shy of 65%. The 10-year maturity settled at 67%, while the 30-year maturity closed at 87.5%
- According to JP Morgan, December gross issuance (largely focused in the first half of the month) totaled $37.9B, 21% higher than the same month of the prior year and a 31% increase relative to the trailing 5-year average. On a tax-exempt basis, supply totaled $35.9B, a 22% increase vs. December 2024. December closed out another record-breaking issuance year with the Bond Buyer reporting a total of about $580B in new issue volume, 13% ahead of 2024.
- Municipal fund demand has helped absorb this new supply, as December recorded $4B of net fund inflows. YTD flows are tracking at roughly +$50B, of which ETFs accounted for the bulk of the total ($35B).
Corporate Markets
- 2025’s Investment Grade Credit new issuance market will go down as the 2nd highest annual volume on record at $1.59T. This only trails the $1.75T brought to market during the acute uncertainty of the COVID pandemic and the ultra-low-interest rate environment of 2020. December’s $32.4B of issuance was much slower than the anticipated $40B, although a slow period around the holidays was expected. We are anticipating a flurry of issuance to begin 2026, with markets expecting a record of $1.80T to $2.25T. Of course, this is all dependent on variables such as Fed policy, the course of tariffs, macroeconomic news, and global tensions.
- High Yield issuance was also robust with spreads and overall yields presenting opportunities for issuers to capitalize on favorable funding conditions. Investor demand absorbed the $328.3B in new debt with ease. This year’s total was the 4th largest on record and continues a trend of higher YoY issuance since 2022. The $457.7B issued in 2021 was the largest yet on record and, if this trend continues, we could see issuance climb towards that level in 2026.
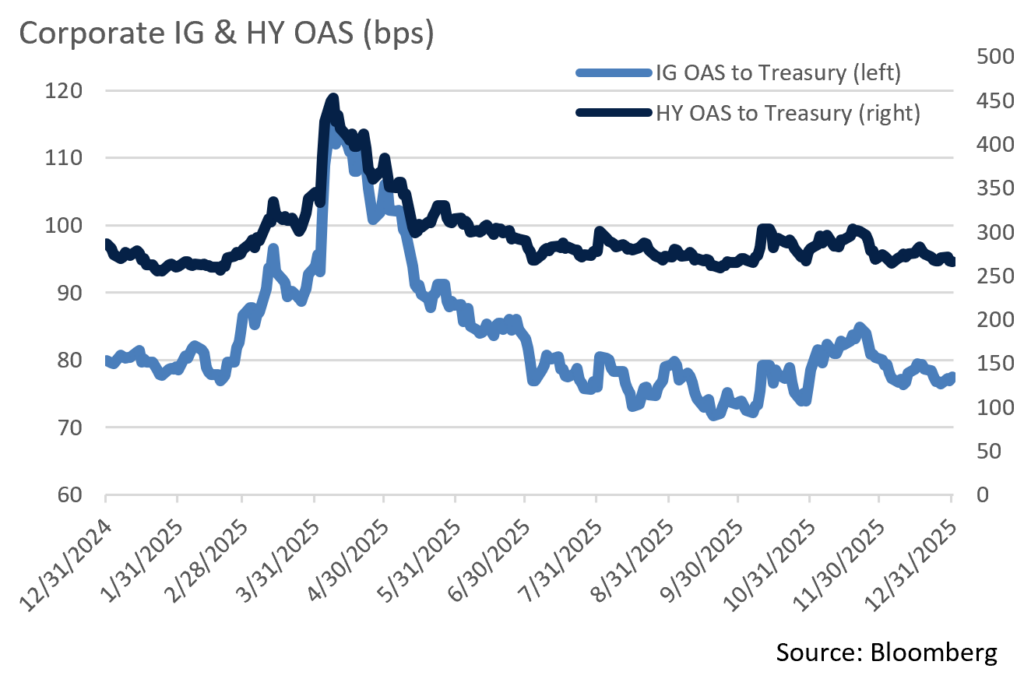
- While IG spreads began to move wider in November, they stayed in check over the course of December. The 80bps OAS recorded on the Bloomberg US Corporate Index only fell to 78bps to close out the year. That’s also just 2bps off where we began 2025. Looking back, the 119bps OAS of “liberation day” aftermath proved to be a short-lived anomaly. 2025’s average OAS was only 84bps, and the 72bps OAS print on September 19th was the lowest seen in at least 10 years. We could see some spread widening in 2026, especially if record setting issuance puts pressure on buyers and fatigue sets in. However, we don’t anticipate significant widening given the credit strength of issuers and the demand for yield and feel that IG spreads should remain in a comfortable range over the near term.
Sources: Bloomberg, Bond Buyer, Barclays, JP Morgan, and Lipper Inc.
Public Sector Watch
2026 Municipal Sector Outlook
The municipal credit market remains on very strong footing heading into 2026, with Appleton’s credit team assigning nearly all sectors a “stable” outlook. Our view of a stable outlook across most sectors reflects the prevalence of fiscally conservative management with intent on building reserves, as many issuers have seen how important that is in uncertain environments such as was experienced during the pandemic, “liberation day,” and amid political pressures. It also reflects careful expense management with nearly all sectors facing above average inflation paired with modest economic growth expectations. Relative to our 2025 credit outlook, two sectors have changed from their prior “stable” outlook, with the Public Power sector upgraded to “positive,” while the Local Government sector has been changed to “cautious.”
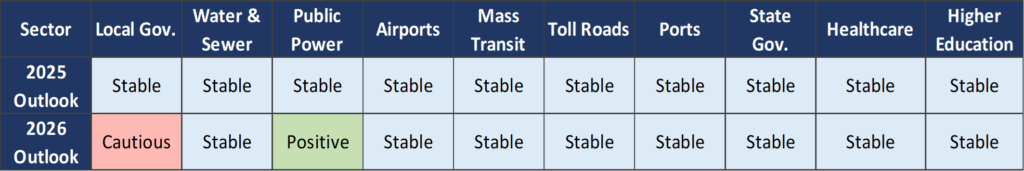
The commentary below highlights the two sectors that have had a 2026 outlook change, Local Government and Public Power.
Local Government:
Our “cautious” outlook for the Local Government sector, which includes cities, counties and school districts, reflects expense pressures that are expected to outweigh positive, but slowing revenue growth in most cases. Local governments are facing the same fiscal pressures as States – higher costs associated with labor, construction, K-12 education, and healthcare – but at a more acute level. As a result, we expect a greater prevalence of operating deficits and resulting draws on reserves in 2026.
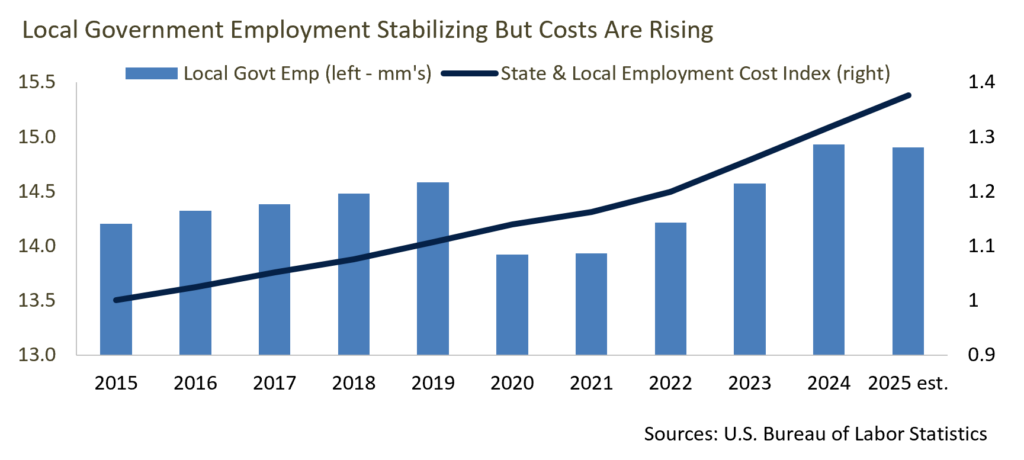
We are more favorable on Cities and Counties, as they tend to have greater budgetary flexibility, although this will vary case-by-case, as some States have stringent restrictions on increasing locally sourced tax revenues. We see the most pressure in K-12 Education, where labor costs are outpacing revenue growth, demographic changes are driving enrollment strains, and pandemic aid is all but gone. We still expect to be able to identify high-quality investment opportunities in the Local Government sector but will be highly selective when examining new issuers and when reviewing existing exposure.
Public Power:
Our “positive” outlook for Public Power reflects the sector’s ability to manage increased demand from data centers and manufacturing, and nuclear and coal coming back into relative favor, a dynamic that offers greater fuel diversity and operational flexibility. Federal government support and the potential for additional deregulation further cements our outlook on the sector. At Appleton, we prefer public power providers with large scale and favorable demographic metrics, solid coverage levels, and considerable financial flexibility. After an extended period of largely flat demand, the sector is now experiencing sustained load growth, creating the need for higher capital investment. The issuers we invest in will generally be able to recover higher costs through rate adjustments. In the event of an economic downturn, the public power sector’s credit quality would likely be more resilient than other higher beta municipal sectors.
Sources: U.S. Bureau of Labor Statistics; Energy Information Administration, “Henry Hub Natural Gas Spot Price,” December 2025; Deloitte, “2026 Power and Utilities Industry Outlook,” October 2025; S&P, “US Public Power and Electric Cooperative 2026 Outlook,” December 2025
Composite Portfolio Positioning (As of 12/31/25)
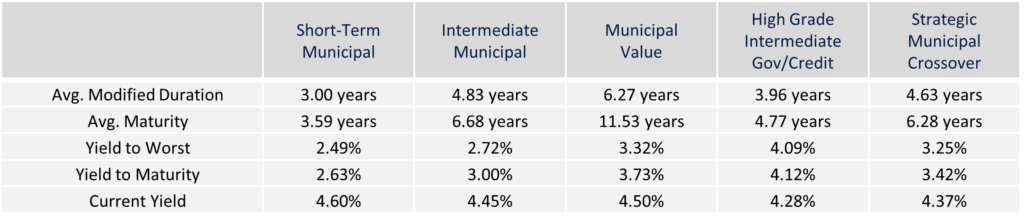
Strategy Overview
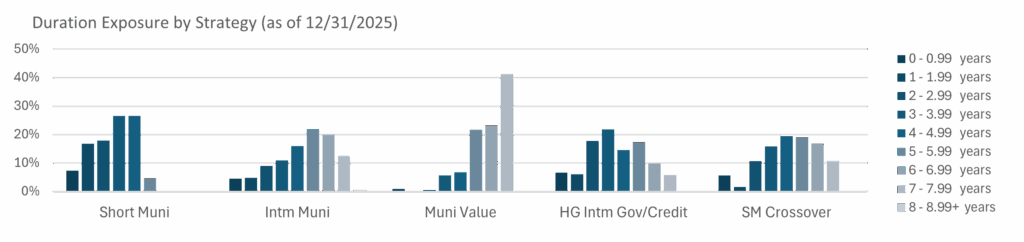
Duration Exposure (as of 12/31/25)
The composites used to calculate strategy characteristics (“Characteristic Composites”) are subsets of the account groups used to calculate strategy performance (“Performance Composites”). Characteristic Composites excludes any account in the Performance Composite where cash exceeds 10% of the portfolio. Therefore, Characteristic Composites can be a smaller subset of accounts than Performance Composites. Inclusion of the additional accounts in the Characteristic Composites would likely alter the characteristics displayed above by the excess cash. Please contact us if you would like to see characteristics of Appleton’s Performance Composites.
Yield is a moment-in-time statistical metric for fixed income securities that helps investors determine the value of a security, portfolio or composite. YTW and YTM assume that the investor holds the bond to its call date or maturity. YTW and YTM are two of many factors that ultimately determine the rate of return of a bond or portfolio. Other factors include re-investment rate, whether the bond is held to maturity and whether the entity actually makes the coupon payments. Current Yield strictly measures a bond or portfolio’s cash flows and has no bearing on performance. For calculation purposes, Appleton uses an assumed cash yield which is updated on the last day of each quarter to match that of the Schwab Municipal Money Fund.
This commentary reflects the opinions of Appleton Partners based on information that we believe to be reliable. It is intended for informational purposes only, and not to suggest any specific performance or results, nor should it be considered investment, financial, tax or other professional advice. It is not an offer or solicitation. Views regarding the economy, securities markets or other specialized areas, like all predictors of future events, cannot be guaranteed to be accurate and may result in economic loss to the investor. While the Adviser believes the outside data sources cited to be credible, it has not independently verified the correctness of any of their inputs or calculations and, therefore, does not warranty the accuracy of any third-party sources or information. Any securities identified were selected for illustrative purposes only, as a vehicle for demonstrating investment analysis and decision making. Investment process, strategies, philosophies, allocations, performance composition, target characteristics and other parameters are current as of the date indicated and are subject to change without prior notice. Not all products listed are available on every platform and certain strategies may not be available to all investors. Financial professionals should contact their home offices. Registration with the SEC should not be construed as an endorsement or an indicator of investment skill, acumen, or experience. Investments and insurance products are not FDIC or any other government agency insured, are not bank guaranteed, and may lose value.