Insights and Observations
Economic, Public Policy, and Fed Developments
- As COVID-19 continues to roil the labor markets, it has presented several challenges to interpreting jobs reports. One of the biggest is related to a mistake the Bureau of Labor Statistics (BLS) acknowledged in their release – a large number of workers who were temporarily laid off due to the pandemic were misclassified as “employed but absent from work” in surveys, causing the unemployment rate to be understated. They estimate this impacted 5 million workers in April. BLS reported unadjusted survey data but estimated that the April and May rates should have been 5 and 3 percent higher, with June much improved but still one point higher than reported.
- The second issue concerns how likely these gains are to be sustained. June’s Employment Situation report showed the unemployment rate dropping from 13.3% to 11.1% as the economy added 4.8 million new jobs. However, the bulk of these jobs – 2.1 million – were in service industries, and with parts of the country experiencing a surge in COVID-19 cases, some of these job gains may not last. Given the pace of COVID-related developments, jobs reports are likely a lagging indicator, and while we welcome the improvement in employment, we are not yet confident in its durability.
- The labor market also faces stubbornly high initial unemployment claims. After a sharp drop in May, weekly initial claims have leveled off, most recently to 1.4 million, little changed from the beginning of June. Continuing claims remain around 19.3 million. Some of the elevated levels after the initial spike were likely related to delays in an overwhelmed unemployment system, yet the longer claim levels remain elevated the less compelling that explanation becomes.
- Personal income fell 4.2% in May, a smaller than expected drop given the slowdown in government aid (which will continue to fall unless stimulus programs are renewed). Spending increased 8.1%, substantial but not nearly enough to offset March and April’s weakness. Personal savings fell, though to a still exceptional 23.2%. Customers seem to be proceeding carefully with their finances in the absence of clarity regarding how and when this pandemic will end.
- This was evident in May retail sales, which were unexpectedly strong, rising by 17.7%, nearly three times the Bloomberg median expectation of 5.6%, after an upwardly revised drop of 14.7% in April. Interviews conducted by the WSJ suggest American consumers are redirecting rather than increasing spending; money originally earmarked for vacations or to be spent on services is instead going towards “at home” items, while also paying down debt and/or increasing savings. Total retail sales are down 6.1% YoY.
- The Federal Reserve signaled in clear terms during their meeting of June 9 and 10 that ultra-low rates are here to stay. The Fed “dot plot” of rate expectations showed the Fed Funds rate remaining on hold through at least 2022, and in his testimony, Jerome Powell quipped that it was difficult to even think about thinking about raising rates. The Fed also indicated that the current pace of bond-buying would continue over the near term, which most market participants interpreted as into September.
- While still on the backburner relative to the pandemic, trade tensions once again flared in June. The US refused to certify Hong Kong’s independence at the start of the month in response to a national security bill proposed by China. The actual bill enacted on July 1 ended up being far stronger and more vaguely worded than expected, prompting protests. Meanwhile, President Trump authorized $3.1 billion in new tariffs on EU goods, corresponding with the six-month review of tariffs in retaliation for Brussels’ illegal Airbus subsidies. The EU is working on $11.2 billion in new tariffs of their own pending the WTO’s decision on US subsidies for Boeing due in September. Renewed trade hostilities could not come at a worse time given the fragile state of the global economy.


From the Trading Desk
Municipal Markets
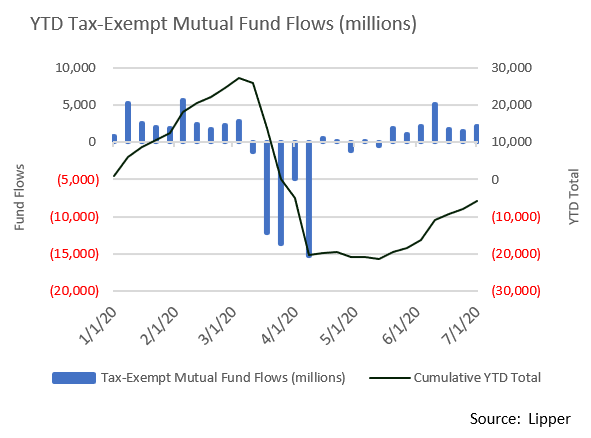
- Demand for municipals has been very strong with the past 7 weeks adding $15 billion of net fund flows, reducing YTD total net outflows to -$6.2 billion from a peak of -$22.1 billion earlier in the year. Long-term funds garnered more than half of these recent inflows. Intermediate and High Yield funds brought in $2 billion each.
- Over the month of June, yields moved slightly higher with the 10Yr AAA increasing 6bps, the 5Yr 3bps, and the 2Yr 11bps. While over the quarter, curve steepness from 2 to 10 years increased from 27 to 63 bps, and in our view, intermediate maturities continue to be more attractive than the short or longer term issues.
- Municipals still present relative value with the 10 Year AAA Muni/UST ratio ending the month at 134.3% after retracing earlier severe dislocation. The post-1990 average for this metric is 86.8%. Although nominal yields across fixed income asset classes are extremely low, the tax and yield advantage of high quality municipals relative to Treasuries is noteworthy.
- June issuance was up 23% over the same month last year as many issuers came to market that had been on the sidelines during the pandemic-induced volatility. Total YTD municipal issuance is now up 14.3% relative to 2019, much of which reflects taxable offerings where issuance is up 230% compared to 2019’s pace. Tax-exempt technicals remain supportive, with new money issuance falling 9.1% over the first half of the year.

Corporate Bond Markets
- Investment grade issuance continues to be incredibly robust as market tone and low rates are making funding attractive. The $169 billion of new bonds issued in June was more than double the $74 billion recorded during the same month last year. This year’s total issuance of $1.18 trillion is on track to easily surpass the record of $1.3 trillion set in 2017.
- Economic uncertainty and a desire to fortify balance sheets are not the only factors bringing issuers to market. Due to ultra-low UST yields and significant spread tightening, real IG Corporate yields are now lower than pre-pandemic levels. Strong, sustained demand and highly accommodative monetary policy are keeping funding costs extremely low, although COVID-19’s impact on the economy could slow activity over the 2H of 2020.
- Option-adjusted spreads have recovered nearly 200 bps of March’s dramatic widening. For example, the cost to issue a typical single A rated 5Yr corporate bond on 12/31/19 was 2.15%, 45bps more than 5Yr UST bonds at that time. As of 6/30/20, the same IG Corporate bond was yielding 0.95%, 66 bps over a compressed 5Yr UST yield of 0.29%.
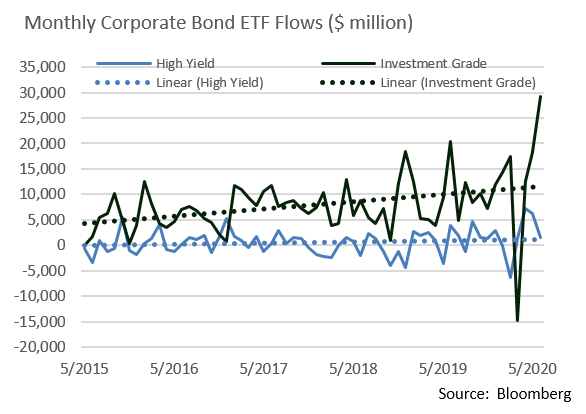
- Retail flows over the last several months have been very strong, thereby bolstering market values. After incurring nearly $15 billion of outflows earlier this year, ETFs regained most of that ground in April by gathering $12.5 billion of net inflows. May took in $18.25 billion and June an astounding $29.25 billion. YTD net flows into IG bond ETFs of $76.96 billion greatly exceeds $56.45 billion realized over the same period last year.

Public Sector Watch
Credit Comments
The State of the State Tax Revenue
- State tax revenues have dropped significantly in the face of delayed personal income tax filings, extended business closures, and sharp declines in economic activity.
- Revenues declined by 49.9% on a collective basis in April 2020 compared to the previous year with all major tax sources impacted. Personal income and corporate income tax revenue both fell by 63.0%, and sales taxes were off 15.8%.1
- May improved somewhat although state tax revenues still lagged 2019 by 20.9%. With only one month remaining in FY20 for 46 states, total state tax revenues still trail the prior year by $41 billion.2
- Personal income tax collections have been severely impacted by the delay of final tax payments to July 15. The Urban Institute notes that 70-75% of April personal income tax collections are derived from estimated and final payments. As states begin to relax stay-at-home orders and delayed 2019 tax payments are made, we will begin to see revenues increase. However, it will likely be a long time before revenues fully recover.
- Fortunately, many states entered the COVID-19 pandemic with structurally sound budgets and “rainy-day funds” at all-time highs, a cushion that should allow fiscally stronger states to make budget adjustments amid a severe economic downturn.
Sales Taxes
- Sales taxes are one of the largest state revenue sources and secure many government projects. For the 46 states that have reported revenue, cumulative YoY declines were 15.8% and 27.8% in April and May, respectively. While these results are problematic, they indicate that consumption-based revenue has held up better than income tax revenue. The picture is expected to further improve provided the health outlook allows economic reopening to proceed.
- These figures have reinforced our confidence in the strength of our Sales Tax-backed holdings. Proprietary stress testing has estimated that these credits can collectively withstand a 40% revenue decline for an entire year while still being able to cover maximum annual debt service (MADS). Analysis of this nature supports our view that considerable value can be found in select Sales Tax-backed bonds supported by diverse and broad tax bases.
Municipal Bond Defaults
- Despite an uptick in municipal defaults, Appleton expects the rate to remain very low relative to the size of the market. As of June 2020, B of A/ML reported nearly $780 million of first-time debt service payment defaults, which still trails 2019 default levels by nearly $8 million; however, the total is expected to increase after July 1 payments are due.
- Municipal default rates have historically been far lower than corporates. Moody’s reported a 2018 five-year cumulative municipal default rate of 0.10% versus a corresponding corporate default rate of 6.6%.
- We expect municipal defaults to be concentrated in smaller issuers and heavily stressed sectors such as senior living, student housing, charter schools, and speculative project financing. Given our conservative, high quality credit approach, these are sectors we typically avoid.
- Appleton believes that all the credits we own will remain creditworthy. Our research team’s stress-testing has shown that our holdings are able to withstand a far more severe downturn than is projected. That analysis is also bolstered by municipal issuers’ sustained market access, strong investor demand, and Federal government support. Lastly, recent data suggests that the U.S. economy is beginning to recover, and dire estimates of municipal revenue losses may prove to be overly pessimistic.
1.Source: Urban Institute
2.Source: Urban Institute

Strategy Overview
Portfolio Positioning as of 6/30/20

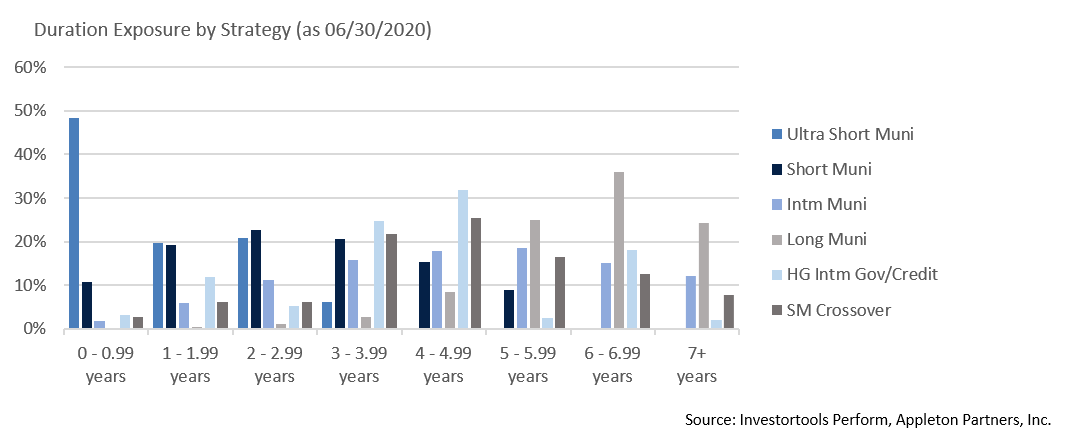
Duration Exposure by Strategy as of 6/30/20

Our Philosophy and Process
- Our objective is to preserve and grow your clients’ capital in a tax efficient manner.
- Dynamic active management and an emphasis on liquidity affords us the flexibility to react to changes in the credit, interest rate and yield curve environments.
- Dissecting the yield curve to target maturity exposure can help us capture value and capitalize on market inefficiencies as rate cycles change.
- Customized separate accounts are structured to meet your clients’ evolving tax, liquidity, risk tolerance and other unique needs.
- Intense credit research is applied within the liquid, high investment grade universe.
- Extensive fundamental, technical and economic analysis is utilized in making investment decisions.


