


Insights & Observations
Economic, Public Policy, and Fed Developments
- There seems to be a “Groundhog Day” element to writing economic commentary lately. At the start of June, we are still concerned about tariff uncertainty, as well as the scope of federal layoffs, and unless you look at the details, it is entirely possible to miss the fact that another month has passed.
- The US International Trade Court ruled on 5/28 that President Trump had no legal basis to assess tariffs using the International Emergency Economic Powers Act, and they would need to be reversed. Tariffs remain in place while the administration appeals; however, we see this as less a comment on the likelihood of a successful appeal than on simple logistics. It is easier to collect tariff revenue that will eventually be returned than to try to tariff imports well after they have arrived.
- President Trump has several other avenues available to apply tariffs, so we believe this decision prolongs rather than ends the trade war and will ultimately still be a negative for growth. We expect President Trump to be more aggressive in the use of other tariff mechanisms in the meantime, and he doubled steel and aluminum tariffs to 50% shortly after this decision. This decision also weakens the US’s negotiating position, and we see a reduced likelihood of any significant trade deals being reached until after the appeal. Interestingly, Treasury yields rose when news of the tariff decision broke and then fell when the courts announced they would be left in place during appeal. This suggests the market is more concerned with the ballooning US debt than the growth implications of restrictive tariff policy.
- The House passed the “Big Beautiful Bill Act” on 5/22, sending a Tax Cuts and Jobs Act extension and debt ceiling increase into reconciliation. There are significant differences between the House and Senate bill, including the size of tax cuts, so for now we believe specific provisions don’t matter nearly as much as the size of the contribution to the national debt. If the broad contours of the bills hold, it is likely to close the deficit by 0.1 – 0.2% from the current -6.8% of GDP, meaning the national debt will still increase, but slightly slower than before. The Congressional Budget Office’s estimate released on 6/4 puts the size of this increase at $2.4T over ten years. They also estimate $2.9T in tariff-related revenue outside the budget, so it’s at least possible that tariffs – if they were to remain in place at April levels, which is uncertain – could offset most of the additional cost of the extension. If so, the annual deficit would likely be even smaller, though still negative, perhaps in the -5% range. This is still not a great trajectory and Treasury yields rose as its passage became more likely.
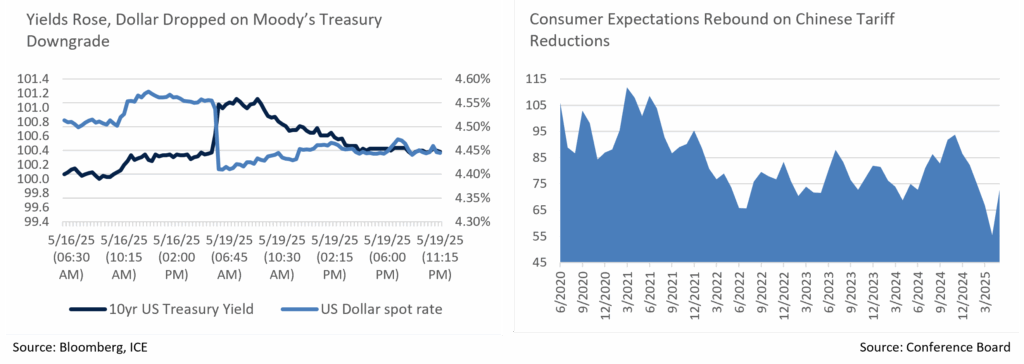
- Moody’s downgrade of the US Treasury to Aa1/Stable on 5/16 was well digested by the markets; yields rose, and the dollar fell on the news, but the moves were not large and had partially reversed by Monday’s trading. This market reaction was quite different than earlier S&P and Fitch downgrades when the dollar rose and yields fell in a flight to quality. A sovereign default is improbable for any entity that issues debt entirely in its own currency, and the downgrade reflects the possibility of the US eventually monetizing its own debt, rather than defaulting. The restrained nature of the market move suggests a very low probability of this occurring, and we remain very confident in the Treasury’s creditworthiness.
- The Conference Board’s Consumer Sentiment indicator rebounded sharply in May, from an abysmal 54.4 to a still soft 72.8. Survey responses suggested the temporary reduction in tariffs on Chinese imports as a primary driver. While on one hand these are “low information” respondents who do not carefully follow financial markets, on the other that makes them representative of most US consumers, and improvements in sentiment may support spending and keep growth from softening as much as we fear it could.
Sources: FHN Financial, Conference Board, Congressional Budget Office, Moody’s
From the Trading Desk
Municipal Markets
- The municipal curve bull steepened during May, with the front end lower in yield by 10-15 bps and the 5-year curve dropping 18 bps. The 7-year portion of the curve saw yields fall 13 bps, while 10-years moved only marginally by 1 bp. Maturities over 10 years faced selling pressure that caused yields to rise by up to 14 bps for 30-year maturities. The 2s-30s curve slope steepened by 29 bps on the month, with 12 bps of steepening coming just from the 10 to 15-year part of the curve alone.
- Treasury yields remained volatile with upward pressure and municipals closed May richer on a relative basis. The most pronounced effects of this move impacted the front end through the belly of the curve, specifically 2 to 7-years for municipals, where ratios tightened by 4-7%. The effect was more muted with longer maturities. The 5, 10, and 30-year AAA Muni/UST ratios ended the month at 71%, 75%, and 91%, respectively. The 30-year ratio is in line with the 5-year average, and although 5 and 10-year ratios remain tighter than their historic average, today’s levels are up from prior lows, and we feel they offer an attractive entry point given absolute yields.
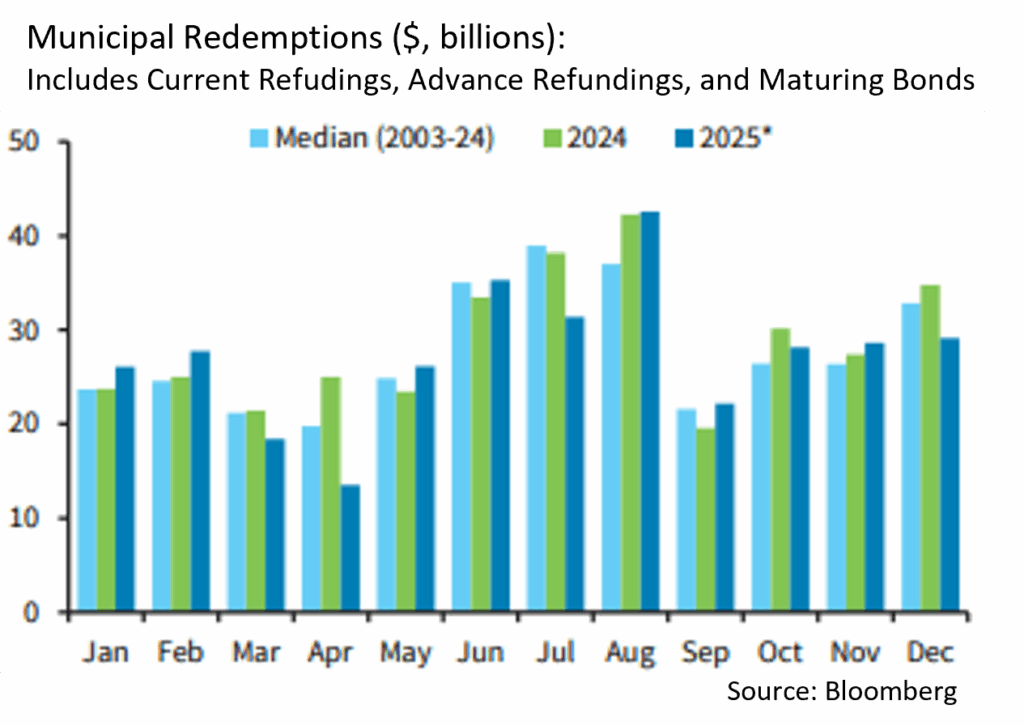
- May was marked by a robust primary calendar of $50B, maintaining a recent trend of high issuance. Per Barclays Research, May issuance was 6% higher than the same period last year and notably larger than the $32B average of the prior five years. May issuance brings the YTD total to $216B, an 11% increase over 2024. Municipal supply was absorbed by $3.1B of subscriptions into municipal ETFs and mutual funds, partially offsetting a surge in April redemptions. The biggest beneficiaries have been ETFs (+$7.8B YTD), while open-ended municipal mutual funds remain a laggard (-$1B YTD).
- The summer months typically see strong technicals for the muni market, as trends for the past few years have seen heightened redemptions in summer bolstering favorable supply/demand dynamics. We expect that trend to continue with CreditSights estimating redemptions for May coming in 21% higher than last year, and June, July, and August estimates totaling $149M.
Corporate Markets
- Investment Grade Corporate credit spreads have rebounded well from early April global trade-induced turbulence, tightening considerably later that month and in May. Option Adjusted Spreads (OAS) on the Bloomberg US Corporate Bond Index began May at +106 bps, down 13 bps from a YTD high of +119 bps before tightening further to 88 bps by month’s end, a level not seen since late March. We expect credit spreads to remain in their current range for some time, although short-term volatility is anticipated as policy and economic news comes forth.
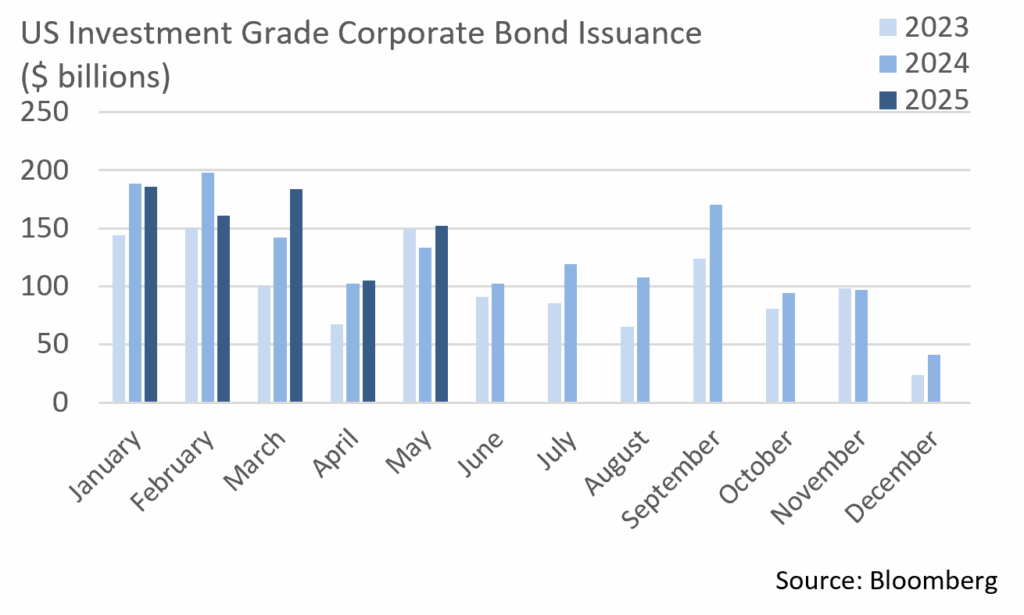
- Syndicate desks had an active month after a very slow April as issuers brought $152.5B of new debt to the markets. It was the busiest May since 2020 when $242B of new Investment Grade Corporate supply was issued. YTD issuance now stands at $788.5B, 3% above the same period of last year. The first week of June is off to a strong start and is on pace to meet expectations of $10B.
- Appetite for credit remains robust with high demand for longer dated credits. Market concessions have been limited and on par with the YTD average of only 3.5 bps. The health of risk appetite is anecdotally evidenced by certain deals enjoying negative concessions and several order books being 4x covered. Market technicals remain favorable, leaving issuers with ready access to the debt markets, and we expect corporations to take advantage over the second half of the year.
- US High Yield returns reached monthly levels not seen since July 2024 as worries eased in the aftermath of the 90-day tariff pause. The Federal Reserve also looks to be in a holding pattern for now and recession odds have once again begun to recede. All told, Bloomberg US Corporate High Yield Index yields fell from 7.90% to 7.46% in May, closing at a healthy 121 bps below its YTD high. This grind lower occurred despite pressure on Treasuries. Although we remain cautious on lower quality credit longer-term, high yield spread compression is an indication of improving economic sentiment and favorable overall market conditions for credit investors.
Sources: MMD, Bloomberg, Bond Buyer, CreditSights
Public Sector Watch
Bond Market Impact of Moody’s US Debt Downgrade
Bond Market Impact of Moody’s US Debt Downgrade
In our recently published piece, we shared our thoughts on Moody’s downgrade of the US Government’s credit rating from Aaa/negative to Aa1/stable, reflecting accelerating deficit growth and associated borrowing requirements, a fiscal situation exacerbated by recently elevated borrowing costs. Below is our credit team’s analysis on the impact of this downgrade on the municipal market.
Municipal Credit Dynamics Differ by Sector and Issuer
Moody’s action means that the US Government no longer enjoys a top credit rating from any of the major three agencies. The effect of this development on the Treasury and housing markets is difficult to predict, although we expect only modest impacts on the tax-exempt bond market.
While newsworthy, the US Government downgrade was not unexpected as Moody’s had changed their credit outlook to “negative” from “stable” in November 2023. At the time, only a handful of public finance issuers were also placed on “negative,” and Moody’s tempered their analysis by stating that “few public finance issuers are directly affected (by its then revision of the US outlook change to “negative”). The relatively minor credit impact would also be the case if US credit strength continues to decline and results in a one–notch downgrade.”
S&P was the first to downgrade US credit to AA+ way back in 2011, citing brinkmanship surrounding the debt ceiling. Importantly, S&P made clear distinctions that allow the agency to provide other US-based entities, including municipalities, with a higher rating than the sovereign debt (i.e., AAA). We expect this practice to continue and do not see Moody’s current rating action affecting S&P’s view of these credits. An example of language that S&P includes in its research reports is excerpted below:
“We rate Greenwich higher than the sovereign because we believe the town can maintain better credit characteristics than the US in a stress scenario, due to its predominantly locally derived revenue base and our view that pledged revenue supporting debt service on the bonds is a limited risk of negative sovereign intervention.” S&P Global Ratings, January 17, 2025.
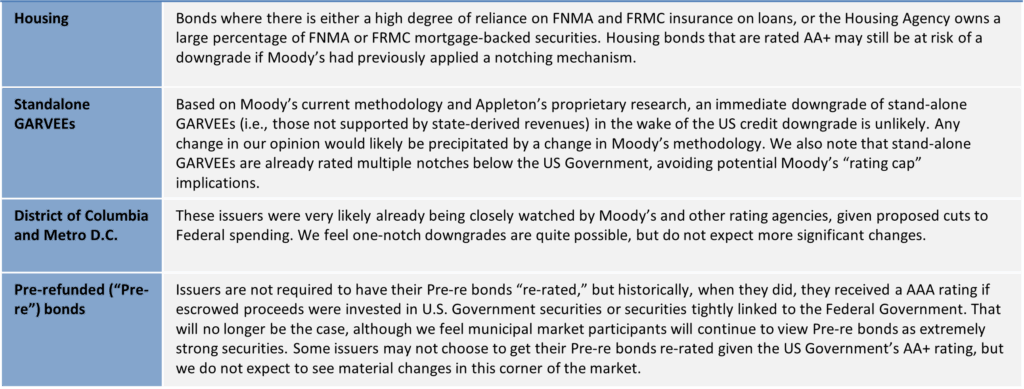
We expect Moody’s to afford itself similar leeway as S&P, thereby allowing public finance issuers to have a rating higher than the sovereign. Therefore, those public finance issuers that currently possess an Aaa rating from Moody’s are not necessarily at risk of being downgraded. However, there are entities that are directly linked to the US Government’s rating, and others that are linked to its underlying federal fiscal standing. Issuers of this nature could see negative rating actions from Moody’s.
Moody’s credit action shines a light on US fiscal conditions but should have a very modest and manageable impact on municipal issuers, and any rating changes will likely be limited to one or two-level downgrades. Most potentially impacted entities have maintained very strong credit profiles for an extended time, and we do not expect that to change. However, we continue to closely monitor municipal bond market trading and, while not expected, any meaningful impact could flow through to borrowers.
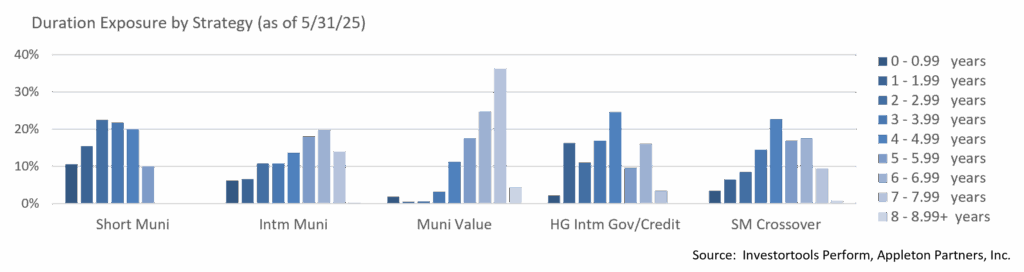
Composite Portfolio Positioning (As of 5/31/25)
Strategy Overview
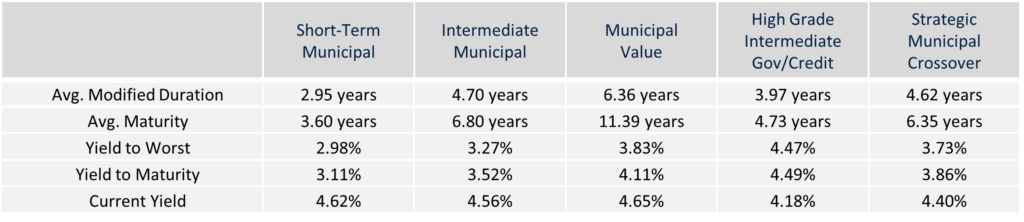
Duration Exposure (as of 5/31/25)
The composites used to calculate strategy characteristics (“Characteristic Composites”) are subsets of the account groups used to calculate strategy performance (“Performance Composites”). Characteristic Composites excludes any account in the Performance Composite where cash exceeds 10% of the portfolio. Therefore, Characteristic Composites can be a smaller subset of accounts than Performance Composites. Inclusion of the additional accounts in the Characteristic Composites would likely alter the characteristics displayed above by the excess cash. Please contact us if you would like to see characteristics of Appleton’s Performance Composites.
Yield is a moment-in-time statistical metric for fixed income securities that helps investors determine the value of a security, portfolio or composite. YTW and YTM assume that the investor holds the bond to its call date or maturity. YTW and YTM are two of many factors that ultimately determine the rate of return of a bond or portfolio. Other factors include re-investment rate, whether the bond is held to maturity and whether the entity actually makes the coupon payments. Current Yield strictly measures a bond or portfolio’s cash flows and has no bearing on performance. For calculation purposes, Appleton uses an assumed cash yield which is updated on the last day of each quarter to match that of the Schwab Municipal Money Fund.
This commentary reflects the opinions of Appleton Partners based on information that we believe to be reliable. It is intended for informational purposes only, and not to suggest any specific performance or results, nor should it be considered investment, financial, tax or other professional advice. It is not an offer or solicitation. Views regarding the economy, securities markets or other specialized areas, like all predictors of future events, cannot be guaranteed to be accurate and may result in economic loss to the investor. While the Adviser believes the outside data sources cited to be credible, it has not independently verified the correctness of any of their inputs or calculations and, therefore, does not warranty the accuracy of any third-party sources or information. Any securities identified were selected for illustrative purposes only, as a vehicle for demonstrating investment analysis and decision making. Investment process, strategies, philosophies, allocations, performance composition, target characteristics and other parameters are current as of the date indicated and are subject to change without prior notice. Not all products listed are available on every platform and certain strategies may not be available to all investors. Financial professionals should contact their home offices. Registration with the SEC should not be construed as an endorsement or an indicator of investment skill acumen or experience. Investments and insurance products are not FDIC or any other government agency insured, are not bank guaranteed, and may lose value.