


Insights and Observations
Economic, Public Policy, and Fed Developments
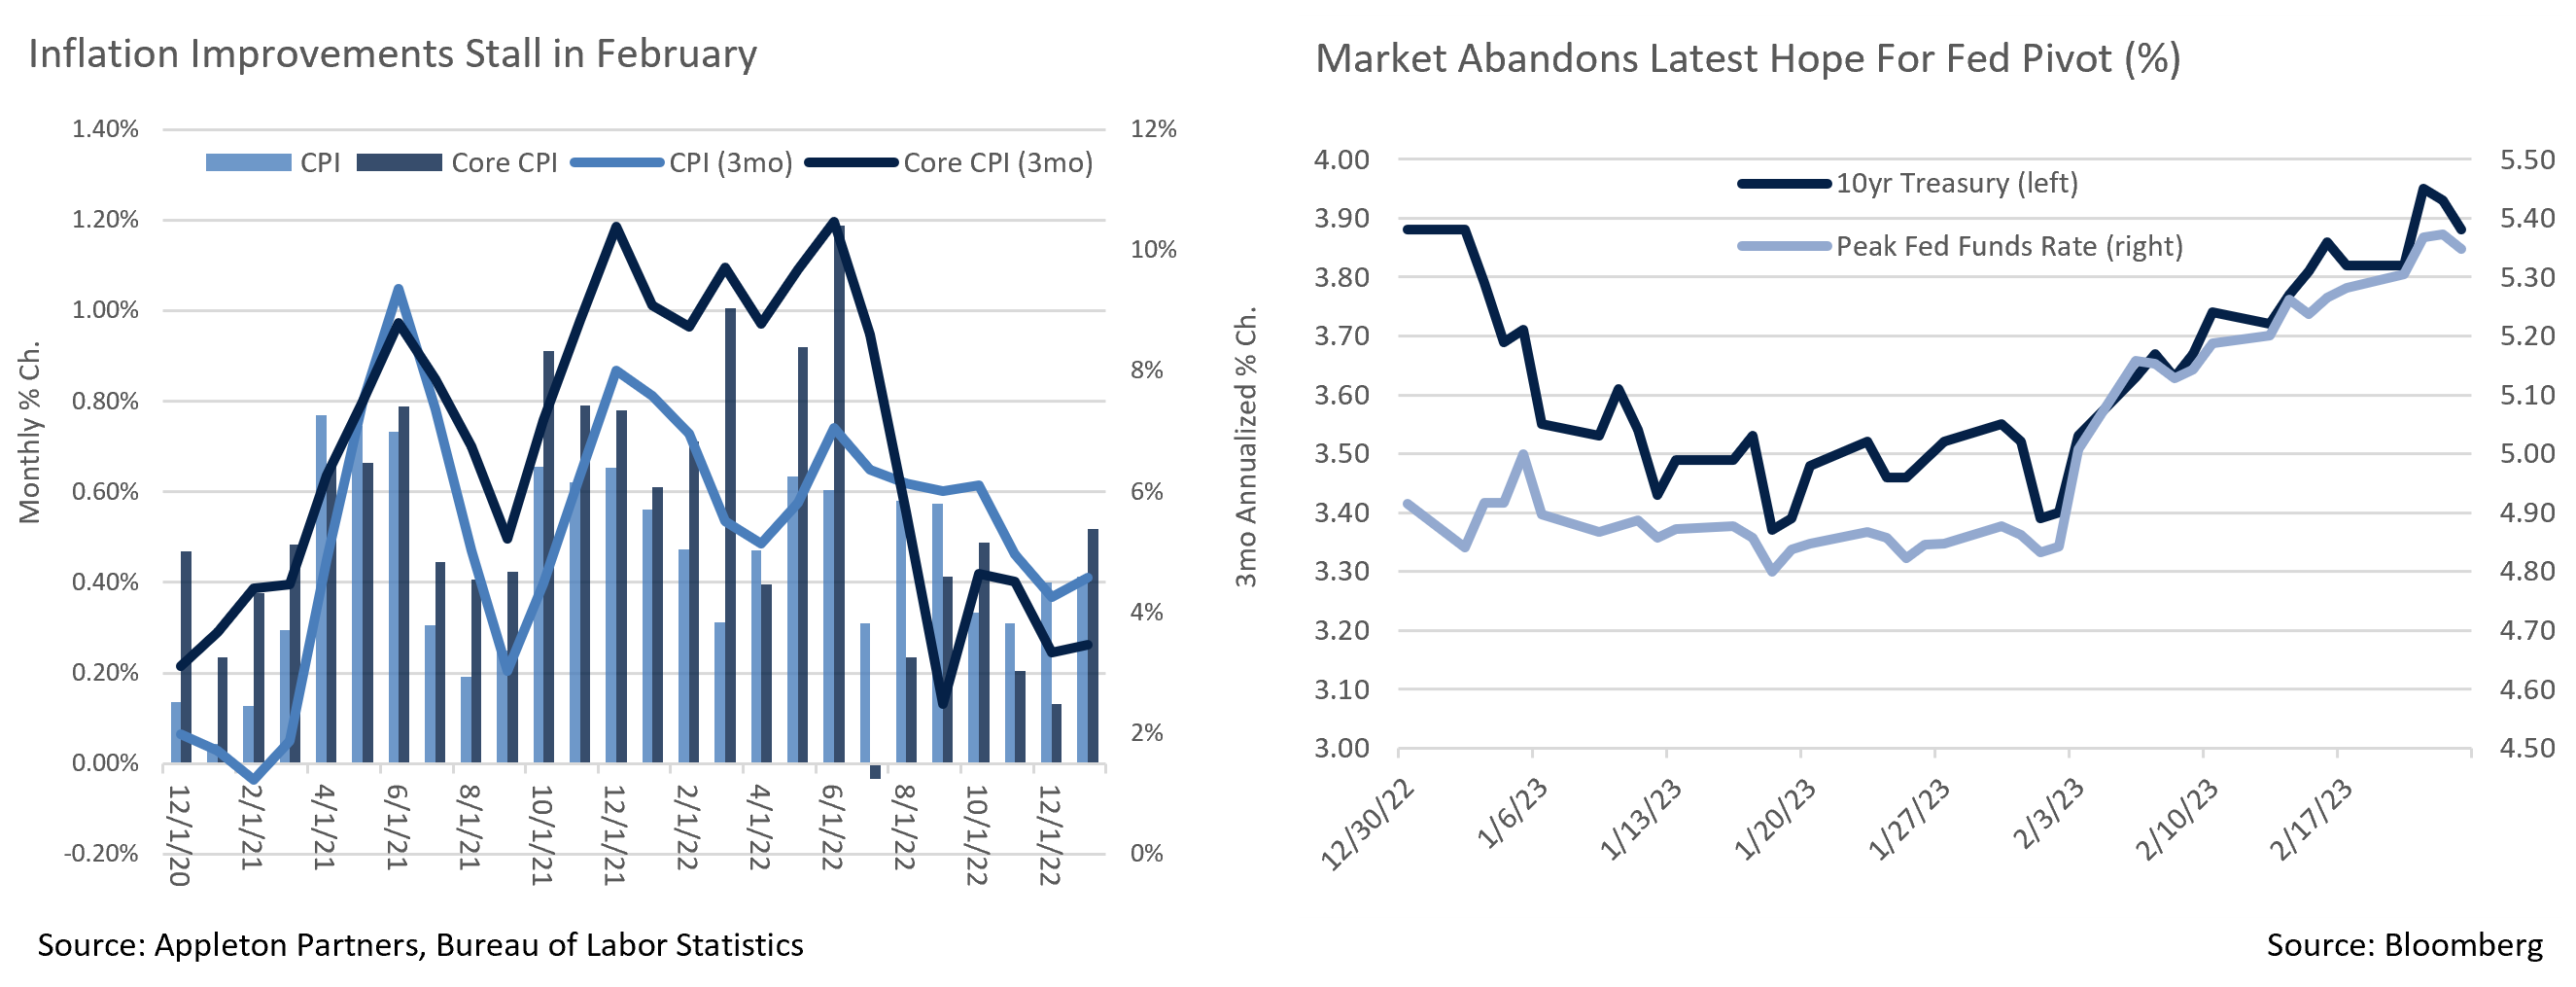
- The “immaculate deflation” narrative ended abruptly at the beginning of February after a series of data points dashed hopes for an early end to the Federal Reserve’s hiking cycle. An unexpectedly strong jobs report followed by hot CPI and PPI prints threw cold water on the markets and led to a rapid repricing of interest rate expectations.
- The Consumer Price Index technically only met expectations, but with a monthly headline number of +0.5% and core at +0.4%, this was still a hot report. The YoY rate fell less than expected and both headline and core now reveal an accelerating trend. The Producer Price Index inflation reported an upside miss, with the +0.7% headline nearly doubling an expected +0.4%. Optimists pointed to a fall in the annualized rate, neglecting that this was due to even higher prior year rates dropping out of the trailing 12-month period. Bond yields rose in response and the futures market began pricing a terminal Fed Funds Rate of nearly 5.4%, one that lies above the Fed’s last projection of 5.1%. With the next Summary of Economic Projections due out in late March, the Fed’s projection is likely to meet or exceed current market expectations.
- Consumption data also surprised to the upside last month. The January retail sales report was expected to show a rebound of +2%, in part due to a cold December and warm January; the actual report came in much higher at +3%. Retail sales are heavily geared towards goods spending and an unexpectedly strong January reading suggests that late Q4 weakness may have been influenced by unseasonable weather and an earlier holiday season, and/or a delay rather than reduction in spending. On one hand, with the first GDP revision showing Q4 consumption even weaker and inventory buildup higher than initially estimated, strong consumer demand should allow Q1 growth to be better than feared; on the other, this is hardly welcome news to a Federal Reserve looking for inflation to fall.
- January’s PCE report offered evidence of a rebound in spending and an uptick in inflation, with expenditures rising +1.1% in real terms, and the PCE Deflator (the Fed’s preferred inflation gauge) surprising, with headline and core both +0.6%. The December headline number was revised from +0.1% to +0.2%, and core from +0.3% to +0.4%, figures that suggest inflation was slightly hotter than previously thought. Unlike CPI and PPI, these increases were large enough to trump base effects, and annual numbers both rose.
- Another reason we expect Fed policy to lean hawkish in the next few months came with the resignation of FOMC Vice Chair Lael Brainard after President Biden nominated her to head the National Economic Council. In her absence, Cleveland Fed President Loretta Mester will be a voting member until a nominee is confirmed. Mester is considered more hawkish than Brainard, and she (along with non-voting member James Bullard) have indicated that a 50bps hike in February would have been appropriate.
- Treasury yields exceeded 5% last month for the first time since the Great Financial Crisis when T-Bills maturing in late August (around the time Treasury expects to hit the debt ceiling) rose above this symbolic level. This maturity is trading at a modest premium to bills maturing immediately before and after, a pricing dynamic we feel suggests the market expects debt ceiling brinksmanship, but that a deal will eventually be reached.
From the Trading Desk
Municipal Markets
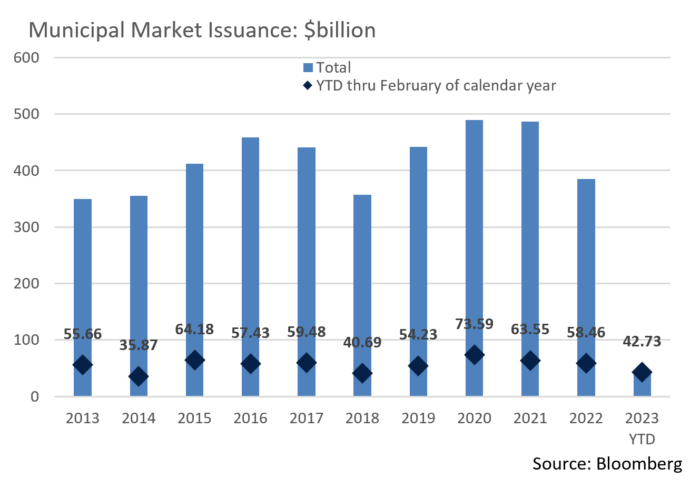
- The Municipal market is highly influenced by technical factors, and February brought declining primary market issuance, as new supply trailed 2022 levels by 40%. Coupled with demand supported by cash flow from January bond maturities, municipal ratios have declined to atypically low levels with the 10-year ratio resting at 66.4% as of March 3rd.
- The yield curve inversion deepened in February with 2-year AAAs at 3.17% compared to 10-year yields of only 2.64%. Given minimal issuance and an atypical curve structure, we recently made purchases on the shorter end (2024 & 2025) of our usual intermediate strategy buying range. The belly of the curve is relatively rich, and we are simultaneously seeking opportunities to complement these shorter positions by adding duration through selective buys longer on the curve. Given the persistence of inflationary pressures and the Fed’s determination to dampen it, we also believe interest rates will remain elevated for the time being and see March as an opportunity to build out the longer duration portion of our portfolios.
- March and April are normally characterized by fewer bond maturities than other times during the year. Reduced cash coming back into the market from maturities should alleviate some recent buying pressure, especially on the front end of the curve.
- The SIFMA Municipal Swap Index, a 7-day high grade index comprised of tax-exempt VRDN reset rates, began February with a yield of 1.87% before doubling on technical pressure over the course of a week to yield 3.74%. By mid-February, rates had bumped up slightly to 3.98% before receding at month’s end to 3.42%. We expect SIFMA yields to continue to decline and move closer to 65-70% of Fed Funds.
Corporate Bond Markets
- Investment grade credit spreads remained largely range bound in February. The Bloomberg US Corporate Bond Index began the month at a YTD low OAS of 115bps before ticking higher to 124bps at month’s end. A large move higher in US Treasury yields caused the overall monthly return on the Index to fall by -3.18%, although corporate spreads in isolation only lagged by -0.54% and have posted positive excess returns of +0.61% YTD. Longer duration underperformed intermediate bonds with 7 to 10-year issues being the best performing maturity range, a move supportive of our preference for intermediate duration. Our high-quality credit bias has also been rewarded as A rated credits have held in nicely.
- The primary market is still firing on all cylinders with a record $150.9 billion of new issuance recorded in February, comfortably outpacing the prior record of $113.0 billion (February 2021) and raising YTD issuance to $294.8 billion. Just over 40% of this year’s new supply has come from the financial sector and close to 60% has come to market with maturities inside of 10 years. New issue concession averages have increased of late after being significantly lower than 2021’s average. Recent deals were priced a modest 20-25 bps lower than initial price talk, a signal that demand for high quality taxable bonds largely remains intact. We expect primary market activity to be sustained, although issuers will be vigilant about the timing of when they come to market.
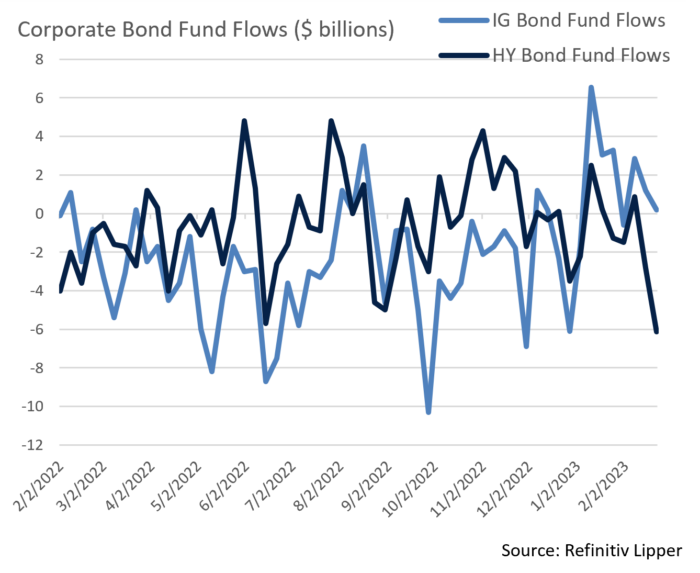
- IG fund flows were positive $3.6 billion on the month bringing the YTD total to $14.8 billion, another factor positively influencing spreads. High Yield flows have not faired as well with -$9.5 billion of outflows over the same time period and a massive -$6.1 billion leaving over the last week. For now, quality is a corporate risk factor in favor.
Public Sector Watch
Credit Comments
State Tax Collections:
- January tax collections are experiencing slow growth with 39 states reporting collections for the month exhibiting median YoY increases of just +1.1% according to Bank of America. This follows gains of +2.8% and +5.0% in November and December respectively, and while these indicators remain positive, nominal growth rates are exceeded by inflation.
- Weaker recent revenue trends contrast starkly from the rapid growth experienced in 2021 and much of 2022, although broadly speaking, we do not see this as a material negative. Slower increases were anticipated as tax revenue is a lagging indicator that was preceded by several economic drivers, including a weak stock market and state enacted tax cuts.
- Regional divergence exists within an overall steady decline in state tax collection growth rates, with the strongest performance seen in southern states which collectively posted January collections increases of +7.2% YoY vs. -38% for Far West states. Two states heavily influencing this data are California and Texas.
California Faces Fiscal Pressure
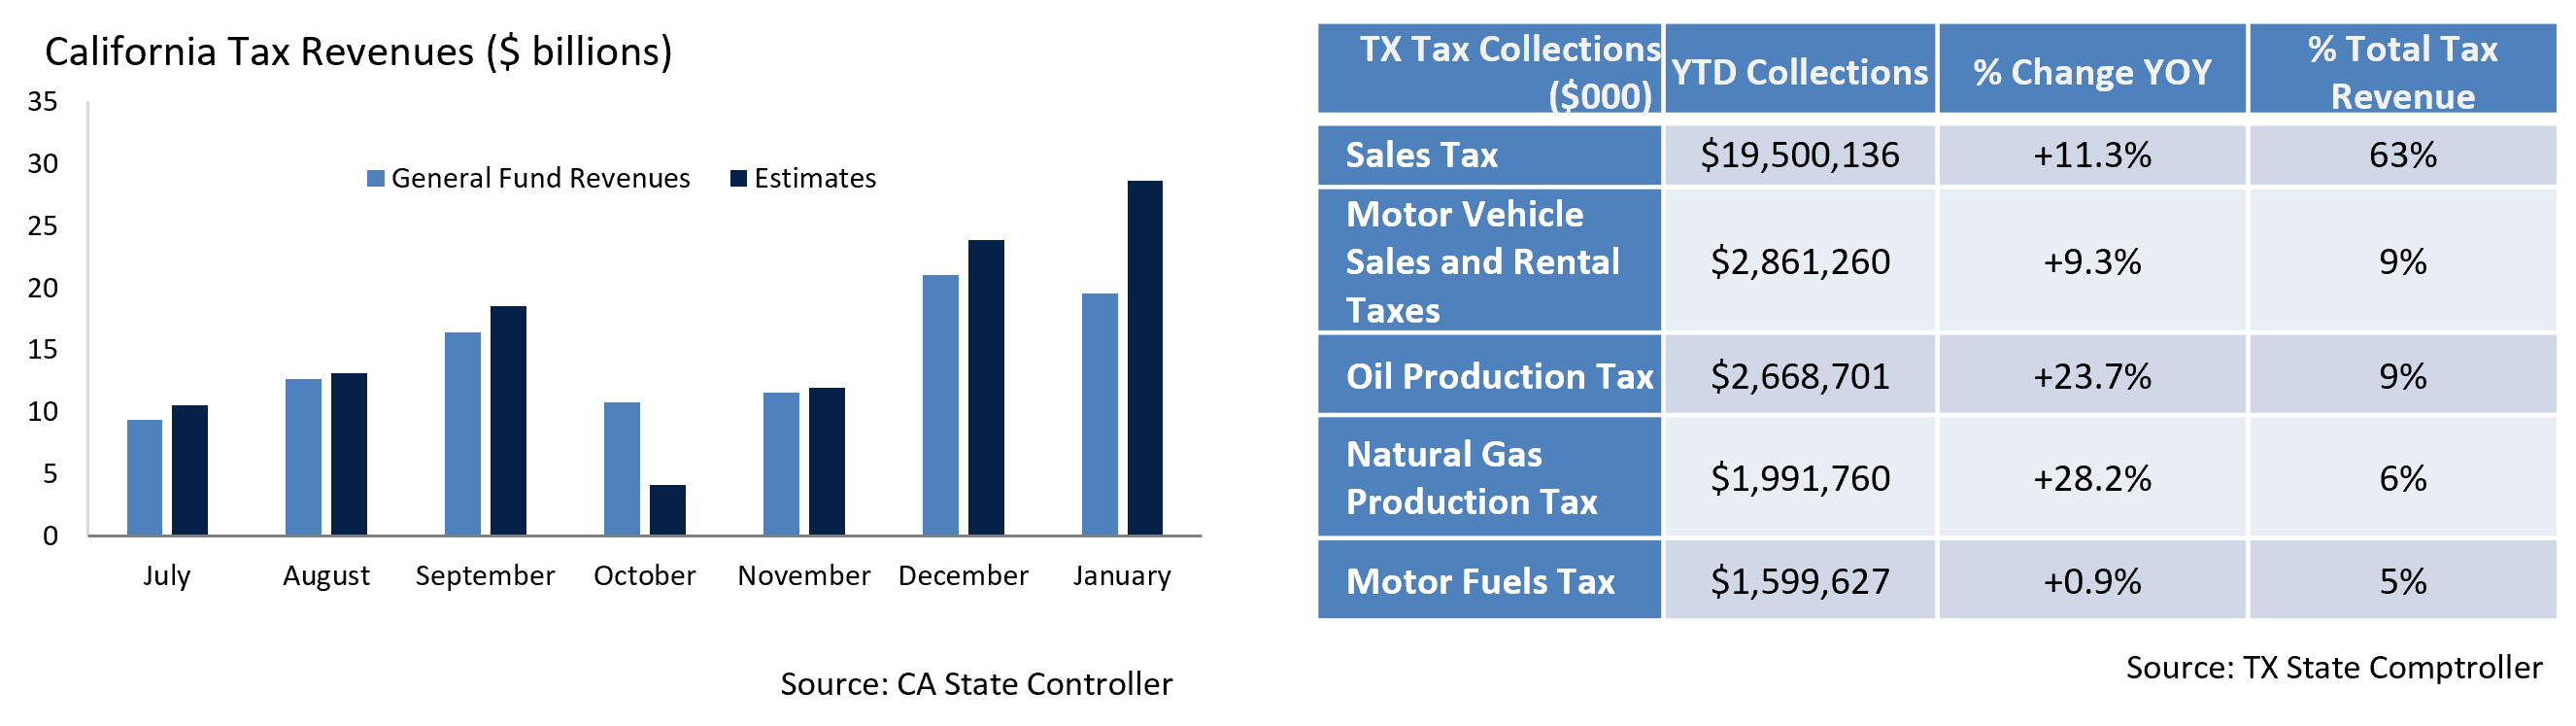
- California has experienced a more significant drop-off in collections than most other states, bringing in $101.2 billion of tax revenue over the first seven months of FY 2023 (as of January), down 18.5% YoY.
- California budget officers had expected a slowdown, although revenues are still underperforming forecast by 8.4%. This trend lags other states and is significantly impacted by a progressive tax structure, reliance on a relatively small population of wealthy taxpayers, and above average exposure to capital gains taxes.
- The Governor is predicting a $22.5 billion deficit for FY 2024. We believe a moderate deficit in FY 2023 (ended in June) will also need to be addressed and that FY 2024’s final budget shortfall will be larger than expected. Nonetheless, we are confident that California has the tools needed to weather a downturn without materially weakening its credit profile. Reserves are in excess of $30 billion, significant one-time spending can be curtailed, and improved budgetary mechanisms all provide flexibility to partially counteract revenue underperformance.
- State fiscal fundamentals are weakening although we do not currently anticipate significant credit quality deterioration or a need to make widespread changes in client portfolios. Nonetheless, subject to individual client circumstances, the current environment is leading us to selectively capitalize on better relative value opportunities.
Texas Growth Remains Robust
- By contrast, Texas’s tax revenue has continued to grow at a rapid pace with $28.9 billion raised over the first five months of FY 2023 through January, +13.7% YoY.
- Texas is projected to end the 2022-23 biennium with a record $32.7 billion surplus, not including $14 billion projected in the rainy-day fund. Strong growth is consistent across all tax sources. Notably, sales taxes increased 11.3% over the first five months of the year, outpacing growth rates of most other states.
- Preliminary budgets for the 2024-25 biennium forecast a record $188 billion of revenue vs. budgeted expenses of just over $130 billion. Expense growth is capped at +12.3%, with several mechanisms available to amend or bypass that rule, a likely outcome should actual revenue meet projections. Barring that, the 2024-25 biennium is expected to produce a record $50 billion surplus.
Most state tax revenue sources are heavily impacted by the economy which explains the overall slowdown of collections in recent months. Our Credit Research team is closely monitoring state revenue trendlines across the nation as they influence not only upcoming state budgets, but also have broader municipal market effects given the influence state funding has on many bond issuers’ revenue.
Strategy Overview
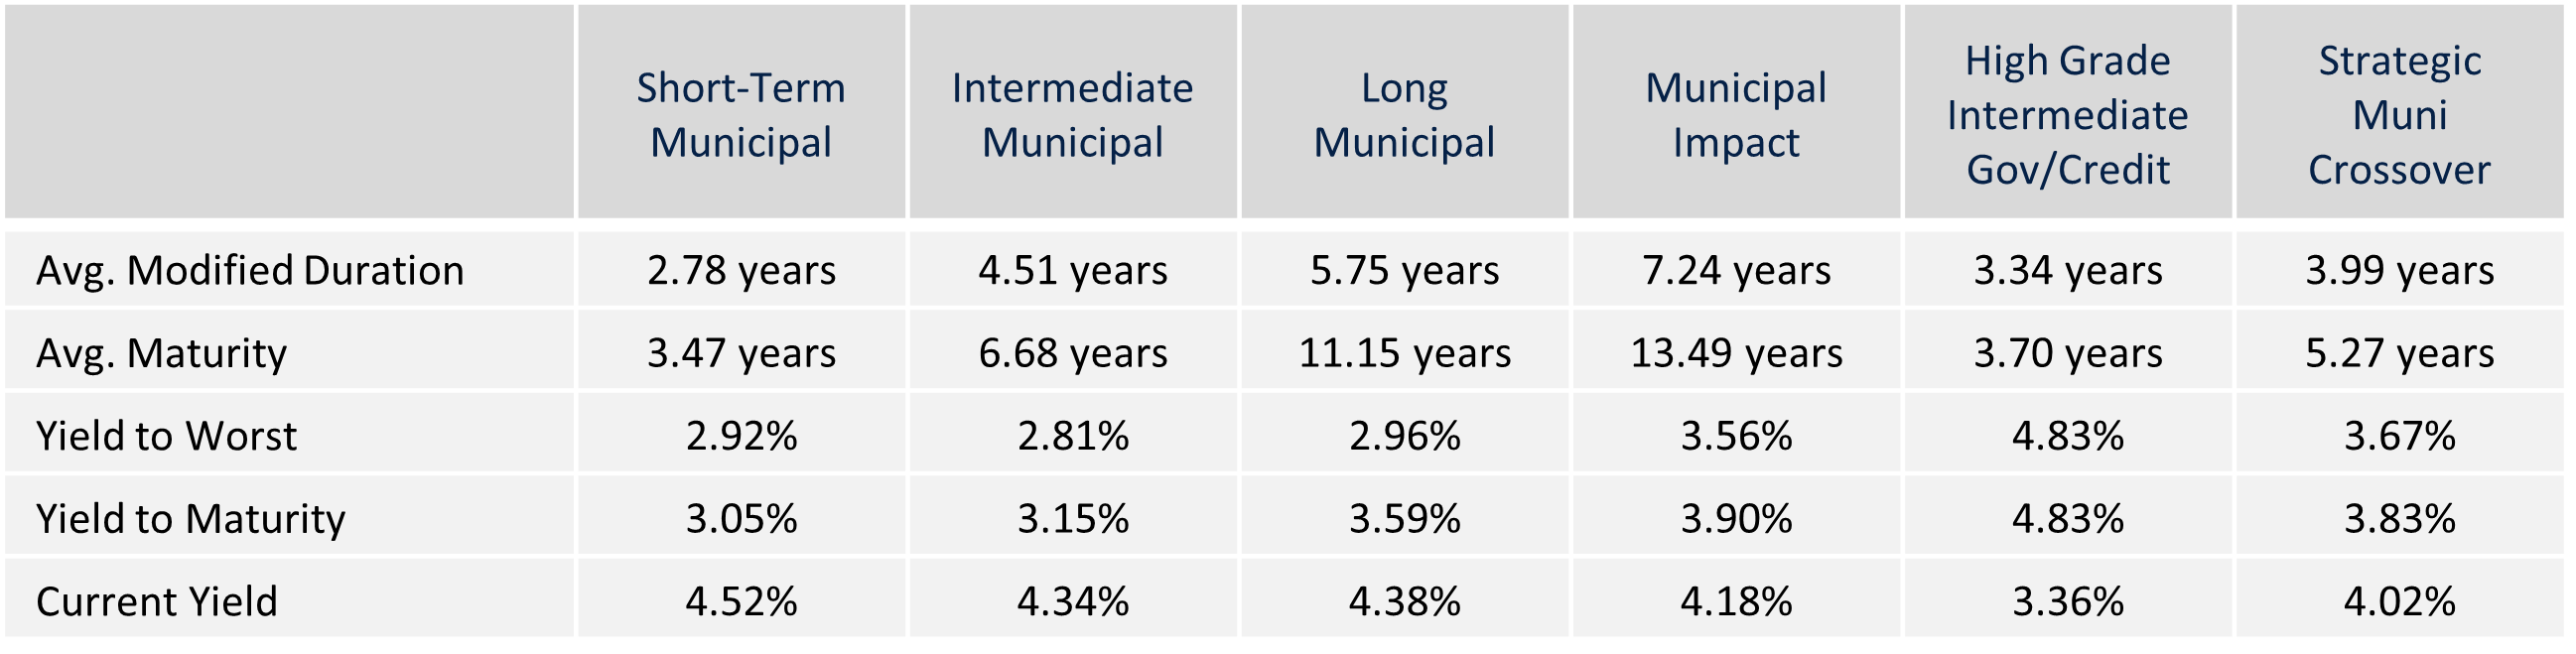
Composite Portfolio Positioning as of 2/28/2023
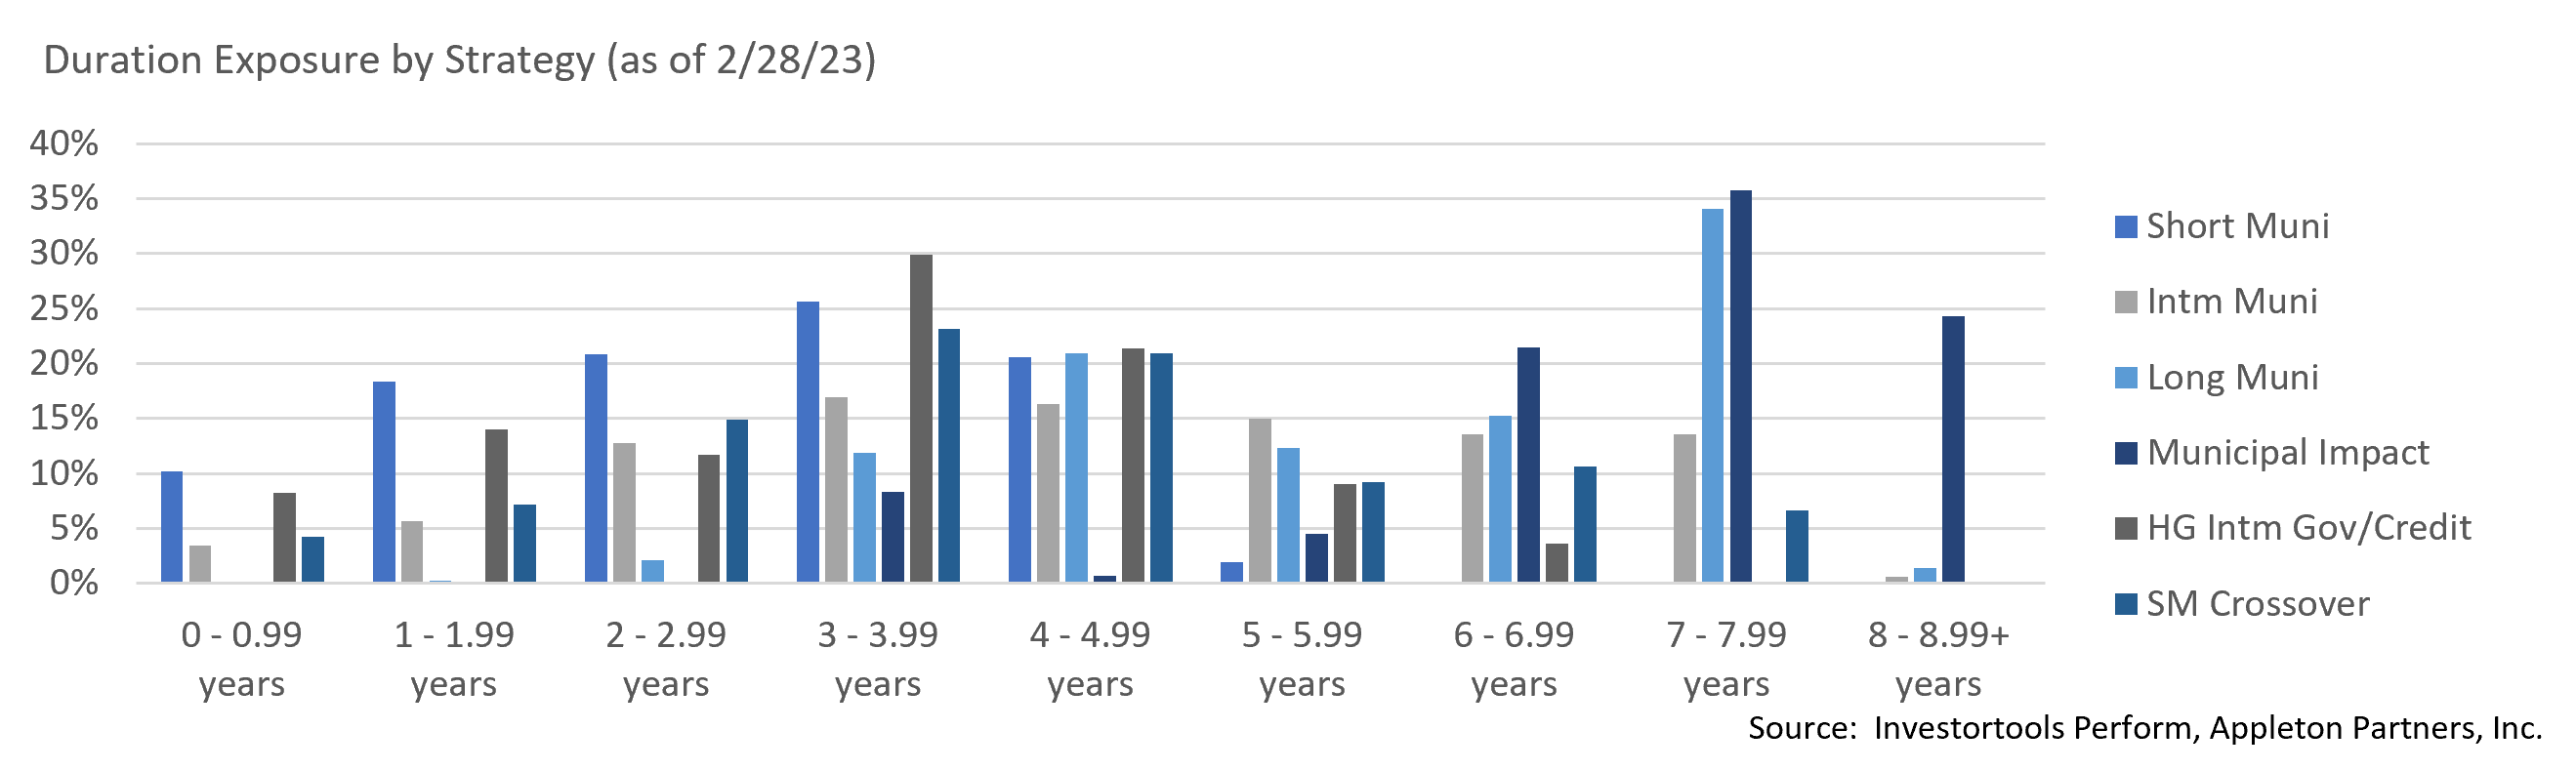
Duration Exposure as of 2/28/2023
The composites used to calculate strategy characteristics (“Characteristic Composites”) are subsets of the account groups used to calculate strategy performance (“Performance Composites”). Characteristic Composites excludes any account in the Performance Composite where cash exceeds 10% of the portfolio. Therefore, Characteristic Composites can be a smaller subset of accounts than Performance Composites. Inclusion of the additional accounts in the Characteristic Composites would likely alter the characteristics displayed above by the excess cash. Please contact us if you would like to see characteristics of Appleton’s Performance Composites.
Our Philosophy and Process
- Our objective is to preserve and grow your clients’ capital in a tax efficient manner.
- Dynamic active management and an emphasis on liquidity affords us the flexibility to react to changes in the credit, interest rate and yield curve environments.
- Dissecting the yield curve to target maturity exposure can help us capture value and capitalize on market inefficiencies as rate cycles change.
- Customized separate accounts are structured to meet your clients’ evolving tax, liquidity, risk tolerance and other unique needs.
- Intense credit research is applied within the liquid, high investment grade universe.
- Extensive fundamental, technical and economic analysis is utilized in making investment decisions.