


Insights and Observations
Economic, Public Policy, and Fed Developments
- February’s biggest story was a series of unexpectedly hot inflation reports sharply reducing market expectations for 2024 Fed rate cuts. Beneath the surface, the month was a Russian doll of nested contradictions, not the least of which being that while we welcome this repricing (the markets now closely align with our expectations for 2-3 cuts before year-end), fears of a reacceleration of inflation are probably misplaced, and certainly premature.
- First, despite the market reaction, none of the misses were especially large; Headline CPI was expected to have fallen a tenth from December and instead remained unchanged, while Core was expected to remain unchanged and instead increased a tenth. The pressure was mostly confined to one, admittedly large, component, owner’s equivalent rent (OER). The CPI surprise was neither broad nor sizable.
- Inflation reports were also hard to reconcile with slowing retail spending. Goods heavy retail sales contracted sharply, while the more services focused personal spending fell to a nearly flat rate. Ironically, we suggest looking through these spending releases due to probable weather impacts; construction materials showed the largest drop in the retail sales report, during a nationwide cold snap. Still, the fall in spending was real, if likely temporary, and it’s still hard to see inflation rising at a time when consumers aren’t spending.
- Seasonal factors may have also impacted the inflation readings. The Bureau of Labor Statistics noted an unexpected weight increase for “single family detached” housing being responsible for the jump in OER, which is a one-time impact. And, one of the reasons that year-over-year data still fell despite upside surprises was that the prior year report had also been unexpectedly hot, before the index settled back down the subsequent month. COVID-19 and unpredictable weather have made seasonal adjustments somewhat unstable, and January has been a noisy point in the calendar for a while now.
- Markets calmed with a warm but in-line PCE inflation number (though we note that CPI and PPI had likely shifted the consensus upwards); the fall in inflation was always expected to be lumpy, and without a few more data points there’s no reason to think the Fed’s inflation campaign has gone off track. One point does not make a trend.
- The second Q4 GDP estimate offered the market some good news – while the headline number fell a tenth to +3.2%, this was primarily driven by a fall in inventories, and consumer spending actually improved from +2.8% to +3.0% in the latest revision. This should be positive for Q1 growth as retailers will need to rebuild inventories – the Atlanta Fed GDPNow Q1 estimation is currently +2.5%, a deceleration from Q4 and early estimations, but still solid.
- Another encouraging development came in the House, where nearly half of the GOP joined with their Democratic colleagues to pass a “clean” continuing resolution (CR), averting a partial government shutdown for at least another week. While a week is not normally something to celebrate, this was a functional sign after the coup that brought down ex-Speaker McCarthy over a previous clean CR. Republican hardliners appear to have become more pragmatic about the concessions they can extract with their narrow House majority, which shrunk to three after George Santos’ former seat went Democratic in a January special election. While narrow majorities and a sharply divided caucus are a recipe for unpredictability, this is grounds for cautious optimism.

From the Trading Desk
Municipal Markets
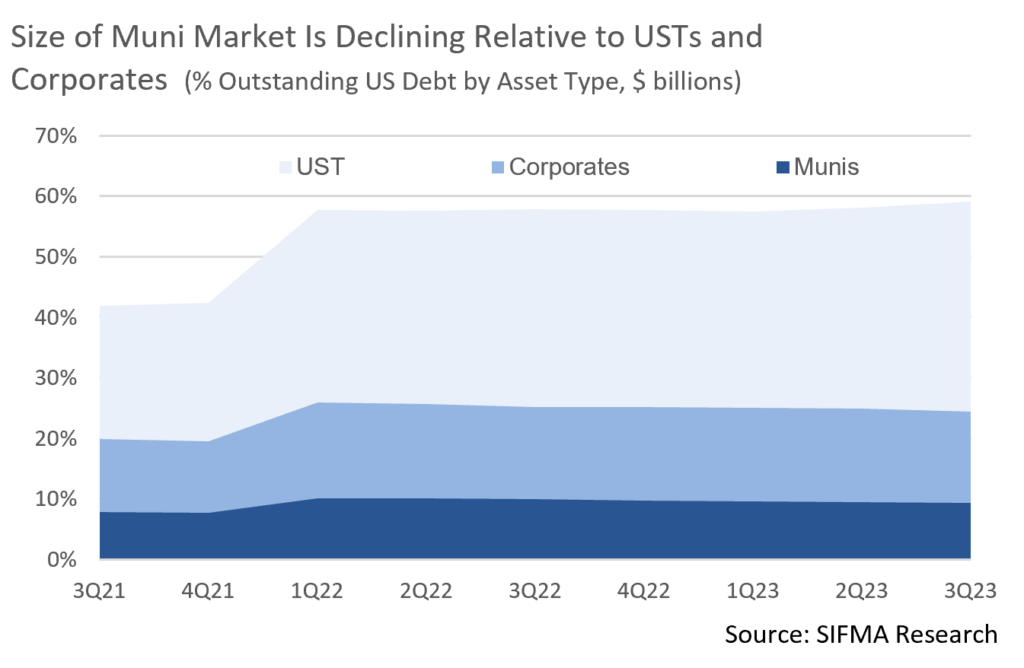
- Valuation remains stretched by historical standards with the 10-year AAA Muni/UST ratio ending the month at 58%, as compared to a 52-week average of 66% and 5-year averages of 80%. Looking more closely at these atypical ratios reveals several underlying factors that point to the likelihood of sustained favorable tax-exempt technicals.
- The size of the municipal market has only increased 4% since 2015 vs. 81% for USTs and 36% for corporates. Meanwhile, demand for municipals has been bolstered a combination of factors: an aging population and retirees seeking tax-exempt income, US wealth concentration among the top wealth cohorts, and the passage of a $10,000 cap on SALT deductions once enjoyed in high tax and highly populated states. All of these have fueled demand, while sluggish supply has been impacted by the elimination of advanced refundings.
- Municipals (Bloomberg Municipal Bond Index) were able to buck a negative seasonal February trend by producing positive returns (+0.13%) on the month. Tax-exempts outperformed USTs in February, a reversal from the prior month. Supply and demand was the story with the former falling $29 billion short of January, while demand remained strong.
- We anticipate new offerings to pick up with 30-day visible supply of $9.96 billion. March is also typically an active month for Local Government bond sales. At the same time, reinvestment cash coming back to investors is projected to be $10 billion lower in March than in February. Increased supply and less cash chasing new deals may create better value for investors in the weeks ahead should tax-exempt issuers need to come to market with higher yields to attract buyers.
Corporate Bond Markets
- For the second straight month the Investment Grade Corporate primary market delivered record setting issuance. A four-day, $53.1 billion frenzy to close out February brought the monthly tally to $198 billion, smashing the previous record of $150.9 billion set over the same period of 2023. M&A funding was a principal catalyst with non-cyclicals accounting for 36% of new bond supply, followed by Financials at 27%.
- While demand for debt remains robust, investor fatigue began to be evident as the month closed. New issue concessions rose from roughly 3 bps to nearly 15 bps over the last week in February and books were not as highly covered. March tends to be a seasonally strong issuance period, averaging $180 billion in recent years, although this year we expect lingering investor fatigue to limit new IG supply to about $130 billion. This should support favorable technicals given a backdrop of strong demand.
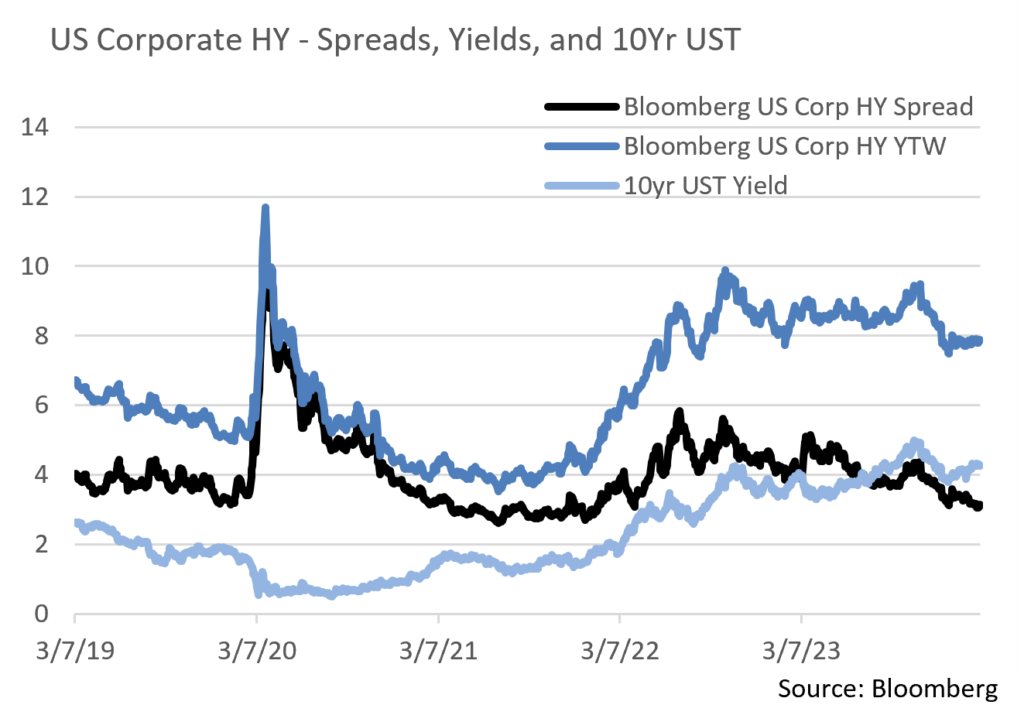
- Credit spreads are still close to two-year tights with risk appetite intact. The spread on the Markit IG 5-year CDX (credit default swap) Index dropped to a YTD low of 50.9 on 2/22 after hitting a high of 60.6 to open 2024. For perspective, the average over the past 12 months was 76.4 with a high of 91.8 reached on 3/13. On an OAS basis, spreads widened at the end of February yet are still well below average and close to 2-year lows. We feel spreads will remain range bound as demand for yield outweighs the potential impact of Fed Funds rate reductions.
- High yield sentiment is also positive given a more upbeat macroeconomic outlook. Spreads are historically tight, yet yields are still sufficient to attract risk-taking investors. Month-ending spreads of 305bps are the lowest since 4/4/22, the major distinction being that 10Yr USTs were 2.40% at that time vs. 4.25% as of 2/29/24.
- A similar supply surge has characterized the high yield markets with February delivering $27 billion of issuance, pushing the YTD total to $58 billion. This represents a 71% increase over the last 12 months, another indication of healthy market conditions.
Public Sector Watch
Pension Improvements Are Evident
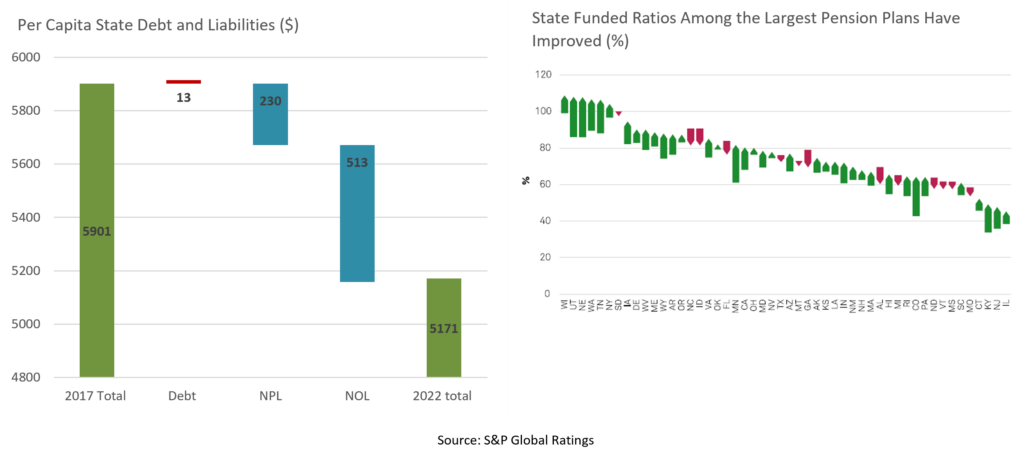
- S&P recently released a study on pension fund credit standings over a five-year period from 2017 through 2022 that illustrates the extent to which municipalities have effectively managed plan funding and liabilities.
- S&P reported that total per capita US state debt and other liabilities decreased 12% to $5,171 from $5,901. This aggregate decline was largely due to a 25% drop in net other post-employment benefits and a 10% decrease in net pension liability.
- New Jersey and Kentucky have long been burdened by high pension liabilities due to years of underfunding. Both states have seen notable reductions in their total liabilities and have made pension contributions above their actuarially determined contribution requirements in recent years. Nonetheless, their respective per capita debt and liabilities remain markedly higher than average at more than $10,000. By contrast, 36 states have per capita liabilities below $5,000. Appleton approves Kentucky’s Certificate of Participation debt (COPs) but does not approve New Jersey GOs for Intermediate Municipal accounts.
- U.S pension funding ratios have also improved in recent years as most states demonstrated stronger commitments to meeting their pension costs. S&P reported that the largest US statewide pension plan (presumably CALPERS) increased their coverage level to 75% in 2022 from 70% in 2017.
- Utah boasted the largest pension funded ratio gains, +19.3%, followed by Nebraska and Colorado at +19.2% and +18.7%, respectively. By contrast, Georgia saw the largest drop in pension ratio changes at -6.9%, followed by Alabama (-6.6%) and North Carolina (-6.5%).
- While the majority of states have become more conservative with their pension estimates, only just over half contributed at or above the S&P minimum funding progress (MFP) levels in 2022. However, this is still a considerable increase over the paltry 8 states that contributed at MFP levels in 2017.
- Strong investment performance offered a tailwind as 2022 pension assets were measured during the market surge of 2021. However, progress is also attributed to more conservative estimates and greater funding discipline. For example, Minnesota’s contributions increased to 86% of MFP in 2022 from just 36% in 2017 primarily due to a law passed in 2018 that adjusted plan assumptions, reduced COLAs, and increased employer and employee contributions. In Oregon, contributions increased to 145% of MFP in 2022 from 42% in 2017. A 2019 law redirected contributions from high earners from a supplemental defined contribution account to fund the defined benefit trust and implemented other risk-sharing measures.
- Although these are all positive signs, state pension officials will need to remain diligent as risks lie ahead. An aging population with more people reaching retirement age paired with slowing new hiring has produced declining active worker-to-beneficiary ratios over recent years.
- Our Credit Research team favors municipalities that are conservative with their pension and liability budgets. We carefully evaluate state liabilities and consider how they relate to overall fiscal health when preparing credit reviews.
Strategy Overview
Composite Portfolio Positioning as of 2/29/2024
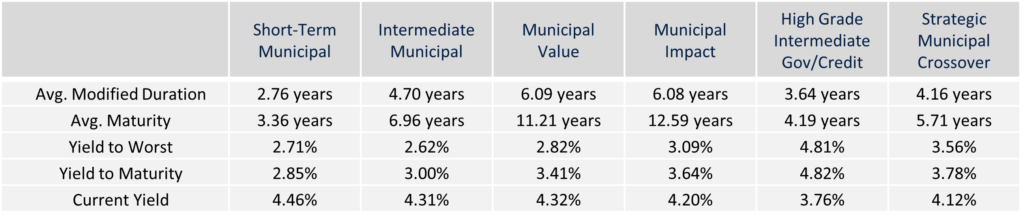
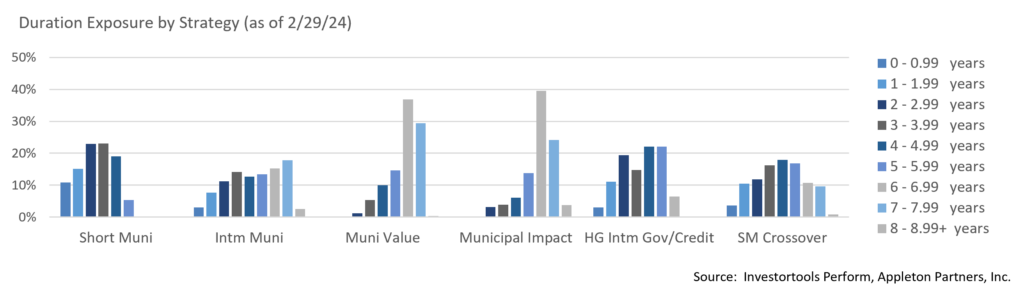
Duration Exposure as of 2/29/2024
The composites used to calculate strategy characteristics (“Characteristic Composites”) are subsets of the account groups used to calculate strategy performance (“Performance Composites”). Characteristic Composites excludes any account in the Performance Composite where cash exceeds 10% of the portfolio. Therefore, Characteristic Composites can be a smaller subset of accounts than Performance Composites. Inclusion of the additional accounts in the Characteristic Composites would likely alter the characteristics displayed above by the excess cash. Please contact us if you would like to see characteristics of Appleton’s Performance Composites.
Yield is a moment-in-time statistical metric for fixed income securities that helps investors determine the value of a security, portfolio or composite. YTW and YTM assume that the investor holds the bond to its call date or maturity. YTW and YTM are two of many factors that ultimately determine the rate of return of a bond or portfolio. Other factors include re-investment rate, whether the bond is held to maturity and whether the entity actually makes the coupon payments. Current Yield strictly measures a bond or portfolio’s cash flows and has no bearing on performance.
Our Philosophy and Process
- Our objective is to preserve and grow your clients’ capital in a tax efficient manner.
- Dynamic active management and an emphasis on liquidity affords us the flexibility to react to changes in the credit, interest rate and yield curve environments.
- Dissecting the yield curve to target maturity exposure can help us capture value and capitalize on market inefficiencies as rate cycles change.
- Customized separate accounts are structured to meet your clients’ evolving tax, liquidity, risk tolerance and other unique needs.
- Intense credit research is applied within the liquid, high investment grade universe.
- Extensive fundamental, technical and economic analysis is utilized in making investment decisions.
This commentary reflects the opinions of Appleton Partners based on information that we believe to be reliable. It is intended for informational purposes only, and not to suggest any specific performance or results, nor should it be considered investment, financial, tax or other professional advice. It is not an offer or solicitation. Views regarding the economy, securities markets or other specialized areas, like all predictors of future events, cannot be guaranteed to be accurate and may result in economic loss to the investor. While the Adviser believes the outside data sources cited to be credible, it has not independently verified the correctness of any of their inputs or calculations and, therefore, does not warranty the accuracy of any third-party sources or information. Specific securities identified and described may or may not be held in portfolios managed by the Adviser and do not represent all of the securities purchased, sold, or recommended for advisory clients. The reader should not assume that investments in the securities identified and discussed are, were or will be profitable. Any securities identified were selected for illustrative purposes only, as a vehicle for demonstrating investment analysis and decision making. Investment process, strategies, philosophies, allocations, performance composition, target characteristics and other parameters are current as of the date indicated and are subject to change without prior notice. Registration with the SEC should not be construed as an endorsement or an indicator of investment skill acumen or experience. Investments in securities are not insured, protected or guaranteed and may result in loss of income and/or principal.