


Insights & Observations
Economic, Public Policy, and Fed Developments
- The whipsawing of President Trump’s trade war that intensified on April 2nd will have many unintended consequences. One will be that incoming economic data will be extremely hard to interpret for at least the next several months. Before discussing specific releases, we’d like to pause and think about the various ways we expect data to be distorted.
- First, the occurrence of tariff “front-running,” both at the importer and consumer level, is well documented. The amount that ends up in retail inventories versus in purchasers’ homes has implications for how long it takes for tariffs to fully impact prices. And whether consumers can afford to keep spending as prices rise will impact retailer behavior and help dictate how “sticky” those price increases will be. The extent to which US supply chains can stretch and compress is likely to “flatten the curve” of tariff inflation and demand effects, making it hard to get a clear picture in real-time.
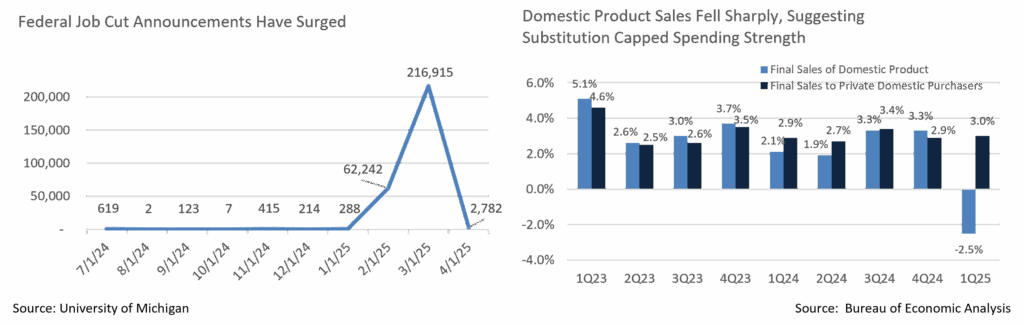
- This was evident in the Q1 GDP report, as growth contracted for the first time since 2022, with the economy shrinking at a rate of -0.3%. Beneath the surface, the picture was more complicated. A massive 50% increase in imports led to net trade detracting from growth, but that was partially offset by inventory buildup. Trade is easy to measure, inventories harder, so this first estimate is likely to be revised. An unwinding of the imports surge in Q2’s GDP may boost that quarter, but this should be looked through in both quarters.
- Underlying demand remains solid, with final sales to private domestic purchasers growing at +3.0%, although a 2.5% decline in purchases of domestic goods suggests that there was significant substitution as consumers stockpiled imports, and that their capacity to spend was likely nearing its peak. Personal consumption data implies this as well. After several months of positive savings growth, consumer spending growth exceeded income growth in March, supporting what was likely temporarily high spending. Muted inflation in March helped both CPI and PCE, but these releases are backward-looking and were largely overlooked by a market focused on tariffs.
- An encouraging note came in the March retail sales data with a rebound in spending on dining out. January and February saw sharp drops, potentially as worried consumers pulled back, although this occurred during a series of nationwide cold snaps. March’s rebound still leaves YTD restaurant spending running slightly below last year’s rate, suggesting a degree of pullback, but it now looks like weather was the bigger cause of weakness.
- While we remain concerned about the impact of DOGE-initiated layoffs, we have not yet seen them in any meaningful way in the employment results. April was strong, but with the downward prior revisions, it should be considered in line. The February and March Challenger reports indicate that a combined 280k government layoffs are in the pipeline that have not yet become unemployment claims. With a common rubric being that each federal layoff leads to two federal contractor layoffs, this is very close to the level where a +0.5% unemployment rate increase becomes a risk. This would strain the ability of US households to spend, just as tariff-related price increases begin to flow through to consumers.
- We also expect the Fed to be on hold near term. As we expect the initial wave of tariff inflation to take more than a month or two to play out, the calendar of economic releases is unlikely to give the Fed enough data to have confidence cutting rates until July at the earliest, at which point they will have inflation releases through June. More likely, it will take until September for the tariff inflation wave to begin to unwind. With the current 90-day hold on reciprocal tariffs, the more likely outcome is that it just further extends the wave. While the short-term effects here were positive, this delay is not especially good news; we still believe continued uncertainty is itself one of the biggest risks the market faces.
Sources: Bureau of Economic Analysis, Bureau of Labor Statistics, US Census Bureau, Challenger, Grey, & Christmas, Inc., Bloomberg
From the Trading Desk
Municipal Markets
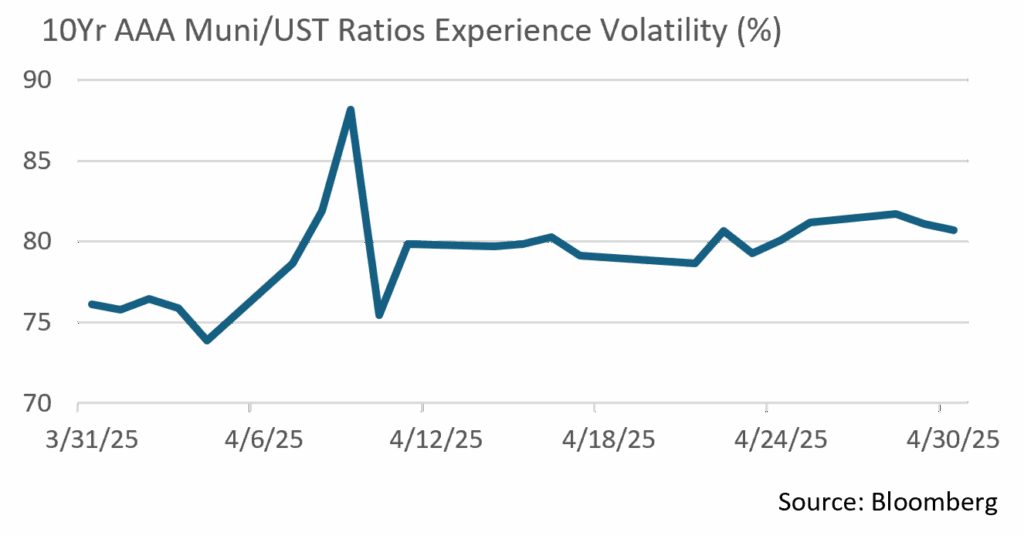
- The municipal curve bear flattened in April, with the front end closing the month higher in yield by 20-28bps, and 5 to 30-year maturities seeing more moderate moves as yields rose 8 to 14bps. However, the end-of-month net yield changes are a snapshot that does not capture the full picture of intra-month performance. Specifically, municipal yields exhibited near record volatility in April, spiking as much as 98bps through the first half of the month. This was largely due to macro factors driving UST rates higher, along with weak seasonal dynamics characterized by high supply, tax-related selling, and fund redemptions.
- In an environment of sustained Treasury volatility, municipals closed the month slightly cheaper than USTs over maturities of 7 years and longer, while the front end cheapened more dramatically. The 10-year AAA Muni/UST ratio ended at approximately 80%, a level that offers investors a higher relative value than has been the case in the recent years.
- April also saw strong issuance of $45 billion, marking an $11 billion increase vs. the 5-year average of $34 billion and a 13% increase over April 2024. The volatility created disruption in the new issue market by causing previously scheduled deals to be postponed and added to the calendar in later weeks. Adding to the glut of supply, municipal funds also experienced outflows totaling $3.6 billion, largely focused on long-term, national, and high-yield funds, thus straining market liquidity even more drastically.
Corporate Markets
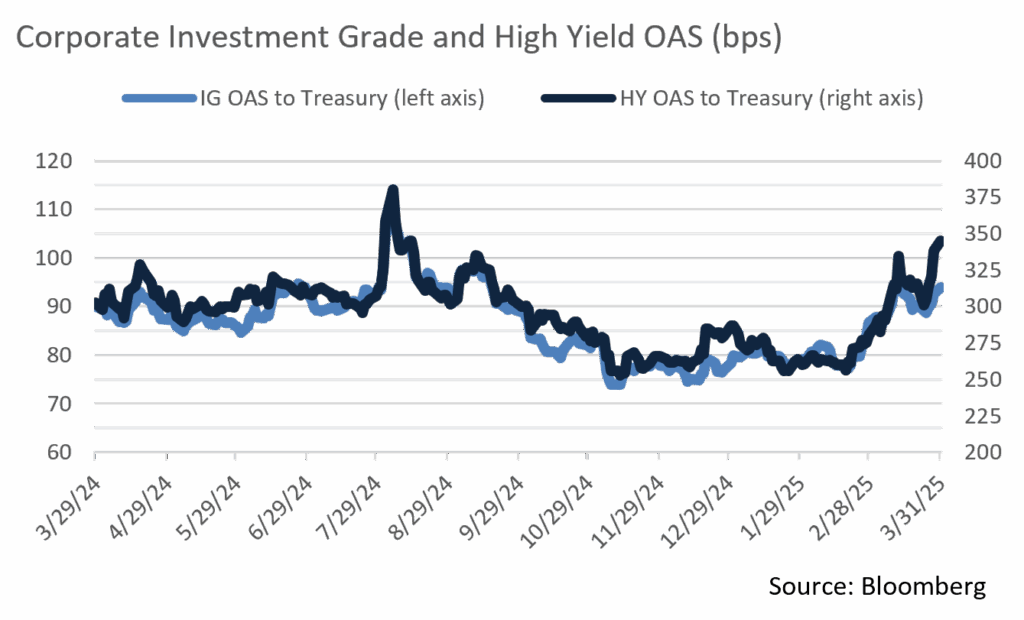
- Investment Grade Corporate credit spreads sprang to YTD highs to begin April as details surrounding Trump’s sweeping US tariff hikes were announced. The self-proclaimed “Liberation Day” drove markets into sell–off mode, and the OAS on the Bloomberg US Corporate Bond Index rose from 93bps to 116bps over the next four days. This generated a tremendous amount of volatility and tested market liquidity, especially among lower-quality credits, where the sell-off was more dramatic. OAS on the US Corporate High Yield Index spiked from 334bps to 453bps over those same few trading days.
- Uncertainty persists, although both Investment Grade (IG) and High Yield (HY) spreads eventually retreated to close to where they began the month as the White House announced a 90-day pause on non-China tariffs and signaled other potential tariff moderation. Market participants are still operating with trepidation, and we expect volatility to remain, an environment that warrants attention to one’s risk tolerance.
- During times of volatility, mutual fund flows reported by Lipper offer a sense of investor sentiment. IG flows have been highly positive for some time, although the last four weeks of April saw a reversal amid tariff-induced instability. Over that period, IG and HY mutual funds reported net outflows of -$13.34 billion and -$12.37 billion, respectively, a clear indication of investor unease. The -$6.08 billion in net outflows from IG funds reported over the week ending April 9th was the largest since 2023, while net outflows from HY funds reached $9.63 billion that same week, the most since 2005. As would be expected in turbulent times, UST funds saw net inflows of +$18.75 billion.
- Despite a volatile month, issuers were able to successfully bring a great deal of new offerings to market, issuing $105 billion of new debt. This brought the YTD total to a healthy $636 billion, 1% higher than the same period in 2024. Nonetheless, some cracks in demand have become evident as investors struggle to evaluate the forward outlook for the economy, Fed policy, and bond market yields. Concessions required to close IG deals have increased modestly, but overall, deals were well bid. We expect robust issuance to continue, although we anticipate the process will be bumpy as perceived risk aligns with demand.
- The UST curve steepened in April as shorter rates declined on growing anticipation of Fed easing. April closed with 3Yr USTs at 3.60%, down from 3.88%. Meanwhile, the 30Yr long bond rose 10bps to 4.68% and the spread between 2s and 10s widened to 56bps from 33bps. Front-end rate pressure is likely to persist due to a slowing economy and recession fears, increasing pressure on the Federal Reserve.
Sources: MMD, Bloomberg, Bond Buyer
Public Sector Watch
Credit Notes
Port Update
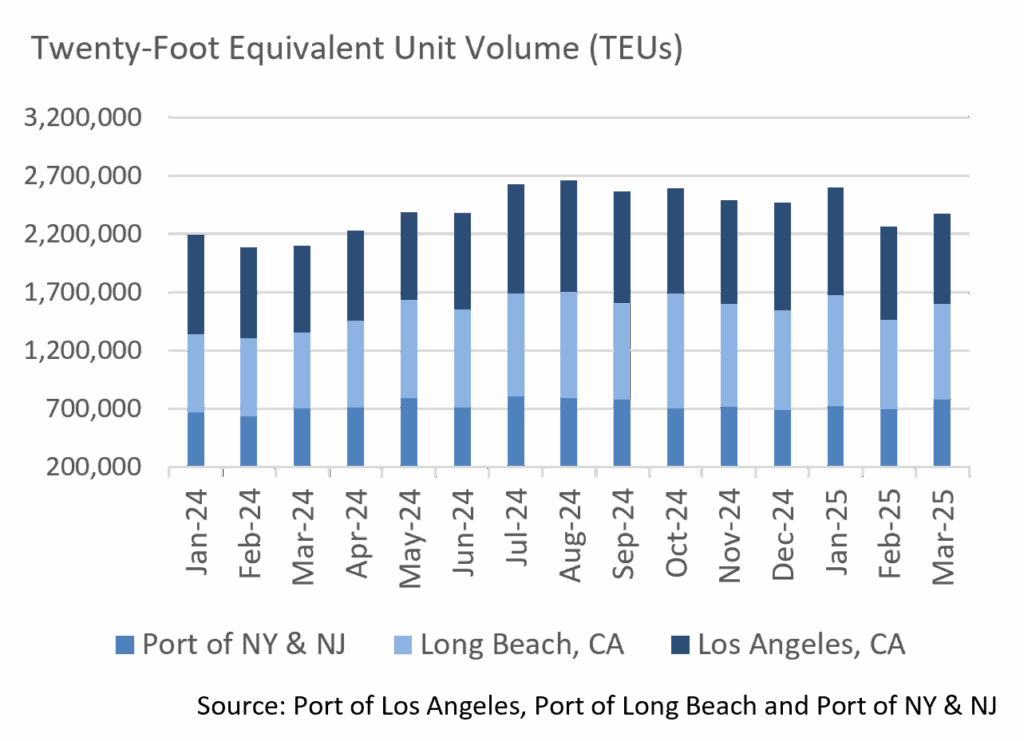
- Gene Seroka, Executive Director of the Port of Los Angeles, warned of a sharp decline in cargo volume at the port’s Board of Harbor Commissioners meeting on April 24th. Seroka said, “essentially all shipments out of China for major retailers and manufacturers have ceased.”
- The Port of LA import volumes for scheduled vessels for the week of April 27 – May 3 are down 31% vs. the previous week and have decreased 14% compared to a year ago.
- Torsten Slok, Chief Economist at Apollo Global Management, laid out a timeline based on the 20 to 40 days it takes for cargo to get from China to the US, and then an additional 10 days to get to store shelves. Lower imports are expected to result in layoffs in transportation and retail industries as well as, empty shelves by late May if no significant changes to our tariff policies are made, likely producing a recession by summer.
- Tariffs are a moving target and may well be reduced, and although there are implications for the economic outlook, our port credits remain fundamentally strong. The Port of Long Beach and Port of Los Angeles both have a relatively high reliance on cargo coming from China but are secured by guaranteed annual minimum payments that facilitate greater revenue stability and support maintenance of strong debt service coverage. Additionally, both ports enjoy very strong liquidity.
Mass Transit Update
- Transit systems have faced decreased ridership and revenue since the onset of the Covid-19 pandemic. However, transit systems have not experienced onerous financial challenges during this time due in large part to $70 billion in emergency Federal aid.
- These payments were aimed at filling a temporary funding gap prior to ridership levels returning, yet with remote work driving a change in usage, ridership at many transit systems has never completely recovered. According to Bloomberg News, the largest U.S. systems are collectively facing a $6 billion shortfall over the coming years.
- Management teams are weighing increasing fares and/or cutting expenses, the latter of which, in many cases, would be through eliminating services, leading to further erosion of transit ridership. Raising rates and cutting services are politically difficult and often face significant opposition. Transit systems are also increasingly turning to other revenue sources, with state and local tax revenue often being the principal funding option.
- Southeastern Pennsylvania Transportation Authority (SEPTA) recently made headlines as it faces a $213 million structural deficit. SEPTA plans to propose a FY 2026 budget that reduces services by 45% while also boosting fares by 21.5%, the largest increase in its operating history. While the agency recognizes it could lead to further ridership losses, it is left with no other choice if the state does not step in to provide funding support. Governor Shapiro is looking to increase the share of sales tax proceeds allocated to transit, providing $1.5 billion over five years. While it remains unclear whether other state officials will support this move, it would essentially eliminate the need for service reductions.
- New York has recently taken similar steps, demonstrating their support for the NY MTA by increasing appropriations and taxes at the local level to ensure financial stability. Governor Hochul has implemented increases to the payroll mobility tax and has supported new taxes such as the Real Estate Transfer Tax to reduce reliance on farebox revenues. While NY MTA still faces financial challenges due to its extensive capital plan and deferred maintenance, they have made significant improvements in recent years.
- Although headlines have drawn recent attention to the financial difficulties faced by transit systems, many have long been dependent on supplemental aid from the state, local, and federal governments. Transit systems play a critical role in regional economies, and we expect such supplemental funding to play an increasingly important role in the years ahead.
- Our Credit Research team favors mass transit systems that are economically essential, enjoy strong voter support, have debt secured by dedicated tax revenues, and benefit from healthy local economies. In addition, we seek out issuers characterized by relative revenue stability, ample debt coverage, and those that segregate revenue to fund debt service before operations.
Sources: Bloomberg, Apollo Global Management, MTA, Port of Los Angeles
Composite Portfolio Positioning (As of 4/30/25)
Strategy Overview
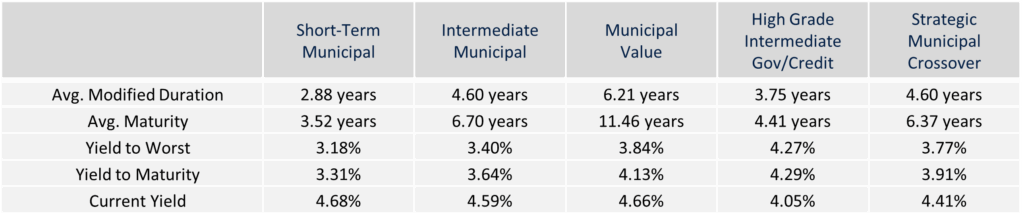
Duration Exposure (as of 4/30/25)
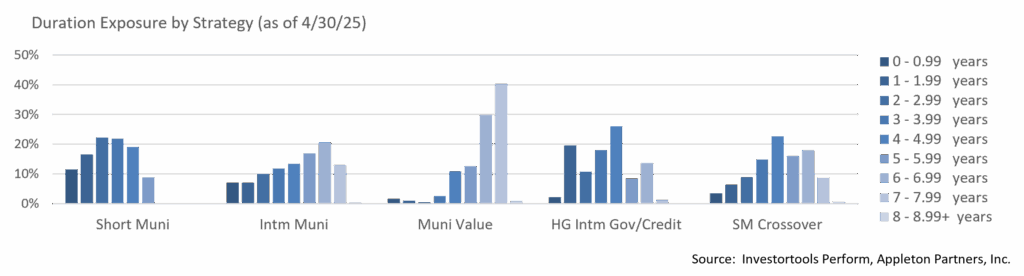
The composites used to calculate strategy characteristics (“Characteristic Composites”) are subsets of the account groups used to calculate strategy performance (“Performance Composites”). Characteristic Composites excludes any account in the Performance Composite where cash exceeds 10% of the portfolio. Therefore, Characteristic Composites can be a smaller subset of accounts than Performance Composites. Inclusion of the additional accounts in the Characteristic Composites would likely alter the characteristics displayed above by the excess cash. Please contact us if you would like to see characteristics of Appleton’s Performance Composites.
Yield is a moment-in-time statistical metric for fixed income securities that helps investors determine the value of a security, portfolio or composite. YTW and YTM assume that the investor holds the bond to its call date or maturity. YTW and YTM are two of many factors that ultimately determine the rate of return of a bond or portfolio. Other factors include re-investment rate, whether the bond is held to maturity and whether the entity actually makes the coupon payments. Current Yield strictly measures a bond or portfolio’s cash flows and has no bearing on performance. For calculation purposes, Appleton uses an assumed cash yield which is updated on the last day of each quarter to match that of the Schwab Municipal Money Fund.
This commentary reflects the opinions of Appleton Partners based on information that we believe to be reliable. It is intended for informational purposes only, and not to suggest any specific performance or results, nor should it be considered investment, financial, tax or other professional advice. It is not an offer or solicitation. Views regarding the economy, securities markets or other specialized areas, like all predictors of future events, cannot be guaranteed to be accurate and may result in economic loss to the investor. While the Adviser believes the outside data sources cited to be credible, it has not independently verified the correctness of any of their inputs or calculations and, therefore, does not warranty the accuracy of any third-party sources or information. Any securities identified were selected for illustrative purposes only, as a vehicle for demonstrating investment analysis and decision making. Investment process, strategies, philosophies, allocations, performance composition, target characteristics and other parameters are current as of the date indicated and are subject to change without prior notice. Not all products listed are available on every platform and certain strategies may not be available to all investors. Financial professionals should contact their home offices. Registration with the SEC should not be construed as an endorsement or an indicator of investment skill acumen or experience. Investments and insurance products are not FDIC or any other government agency insured, are not bank guaranteed, and may lose value.