


Insights & Observations
Economic, Public Policy, and Fed Developments
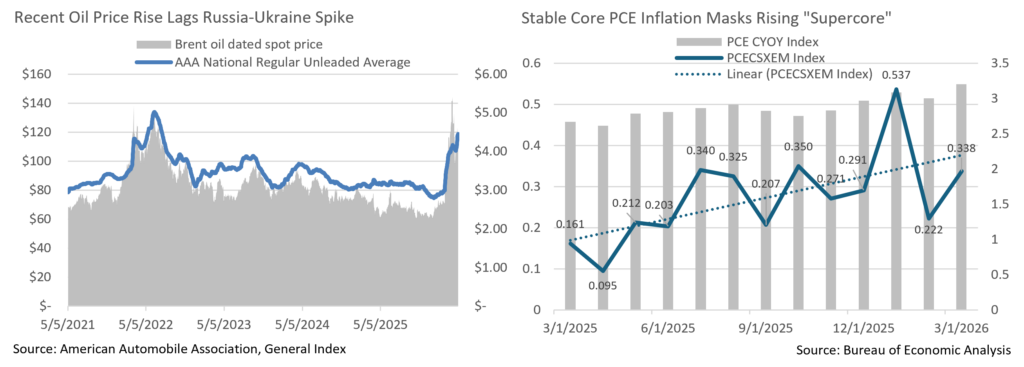
- April’s inflation data began to show the impact of the war in Iran, though so far it is narrowly contained. CPI was in-line at +0.9%, the highest reading since Covid, though encouragingly expectations fell as we got closer to the release, and core inflation came in a tenth lower at +0.2%. There is evidence of (very limited) consumer pullback in the most discretionary of categories; notable here in Boston at the start of baseball season was a 10% drop in admission to sporting events. This was one of a handful of large contractions to small components, without which we would likely have been in-line. So far, it appears consumers have not dramatically modified their behavior with surging gas prices, and energy costs haven’t yet begun to impact prices elsewhere.
- PCE, meanwhile was in line, at +0.7% headline and +0.3% core. However, we’re more focused on the Fed’s preferred “supercore,” which after a light reading in the prior month has reestablished an upwards trendline that’s largely been in place since Liberation Day. We remain concerned that core inflation was moving against the Fed even prior to the war.
- Retail spending surprised strongly to the upside, +1.7% vs +1.4%. While these are nominal and not inflation-adjusted measures, and accordingly the headline was boosted by higher gas prices, the “control group” (which strips out a number of components, including gas) rising 0.7% vs 0.2% suggests real strength. This comes at a time when many consumers received fairly robust tax refunds, so it will be interesting to see if this strength continues.
- After March’s jump, gas prices were largely stable for most of April but surged in the final week of the month. Price moves have so far lagged what we saw after the 2022 invasion of Ukraine; however, we see room for gas prices to potentially rise further from here. The Trump Administration has responded by tapping the Strategic Oil Reserve (as did the Biden Administration post-Ukraine) and at the current pace will be able to draw down through October before reaching the legal minimum and approaching levels where the stability of the underground network might become at risk. High gas prices are likely to linger beyond then even in the event of a rapid resolution of the war, which we do not see. We would note that despite both parties’ rhetoric to the contrary, the US has been de-escalating when given opportunities to escalate, while Iran has been escalating when given opportunities to de-escalate. This suggests peace is not yet likely.
- Powell’s final meeting as chair of the FOMC was full of surprises, despite widespread consensus that rates would be held unchanged. Powell’s decision to stay on the Board of Governors through the end of his term in 2028 after he leaves as Chair at the end of this month cited legal attacks on the Fed’s independence (by convention the Chair usually resigns) and was not unexpected. We believe that one consequence of this decision has been underappreciated; as incoming Chair, Kevin Warsh, will now replace uber-dove Steven Miran rather than Powell, making Warsh a net hawkishaddition to the FOMC.
- This is important in the context of the meeting’s biggest surprise; there were four dissents, the most since 1992. Miran’s dissent in favor of a cut was assumed, but Kashkari, Hammack, and Logan dissenting due to a perceived “easing bias” in the Fed statement (notable in that the actual statement was remarkably neutral) was completely unexpected. We believe this was a shot across the bow, less to Warsh than to the Trump Administration, implying that no matter who chairs the FOMC, the votes to cut interest rates don’t exist. With the Iran War pressuring oil markets and inflation, the market is at least well aligned with this view, and at present no rate adjustments are priced in through 2027, supporting our view that the Fed is on hold until they have a clear reason not to be.
Sources: Bureau of Labor Statistics, Bureau of Economic Analysis, U.S. Census Bureau
From the Trading Desk
Municipal Markets
- After seeing both rates and ratios rise sharply during March, investors opportunistically took advantage of an attractive yield landscape and appealing ratios in April, a month that appears to have been a good entry point during a seasonally weak period. As such, price action reversed course but not enough to fully offset the prior month’s backup.
- Apart from 1- and 2-yr maturities, municipal rates rallied top to bottom, from a few basis points in the front-end to as much as 20bps in the belly of the curve.
- With regards to absolute yield moves, the 1-yr maturity saw yields push higher by 16bps. while the 2-yr saw a more tapered selloff of 5bps. Maturities in 3-, 5- and 7-yr spots rallied by 2, 8, and 11bps, respectively, while the 10-yr and longer part of the curve registered lower yields of 16-20bps.
- The rally pushed AAA Muni/Treasury ratios lower for all spots on the curve other than the front end which saw sustained relative cheapening. The 3- and 5-yr maturities richened by 1.7-3%, while 7 to 30-yr ratios tightened by 3.75%-4.65%, the most notable move being in the 10-yr spot. The month closed with the 3-yr ratio at 63.5%, 5-yr at 64.7%, while the 10-yr settled at 68%. At the long end of the range, the 25- and 30-yr spots closed at approximately 80% and 87%, respectively.
- According to JP Morgan, April produced tax-exempt issuance of $43B, more than 25% above the trailing 5-year average ($34B) and tying last April as the second-highest issuance April on record.
- Municipal funds continued to see robust subscription activity throughout the month with April’s fund flow estimate totaling about $3 billion according to Barclays. The primary asset gathering categories have been ETFs and long-term/national funds.
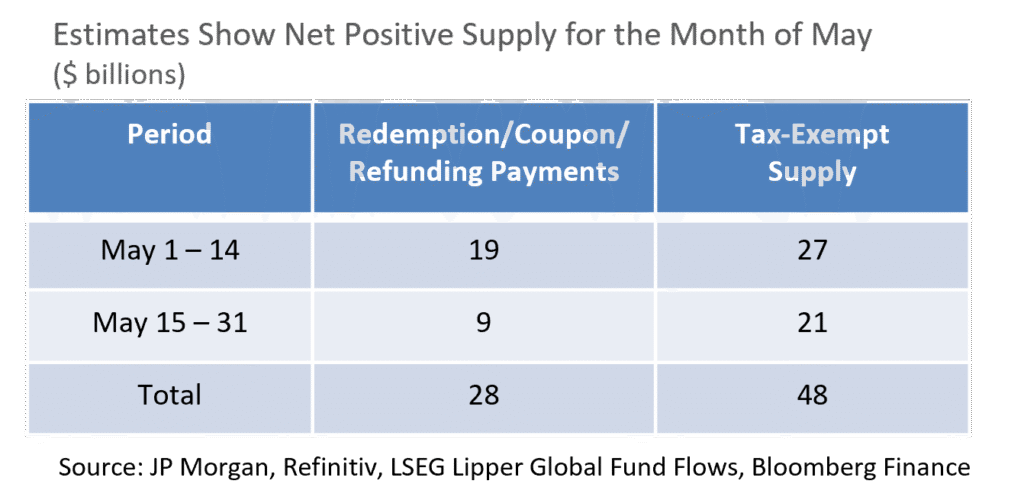
- Sustained fund inflows have helped absorb increased issuance and resulted in the asset class posting a healthy total return of +1.15% in April, the best since 2014 according to JPMorgan. May looks to be somewhat more challenging from a technicals perspective with net positive supply estimated at around $20B, the equivalent of the prior 4 months of net supply combined into a single month, according to JPMorgan. As such, attractive opportunities to add to municipal exposure may emerge.
Corporate Markets
- US Treasury rates climbed higher with a curve steepener firmly in place. The largest move across the curve was the 8bp increase in the 2-3-Yr maturities. In addition, when measuring the move so far this year, the 2-Yr portion the curve has moved higher by 40bps. Second to that was the 3-Yr at 35bps, while the 10-Yr moved higher by just 20bps in that time. The curve inversion on the short end has been erased, for now. The trajectory of short-term rates will continue to be driven by the market’s reaction to the Fed, and while the recent Chairman change shouldn’t change policy immediately, we do feel that volatility will remain.
- US Investment Grade credit spreads dropped 10bps during April, with the 79bps OAS month end print on the Bloomberg US Corporate Bond Index the lowest level since the end of February of this year. It’s also 14bps off the YTD high in mid-March. While there is concern given what’s happening in the Middle East, risk sentiment continues to be in the “on” direction with investor demand being very high. Elevated rate levels and a stable credit environment is offering opportunities for investors with an appetite for yield. The direction in spreads continues to feel very narrow and a breakout does not appear to be likely.
- We saw a minimal amount of movement in spreads within individual rating buckets over the course of April. The largest spread move occurred within the BBB vs AA category where the spread narrowed by 6bps to a difference of just 40bps. This encapsulates a large portion of the market and the spread between BBB and A tightened by just 3bps. April saw lower quality performing better than higher rated bonds. Our preference for higher quality bonds remains intact especially as spread compression in lower quality diminishes the risk/reward component of the lower rung of the quality spectrum.
- Issuers continue to take advantage of investor demand that has had a significant appetite for bonds. The month’s $177.52B brought to market beat the $115B syndicate estimates for April. Several jumbo deals helped to push levels higher, bringing the YTD total to $813.55B, 26% higher than this time last year. Buyer fatigue generally feels nonexistent, with many deals receiving orders that amounted to nearly 4 – 5 times more than available bonds. It is expected that May will be another big month for issuance with estimates well over $100B. It may be the last big push before summer sets in but there is no sign of issuers letting up anytime soon.
Sources: Bloomberg, Bond Buyer, Barclays, JP Morgan, and Lipper Inc.
Public Sector Watch
California Personal Tax Collections Surge Past Estimates
April is traditionally an important month for the Federal Government as well as those states that collect personal income taxes. While wage-related income taxes are collected throughout the year, April is typically the month when final settlements and other non-wage income taxes are measured and paid, coinciding with the IRS’s April 15th deadline.
April collections are notably more important for some states than others. Those states that assess personal income taxes, have a particularly progressive tax structure, and also collect a capital gains component, April’s collections can have major impact on overall budgetary performance. The poster child for this is California, and recognizing its credit importance, the State’s Controller’s Office provides daily updates on personal income taxes throughout April.
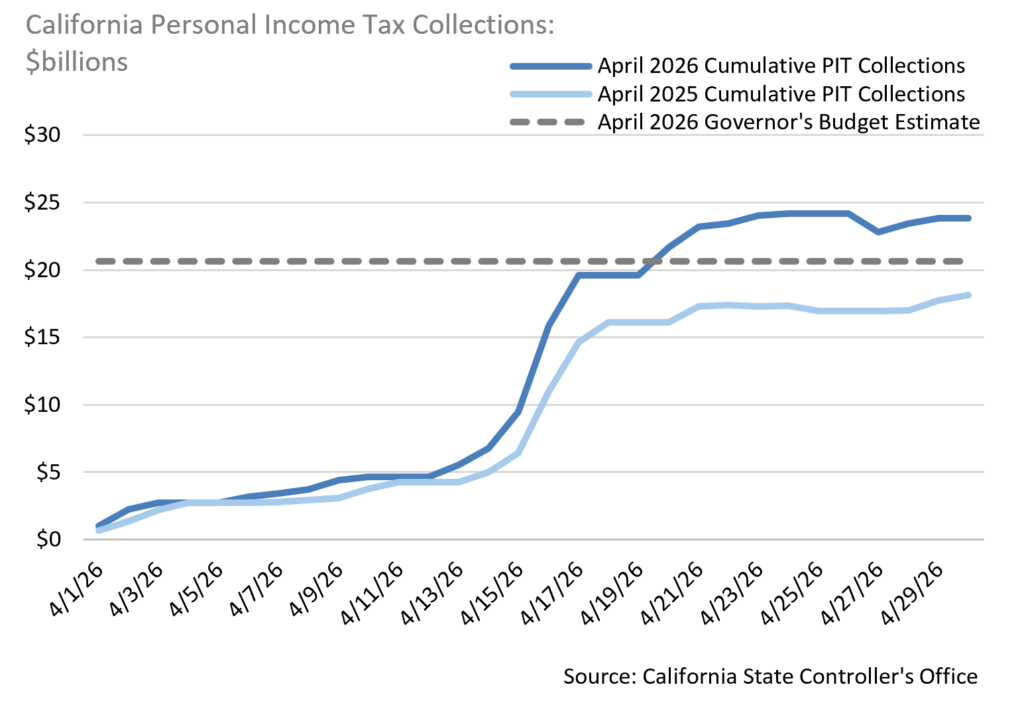
April 2026 Tax Revenue
California reported collecting $23.8 billion in personal income taxes in April. That is $5.7 billion (+32%) more than what was collected in April 2025 and $3.2 billion (+15%) greater than had been projected in the Governor’s recent budget proposal. This is a material upside surprise in California’s single most important revenue metric.
Implications for State of California’s Credit Profile
The near-term implications for California’s credit profile are unequivocally positive. Strong revenue performance on both a YoY basis and relative to estimates improves Fiscal 2026 budget standing. Collecting billions more in revenue than expected provides the State with greater flexibility in the current fiscal year and in upcoming budget negotiations. Headline sentiment improvement is also a notable factor that may positively influence bond pricing and credit spreads.
Beyond the near-term, while implications are still positive, they must be balanced against other realities. It is important to understand what drove this outperformance. Since California’s tax base includes a high concentration of wealthy taxpayers, strong 2025 equity market performance was the major driver for California’s personal income tax collections. There is inherent revenue volatility in California’s tax structure, and good years can be followed by much more difficult periods.
Credit Implications for Other States
California is a bellwether for states with similar tax structure and taxpayer base characteristics. As such, California’s April revenue surge can be extrapolated to states such as New York, Massachusetts and Connecticut. Other states also have progressive personal income tax structures but are less reliant on capital gains. New Jersey, Oregon and Minnesota would fall into this next category, a group for which California’s tax reporting implications are positive, but to a lesser extent.
Ultimately, California remains unique. Its high reliance on the high-tech/innovation space and wealth levels, combined with its highly progressive tax structure, creates far more volatile revenue trends than other states. We view April 2026’s strong performance as a positive credit event for the State but know well from experience that it is likely the pendulum inevitably swings back at some point.
Sources: California State Controller’s Office
This commentary reflects the opinions of Appleton Partners based on information that we believe to be reliable. It is intended for informational purposes only, and not to suggest any specific performance or results, nor should it be considered investment, financial, tax or other professional advice. It is not an offer or solicitation. Views regarding the economy, securities markets or other specialized areas, like all predictors of future events, cannot be guaranteed to be accurate and may result in economic loss to the investor. While the Adviser believes the outside data sources cited to be credible, it has not independently verified the correctness of any of their inputs or calculations and, therefore, does not warranty the accuracy of any third-party sources or information. Any securities identified were selected for illustrative purposes only, as a vehicle for demonstrating investment analysis and decision making. Investment process, strategies, philosophies, allocations, performance composition, target characteristics and other parameters are current as of the date indicated and are subject to change without prior notice. Not all products listed are available on every platform and certain strategies may not be available to all investors. Financial professionals should contact their home offices. Registration with the SEC should not be construed as an endorsement or an indicator of investment skill, acumen, or experience. Investments and insurance products are not FDIC or any other government agency insured, are not bank guaranteed, and may lose value.