


Insights & Observations
Economic, Public Policy, and Fed Developments
- Backward-looking data is rarely market-moving, but what made September’s GDP revisions especially interesting are the way they called into question 2025’s prevailing narrative. While the headline growth rate of 3.8% alone would be noteworthy, the details are now significantly stronger. An initial final sales to private domestic consumers of 1.2% had already been revised to 1.9% in the second estimate but rose an entire point further to 2.9%. Business fixed investment surged as well, notably equipment (+7.4% to +8.5%) and intellectual property (+12.8% to +15.0%) spending. The prevailing wisdom has been that consumers and businesses have been holding back on spending due to tariff uncertainty; this is now harder to argue. On-again, off-again tariff implementation and a massive AI investment that likely was always going to be directed inside the US (and therefore less susceptible to sudden tariff changes) do add some nuance here, but economic growth in the second quarter is now unquestionably more robust than it looked at first blush.
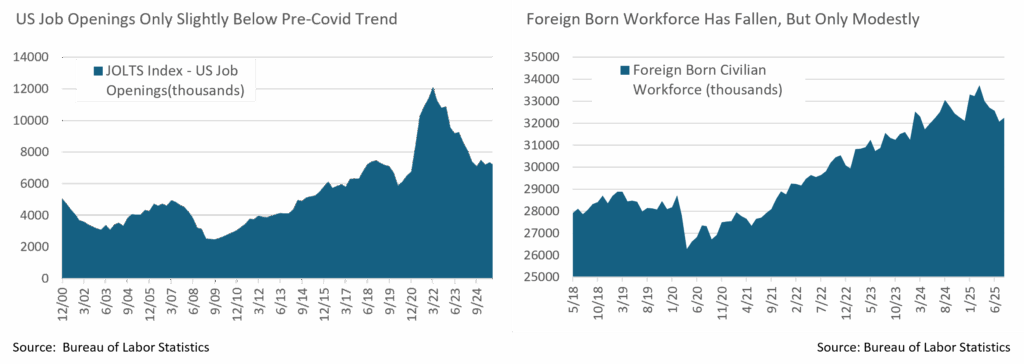
- What’s interesting is that it’s now even harder to align this strong growth with anemic hiring. A federal government shutdown meant we did not get a September Nonfarm Payrolls report at the start of October, but the most up-to-date data shows barely positive hiring over the late spring and summer. The two leading theories for this are that a sharp reversal in immigration trends means very few new jobs are needed to maintain full employment, or that AI is boosting productivity so significantly that companies don’t need to hire. Jobs opening data suggests worker demand is perhaps slightly below the pre-covid trendline, and the foreign-born workforce has fallen somewhat, but neither is conclusive. Given this, we don’t have the full picture yet, and in all cases, the disconnect between growth and hiring bears watching.
- To little surprise, with their first cut of 2025, the Fed cut rates 25bps in their September meeting. Their “Dot Plot” suggests two further cuts are on the way before year-end, though with a caveat: the median dot is two cuts, but with two large clusters, one at two cuts, the other at zero cuts. In other words, relatively modest surprises in incoming data could shift the consensus considerably.
- This is a problem for the Fed, though, in that it’s unclear when we will actually get that data. The Bureau of Labor Statistics (payrolls, CPI, PPI), Census Bureau (retail sales), and Bureau of Economic Analysis (GDP, PCE) will not publish economic releases as long as the federal shutdown that began on 10/1 persists. These are critical releases coming at a crucial moment for the Fed.
- It’s difficult to predict how long this shutdown will last, but there is at least a risk that it could be extended. There is no single policy at the heart of this shutdown that might drive negotiation, unlike 2018 and 2019’s border wall or 2013’s ACA. The debt ceiling does not need to be raised, taking some urgency off negotiations. Democrats appear to have been caught flat-footed in opposition, and if they don’t fold quickly, they will likely require a tangible win to pass a continuing resolution. The Trump administration’s relationship with the media has grown contentious, robbing them of a traditional source of leverage against the opposition party. With continuing resolutions subject to filibuster but federal budgets not, it’s possible the Trump administration may choose to simply focus on a budget rather than temporarily extend funding, which would likely drag the shutdown into November. The direct market implications of this will be less severe than in past shutdowns, thanks to the absence of a debt ceiling showdown; however, it will certainly complicate the Fed’s job, as it will have to assess the appropriate level of rates while essentially flying blind, without access to economic data.
Sources: Bureau of Economic Analysis, Bureau of Labor Statistics Federal Reserve
From the Trading Desk
Municipal Markets
- The month of September was characterized by a significant curve flattening, with rates on the front end moving higher and the intermediate to long end posting a strong rally. This led to September registering solid positive total returns, particularly 7-years and longer on the curve. Yields increased by 20 to 6bps in the 1 to 3-year part of the curve, respectively, while in the 5 to 7-year part of the curve, yields were lower by 5 to 17bps. The most meaningful rally, however, occurred 10-years and out, where yields dropped consistently and closed out the month lower by 30 to 39bps.
- The net result of these contradictory yield moves resulted in a significantly flatter curve slope than what we had seen a short while ago. At the end of September, the 2s-30s slope stood at 194bps, flatter by 47bps during the month, while the 2s-10s part of the curve flattened 40bps to close the month at an absolute 62bps, a significant reversal of the early summer’s continued steepening. Our bell-shaped curve positioning, avoiding the richest part of the curve (i.e., inside of 5 years) and extending durations systematically via bond purchases out to the 12-year part of the curve, has opportunistically set up our core strategies to take advantage of this market move.
- Municipal ratios diverged on the month, with 2- and 3-year ratios widening by 3% and 1%, respectively, while all points on the curve from 5-year maturity and out saw ratios tighten by 2 to 5.8%. Ratios out to 3 years settled at approximately 63%, while 5- and 10-year ratios closed the month at an absolute 62.12% and 70.65%, respectively. The 30-year maturity also saw just inside of 4% of tightening and closed the month at 89.51%
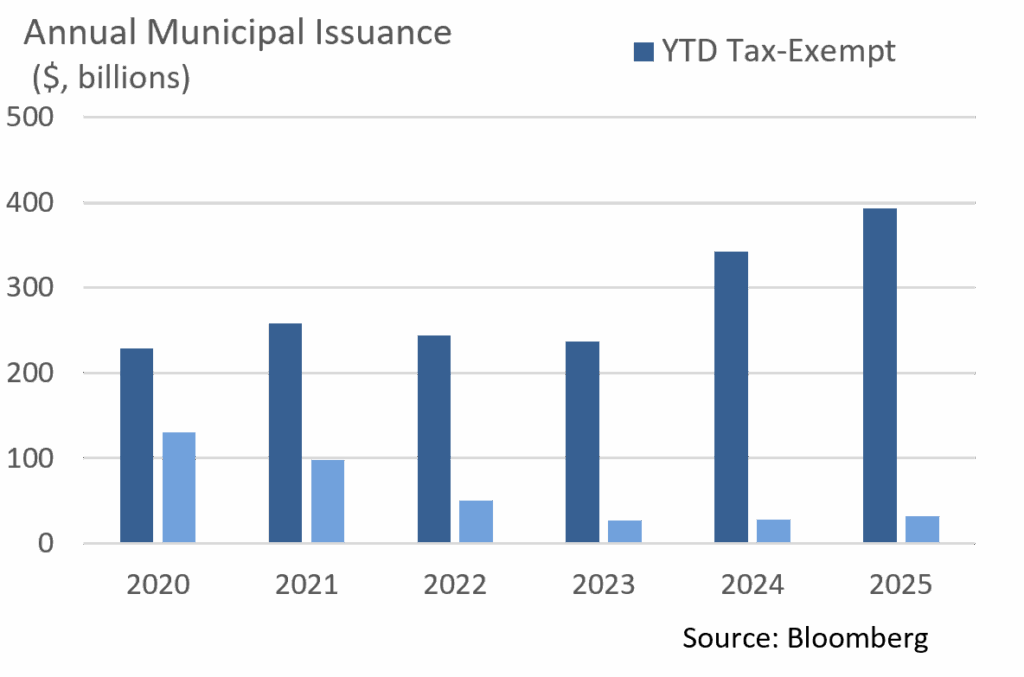
- According to JP Morgan, September gross issuance totaled $47B, modestly below August’s $48B. This exceeded the 5-year average of $40B by 18%, with tax-exempt supply coming in at $44B, also solidly ahead of pace relative to the 5-year average. This brings the YTD gross supply to $424B, while the tax-exempt issuance total is $393B, ahead of last year by 15%. Expectations are for issuance to continue to outpace that of 2024 through the end of the year, with some dealers upsizing their beginning of the year issuance calls.
Corporate Markets
- Given the macro headlines, the incredible resiliency of US Investment Grade credit spreads continues as levels remain intact. The 74bps OAS print on the broader Bloomberg US Corporate IG index is just 2bps of the YTD high set on 09/19/25. This was also the lowest point since March 1998, and well below the 30-year average of 137bps. With that said, the technical backdrop for credit continues to be strong, and the persistence of an active participant pool will likely continue. We feel that IG credit spreads will be range-bound in the near term. Event risk remains a top focus for the markets, and any major thematic pressure could push spreads a little higher.
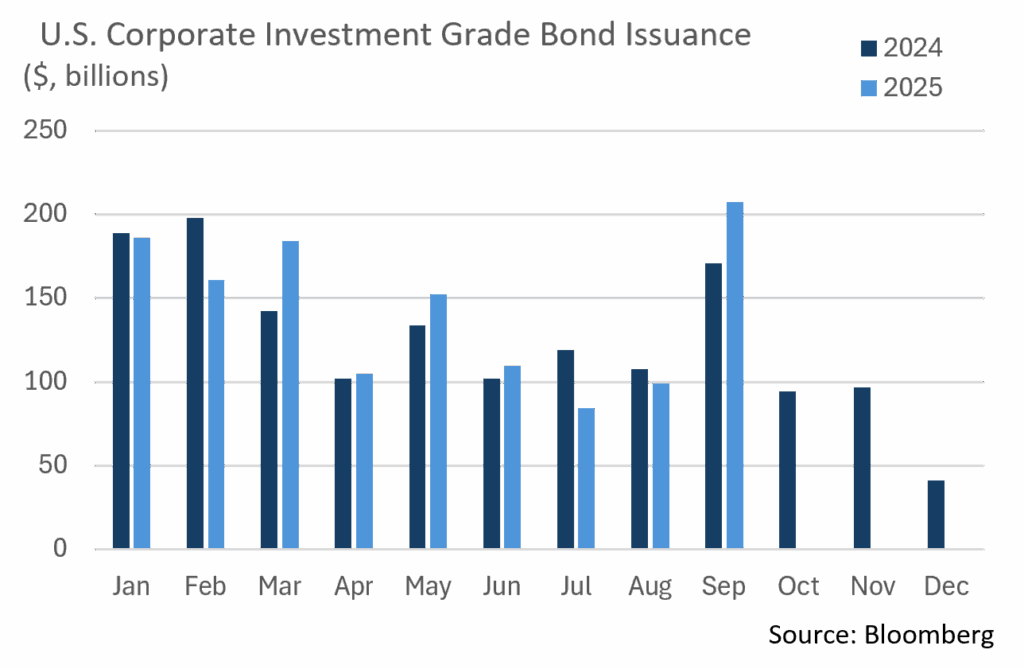
- Amid this positive technical backdrop, issuers are taking full advantage of continued demand. The $207.5 billion in issuance in September makes it the largest month of the year, the largest September overall, and the 5th largest month on record. This September’s primary market was strong, and we are on track to reach the YTD target and may possibly surpass it. Given some of the headline news at times, we have seen concessions on new deals at low levels and order books that are several times higher than bonds that are available. Expectations for new debt in October are roughly $90 billion, but this momentum could shatter that number.
- Demand for credit is trickling down the credit spectrum as the high yield (HY) primary market closed September with $57.6 billion in new debt, the largest month since 2020, the biggest September, and the third largest month on record. The overall level of HY yields continues to be attractive for some investors. However, the level at which HY credit spreads have decreased is tightening the risk/reward relationship. The HY market reacts more aggressively as volatility creeps into the market and, while the backdrop remains on solid footing, that could change quickly. We continue to feel that high quality may offer the best risk/reward considering any potential changes in the macroeconomic environment.
Sources: Bloomberg, JP Morgan, Barclays, Lipper
Public Sector Watch
Municipal Credit Implications of a Federal Government Shutdown
On October 1, the U.S. government shutdown as Congress failed to pass a funding bill before the start of the new fiscal year. The main cause of the dispute is over healthcare funding related to the extension of the Affordable Care Act subsidies and health insurance tax credits. On Tuesday, both sides seemed unwilling to compromise, although talks will continue this week as Congress works to resolve the shutdown.
There have been fourteen federal government shutdowns since 1981, with four lasting more than a business day. The most recent shutdown started at the end of 2018 and lasted 35 days, making it the longest government shutdown in history. While federal employee furloughs and interruptions in federal aid distributions may create a need for short-term adjustments by municipal issuers, we believe that a federal government shutdown lasting beyond a few weeks would have minimal impact on the creditworthiness of high-quality municipal bond issuers.
Our comments below are strictly focused on credit quality, not the potential performance impact of changing Treasury yields or other non-credit-related influences.
Sector Implications
Below, we highlight sectors with an elevated reliance on federal payments:
- Military, Section 8, and Public Housing – Debt service is typically covered by federal grants or appropriations that could be interrupted. Most issuers are small, there is single site risk, and military debt is required to be issued as taxable. We do not have exposure to these sectors.
- Federal Lease Facilities – Debt service is covered by lease payments made by various federal entities. Ratings are typically low-investment grade and high yield, and the leases often require extension prior to bond maturity. We do not have exposure to this sector.
- GARVEEs – Some Appleton clients have exposure to the GARVEE sector, and we remain confident in our holdings. Federal Highway Administration distributions continued for GARVEE issuers during past shutdowns, as the funding program is a multi-year authorization act that has been granted special “Contract Authority” (funding currently authorized through 2026). Some GARVEEs also deposit debt service 12 months in advance, others have reserve funds, and some are secured by a backup pledge of revenues by the issuing State.
- Mass Transit, Higher Ed, Healthcare & Airports – All of these sectors have a meaningful level of federal payment reliance. However, revenue diversity, robust liquidity, and budget flexibility would offer ample offsets in the event of a prolonged government shutdown. Notably, Medicaid and Medicare are non-discretionary, and funds should continue to flow during a shutdown.
Regional Implications
States and Local Governments would likely experience only minimal fiscal disruption during a federal shutdown, although certain regions are more exposed than others due to federal employees, contracts, and spending. For the credits highlighted below, we believe even a protracted shutdown (>30 days) would still be very manageable.
- District of Columbia – According to USAFacts, D.C. is home to more than 186,500 federal employees representing roughly 25% of the District’s total employment (national median is 1.8%). Nonetheless, the District has managed past shutdowns prudently and holds $4.9 billion in available reserves, equal to 12% of revenue.
- Maryland, Virginia, and West Virginia – less exposed than D.C., these States and local counties still have an above average reliance on the federal government and ancillary businesses. We take comfort in the region’s well-managed municipalities, many of which carry AAA credit ratings. We are confident in the stability of the issuers our Credit Research team approves.
- Hawaii and Alaska – Although both states maintain a high reliance on the federal government for economic activity, the military is the dominant employer. In the case of a shutdown, we would expect Department of Defense payments to be sustained.
Sources: USAFacts, Moody’s, BofA
Composite Portfolio Positioning (As of 9/30/25)
Strategy Overview
Duration Exposure (as of 9/30/25)
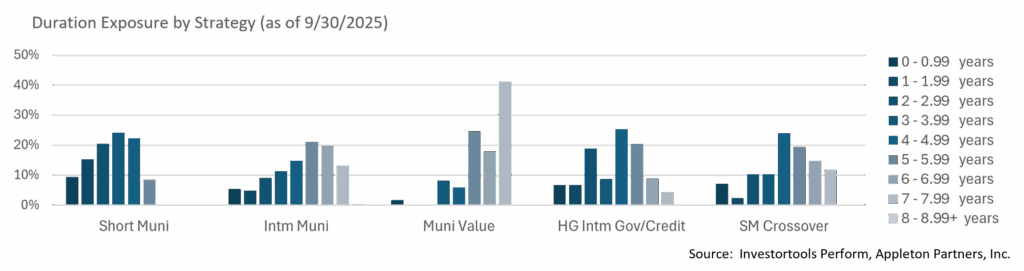
The composites used to calculate strategy characteristics (“Characteristic Composites”) are subsets of the account groups used to calculate strategy performance (“Performance Composites”). Characteristic Composites excludes any account in the Performance Composite where cash exceeds 10% of the portfolio. Therefore, Characteristic Composites can be a smaller subset of accounts than Performance Composites. Inclusion of the additional accounts in the Characteristic Composites would likely alter the characteristics displayed above by the excess cash. Please contact us if you would like to see characteristics of Appleton’s Performance Composites.
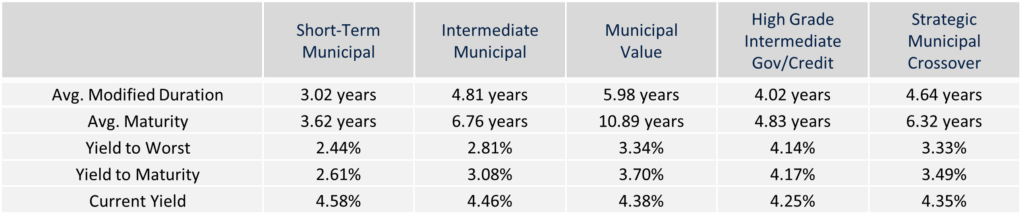
Yield is a moment-in-time statistical metric for fixed income securities that helps investors determine the value of a security, portfolio or composite. YTW and YTM assume that the investor holds the bond to its call date or maturity. YTW and YTM are two of many factors that ultimately determine the rate of return of a bond or portfolio. Other factors include re-investment rate, whether the bond is held to maturity and whether the entity actually makes the coupon payments. Current Yield strictly measures a bond or portfolio’s cash flows and has no bearing on performance. For calculation purposes, Appleton uses an assumed cash yield which is updated on the last day of each quarter to match that of the Schwab Municipal Money Fund.
This commentary reflects the opinions of Appleton Partners based on information that we believe to be reliable. It is intended for informational purposes only, and not to suggest any specific performance or results, nor should it be considered investment, financial, tax or other professional advice. It is not an offer or solicitation. Views regarding the economy, securities markets or other specialized areas, like all predictors of future events, cannot be guaranteed to be accurate and may result in economic loss to the investor. While the Adviser believes the outside data sources cited to be credible, it has not independently verified the correctness of any of their inputs or calculations and, therefore, does not warranty the accuracy of any third-party sources or information. Any securities identified were selected for illustrative purposes only, as a vehicle for demonstrating investment analysis and decision making. Investment process, strategies, philosophies, allocations, performance composition, target characteristics and other parameters are current as of the date indicated and are subject to change without prior notice. Not all products listed are available on every platform and certain strategies may not be available to all investors. Financial professionals should contact their home offices. Registration with the SEC should not be construed as an endorsement or an indicator of investment skill, acumen, or experience. Investments and insurance products are not FDIC or any other government agency insured, are not bank guaranteed, and may lose value.