


Insights & Observations
Economic, Public Policy, and Fed Developments
- A common theme in recent client conversations is that the economic risks we currently see in the markets aren’t simply the size of announced tariffs or widespread federal layoffs per se. Rather, it’s the amount of uncertainty both have created and the impact it’s having on consumer and business behavior. The news cycle has been moving far faster than economic releases, but we are seeing the effects of these announcements.
- A change in purchasing habits emerged in consumer spending data released in March for the month of February. Retail sales missed at the headline, as gas and auto sales detracted, but “control group” sales and core retail spending beat handily, although likely due to tariff frontrunning. The implication, especially with weakness in food services, clothing, furniture, and sporting goods, is a pullback in discretionary spending and a sharper decline in staples.
- Later in the month, the personal consumption reports showed a surprise upside in personal income that didn’t flow through into spending. Real spending was below expectations and barely positive, meaning income translated into a surge in the savings rate. The problem is that the accompanying PCE deflator did not reflect this weakness. While it only beat expectations modestly, essentially every category within core PCE (except for transportation, echoing anecdotal reports of weakening demand from Delta earlier in the month) showed a steady increase in prices, broadly in line with the headline increase. This pattern, following a similar one in retail sales, suggests that consumers are still able to spend (and absorb price increases) on staples but are choosing to defer big-ticket purchases and experiences. Over short periods of time, this isn’t a problem as spending will eventually catch up, but longer term, the risks of legitimate economic harm increase.
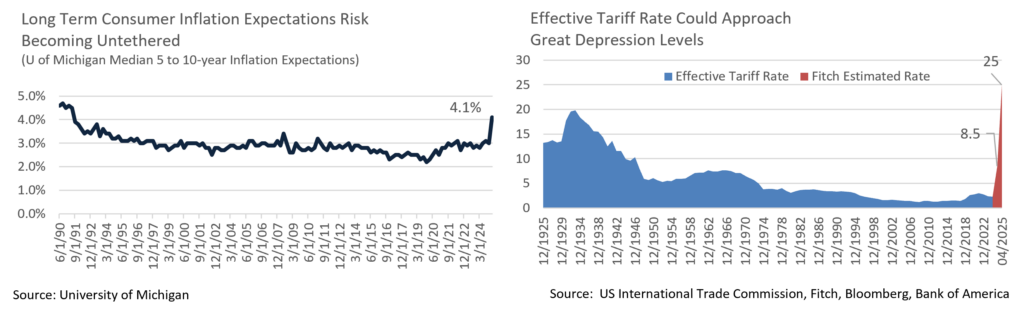
- Meanwhile, February’s tariff-driven growth scare may have been an underreaction. The tariffs outlined by Pres. Trump at the start of April were on the most aggressive end of expectations. Trump described his policy as “kind reciprocal” tariffs, a global 10% tariff, and for nations seen by the Administration as assessing the US at a higher average rate than that, roughly half of their average rate on their US imports, coupled with a 25% tariff on all imported autos. There is uncertainty around the rate calculations, which for certain countries is implausibly high. It appears to be based on the trade deficit as a percentage of exports rather than actual rates, a more aggressive model than even the “tariffs plus VAT” that was considered the worst case coming into the meeting. Tariff policy has been volatile for a long time, and we suspect the end game remains in flux. At a minimum, while there will be negotiation, there will also be significant trade retaliation, and inflation will likely rise while growth slows, particularly since the announced tariffs amount to 2.2% of GDP and 2x the largest tax increase in modern US history, according to Strategas.
- Even before the Rose Garden speech, tariff uncertainty weighed on the C-suite. So far, we mostly have anecdotal reports that businesses are pulling back on capex and hiring, and much of that – the March Beige book, for example, whose survey period ended before growth scares took hold in late February – is now badly out of date. But business sentiment has soured perceptibly and is likely to worsen in coming months.
- Inflation expectations bear watching here as well. In his FOMC press conference, Chairman Powell noted that the University of Michigan’s 5 to 10-year inflation expectations indicator hitting a 34-year high this month at 4.1% was an outlier but also added that other metrics were moving in the same direction and there was widespread consumer fear that tariffs were going to reignite inflation. Concern about future price increases on staples may also be depressing spending.
- Meanwhile, the Atlanta Fed’s GDPNow Q2 estimate has fallen to -3.7%. We don’t expect the actual figure to be this bad, and excluding gold imports (which have surged as the trade war intensifies) it’s only -1.4%, but this is another example of how overwhelming uncertainty is crippling growth.
Equity News and Notes
A Look At The Markets
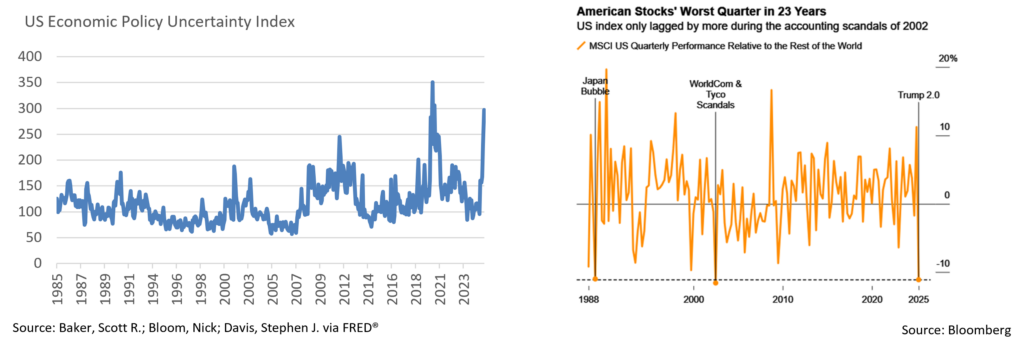
- Stocks slumped in March as each of the major U.S. averages dropped by at least -4%. For the S&P 500, March’s -5.8% loss was the worst month since Dec 2022, and Q1 (-4.6%) was the worst quarter since Q3 2022. The tech-heavy Nasdaq fared worse, dropping -8.2% to bring its YTD losses to -10.4%. The DJIA, a laggard over the past 2 years given its lower mega cap tech exposure, better weathered the storm with a -4.2% decline, leaving YTD return in the red at -1.3%. Sector performance was scattered, with only the 3 “growthier” sectors (Cons Disc., Tech., and Comm. Services) underperforming the broader tape with losses of -8% to -9%. Energy was a performance leader (+3.8%) as WTI crude rallied late in the month.
- Policy uncertainty is clearly the primary headwind for risk assets, as March was marked by anxiety concerning trade policy and its economic impact. All eyes were on the Rose Garden for the April 2nd “Liberation Day” announcement in which the President unveiled a new wave of tariffs that take the effective average tariff rate to over 20%, the highest in a century. Recession odds quickly rose following the announcement, sparking a flight to safety driven sell-off in risk assets. Investors are still looking for answers to a host of questions. Is this just a hardline bargaining step aimed at forcing further negotiation? To what extent will other countries and the EU retaliate? Will global central banks, including the Fed, respond with easier monetary policy? Will inevitable legal challenges be successful? How will US companies be treated by foreign governments and consumers going forward? Will Republicans in Congress continue to back the President’s trade agenda as they face growing pressure from consumers and corporations? Like so many others, we are eager for signs of clarity.
- Uncertainty, as measured by the PUI, is now >400, a level only seen during Covid. When the PUI is >180, short-term returns (1-month) are muted but well above average on a 3, 6, and 12-month basis. Periods of high uncertainty create volatility and often present attractive long-term buying opportunities.
- The S&P 500 closed March -8.7% below its all-time high of February 19th; however, the index was down as much as -10.1% earlier in the month. Investors have dealt with the 7th fastest S&P 500 correction (-10%+ from the most recent high) since 1929, an unnerving period that has dulled risk appetite. With the benefit of hindsight, corrections are often viewed as healthy, given that they create valuation resets and opportunities to buy strong companies at more attractive levels. Since WWII, there have been 48 S&P 500 corrections, and only 12 (25%) went on to become bear markets (-20%+). Market downturns happen for numerous reasons, with many caused by what are perceived to be unique challenges. However, markets have historically proven to be resilient and index levels have climbed ever higher over time.
- With the US stock market in correction mode, looking at pockets of the capital markets that have fared better is revealing. Bonds have rallied sharply in recent weeks, once again demonstrating their value as volatility buffers in balanced portfolios. The “Magnificent 7,” the mega-cap tech companies that drove US stock market gains for most of 2023 and 2024, have been under pressure. Some have been referring to the group as the “Lag 7” given their collective -16% Q1 performance. Although the overall stock market is getting hit hard at the moment, wider market breadth is a long-term positive.
- International stocks have also gotten off to a strong start this year, particularly when compared to US stocks. There have been many “false starts” for non-US equities over recent years, so we are not ready to say that the “US exceptionalism” trade is done. However, more modest valuations, faster relative growth, and clear differences in monetary and fiscal policy (US austerity led by DOGE, a tight Fed, and deficit cuts vs. looser policy abroad) have us evaluating whether a secular shift is approaching.
From the Trading Desk
Municipal Markets
- Municipal yields rose over the month in a bear steepener. The 1 to 3-year part of the curve saw yields rise by 7-14bps, while the long end of the curve rose by over 30bps. The 10 to 15-year segment of the curve saw the steepest increase in yields at 40-42bps. Curve steepening was most pronounced out to 10-years, as the 2-10’s slope widened by 26bps ending the month at 58bps. After experiencing an inverted curve for quite some time, we welcome the value that a steeper curve delivers.
- In an environment of sustained UST volatility, municipal yields underperformed in March, and ratios widened by 5 to 10bps across the curve. The 10-year AAA Muni-UST ratio closed the quarter at 78%, a significantly higher level than the constrained ratios experienced over the past few years. For investors looking to add to their municipal allocation, higher relative value vs. USTs may provide a good entry point.
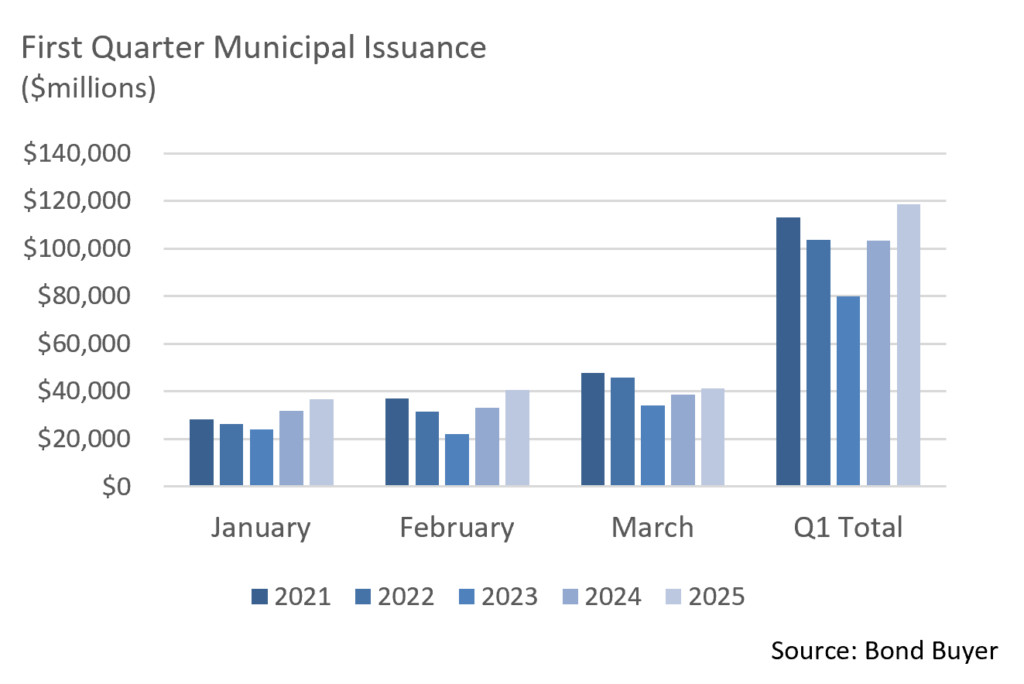
- March saw a robust new issue calendar, as issuance reported by Bloomberg totaled $41.385B, up about 7.4% over March 2024. This capped an already active start to the year as issuers sought to get ahead of policy unknowns, bringing YTD new supply to $118.7, up 14.7% over Q1 ‘24. Elevated new issuance often provides opportunities in the primary market in the form of wider spreads.
- March reinvestment of maturity and coupon payments totaled just shy of $31B, adding to technical seasonal weakness. Additionally, the secondary market has seen heavy bid-wanted levels as market participants contend with fund and tax-time outflows, a dynamic that has contributed to recent municipal underperformance.
Corporate Markets
- Investment Grade Corporate bond spread volatility was evident during March with tariff and recession fear headwinds accelerating. As the month began, spreads had already moved 10bps higher from the Bloomberg US Corporate Index YTD OAS low of 77bps reached in February. By mid-March, IG spreads had moved up another 10bps as risk tolerance abated. The market ultimately settled down, leaving spreads 7bps higher by month’s end at 94bps. These levels are still roughly 20bps off the 5-year average. It seems to us that the IG market is not fully pricing in growing recession risks and that spread volatility will likely remain entrenched as investors weigh the global tariff impact and economic dislocation.
- Uncertainty often creates urgency, and the High Yield market experienced that in earnest in March as issuers rushed to the new issue market, raising that month’s issuance to the highest level since 2021. New bond offerings of $27 billion in early March benefited issuers as risk sentiment had been moving in a positive direction. That changed quickly to the downside as tariff talks escalated and recessionary fears spiked. High Yield spreads reached an 8-month high of 347bps OAS on the Bloomberg US Corporate HY index, a 67bp monthly move. We see a good deal of room for High Yield spreads (a risk metric we closely monitor) to widen further. A “risk-off” environment will likely drive assets into higher quality and lower risk asset classes, such as USTs and high-grade municipals.
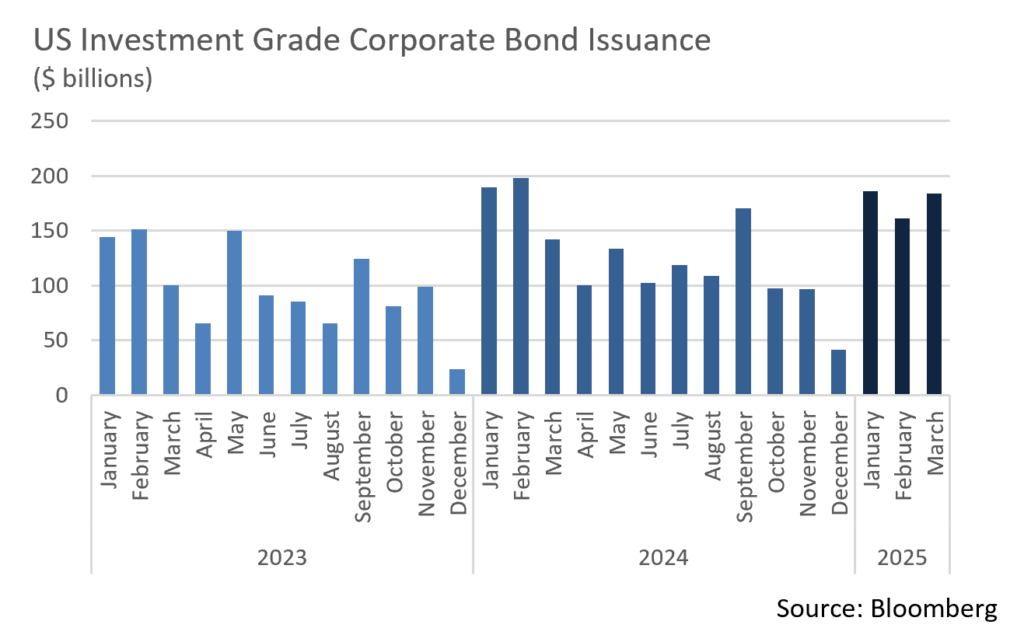
- Issuance in the Investment Grade Corporate markets has faced similar challenges of late, and issuers have been carefully picking their spots. Some have had to “stand down” and wait out the volatility as markets adjust to the latest news. This has created disorder on syndicate desks as issuance backdrops change nearly daily. The IG market ultimately produced $184 billion of new debt last month, the 4th largest March on record and $42 billion above the same period of 2024. It also contributed to the highest first quarter of issuance ever, with $531 billion coming to market. Expectations are for about $120 billion in April, although today’s high levels of uncertainty could slow the pace. Investor demand remains strong, and we are looking to add to portfolios as relative value materializes in increasingly fast-moving markets.
Financial Planning Perspectives
Gifting Strategies Can Reduce Estate Taxes: What Families Should Know
For families looking to preserve wealth and minimize estate taxes, strategic gifting can be a powerful tool. With careful planning, individuals can transfer assets to their heirs while reducing the taxable value of their estate. Here are some strategies to consider.
1. Annual Gift Tax Exclusion
The IRS allows individuals to give a certain amount to any number of recipients each year without incurring gift taxes. For 2025, the annual exclusion is $19,000 per recipient ($38,000 for married couples electing to split gifts). This allows substantial wealth transfers over time without reducing the lifetime estate and gift tax exemption.
2. Lifetime Gift and Estate Tax Exemption
In addition to annual exclusions, individuals have a lifetime gift and estate tax exemption, which in 2025 is $13.99 million per person. Gifts exceeding the annual exclusion count toward this exemption. Effective use of this exemption can help significantly reduce estate taxes, especially given the risk that legislative changes reduce the exemption threshold.
3. Direct Payments for Medical and Educational Expenses
Gifts made directly to medical providers or educational institutions for tuition are exempt from gift taxes. This strategy allows individuals to pay for a grandchild’s college tuition or a family member’s medical bills without impacting their annual or lifetime exemptions.
4. 529 College Savings Plans
A 529 plan allows for tax-advantaged education savings while offering a unique gifting opportunity. Donors can contribute up to five years’ worth of annual exclusions ($95,000 per beneficiary for individuals, $190,000 for couples) in one lump sum without triggering gift taxes, provided no additional gifts are made to that individual within the five-year period.
5. Irrevocable Trusts
Establishing an irrevocable trust, such as a Grantor Retained Annuity Trust (GRAT) or an Irrevocable Life Insurance Trust (ILIT), can help transfer wealth while reducing estate taxes. These trusts allow assets to grow outside the estate, benefiting heirs while minimizing tax consequences.
6. Family Limited Partnerships (FLPs) and Limited Liability Companies (LLCs)
By placing assets into an FLP or LLC and gifting fractional interests to family members, individuals can leverage valuation discounts due to lack of marketability and minority ownership. This reduces an estate’s taxable value while maintaining some control over the assets.
7. Charitable Giving and Donor Advised Funds
Charitable contributions can be structured to benefit both heirs and philanthropic causes. A Charitable Remainder Trust (CRT) provides income to beneficiaries for a set period before the remainder is donated to charity. Donor Advised Funds (DAFs) also allow families to manage charitable giving while enjoying tax benefits.
Proactive gifting strategies can significantly reduce estate taxes and ensure a smooth wealth transfer. We advise you to work closely with your Wealth Manager and estate planning attorneys to tailor a plan that aligns with your financial goals and tax situation. With proper execution, gifting can be a valuable tool in preserving family wealth for generations to come. If you would like to discuss this subject in greater detail, please let us know.
Sources: Internal Revenue Service, Arent Fox Schiff, Captrust
This commentary reflects the opinions of Appleton Partners based on information that we believe to be reliable. It is intended for informational purposes only, and not to suggest any specific performance or results, nor should it be considered investment, financial, tax or other professional advice. It is not an offer or solicitation. Views regarding the economy, securities markets or other specialized areas, like all predictors of future events, cannot be guaranteed to be accurate and may result in economic loss to the investor. While the Adviser believes the outside data sources cited to be credible, it has not independently verified the correctness of any of their inputs or calculations and, therefore, does not warranty the accuracy of any third-party sources or information. Specific securities identified and described may or may not be held in portfolios managed by the Adviser and do not represent all of the securities purchased, sold, or recommended for advisory clients. The reader should not assume that investments in the securities identified and discussed are, were or will be profitable. Any securities identified were selected for illustrative purposes only, as a vehicle for demonstrating investment analysis and decision making. Investment process, strategies, philosophies, allocations, performance composition, target characteristics and other parameters are current as of the date indicated and are subject to change without prior notice. Registration with the SEC should not be construed as an endorsement or an indicator of investment skill acumen or experience. Investments in securities are not insured, protected or guaranteed and may result in loss of income and/or principal.