


Insights & Observations
Economic, Public Policy, and Fed Developments
- July ended with a bang, with the final week so packed with macroeconomic data that the Federal Reserve meeting on 7/30 was almost an afterthought. The bad news is that very little of the week’s data was pretty. The good news is that data is at least telling a consistent story after a long period of uncertainty.
- The first estimation of Q2 GDP came in slightly better than expected at +3.0%. There are several major caveats, however. Markets were expecting a strong rebound after Q1’s -0.5%, with the wave of imports that pulled down Q1 reversing in Q2. They did, although the rebound still left net imports falling -3.9% over the first half of the year, a worrying sign for domestic demand. However, Final Sales to Private Domestic Purchasers weakened substantially in Q2, falling from +1.9% to +1.2%. This is a good “core” read on consumer demand, excluding fluctuations related to trade, inventory levels, and government spending, and it suggests consumers are pulling back. First half GDP is now running at about +1.2%, well below trendline +2-2.5%.
- Second, both CPI and PCE inflation reports are starting to show price increases and suggest – as we expected – tariffs are beginning to flow through after a several month lag. So far, the effect is not substantial, but certain categories such as home furnishings and sporting goods are now undeniably accelerating. PPI inflation suggests that service spending may be in contraction; the PCE report’s personal spending data was essentially flat for the month, so it’s too soon to say that with confidence. But a strong retail sales report earlier in July now looks like an outlier.
- The week’s biggest market event was an abysmal employment report. Not only did growth of 73k jobs come in well below (weak) expectations of 105k, but substantial downward revisions for the prior two months of -258k meant July was the strongest report of the last three, with May and June now a mere 19k and 14k. A contribution of 73k jobs from the anti-cyclical healthcare sector meant that, ex-healthcare, hiring was at a standstill. After having largely been priced out of the futures market, odds of a September rate cut jumped after the report.
- Interestingly, the details of the report suggest labor tightness. The workforce fell over the month and there was no job creation to speak of, yet average hourly earnings rose. Meanwhile, aggregate hours worked increased on an unchanged workweek, suggesting productivity gains, normally a product of labor shortages. All of this is unusual given the extremely weak headline.
- However, a fairly coherent economic picture is coming into focus. Tariffs are starting to show up in prices, a process that should accelerate as another wave of increases comes this week. Consumers are responding to price increases by cutting back on spending. Companies expect demand to continue to fall and are understaffing now rather than hiring and then risking layoffs.
- This creates a “Schrödinger’s Inflation” dilemma for the Fed; if they don’t cut rates for fear of inflation, demand and growth will continue to slow, making inflation unlikely. If they do cut, growth will still slow but fall short of recession, at the cost of swinging the impact of tariffs from demand destruction towards higher prices and inflation.
- We do not take a September rate cut for granted. The inflation trend is upwards, and one hot inflation print could quickly temper market expectations for cuts. But, if the Fed were to cut in September, Powell would likely telegraph this in his late August Jackson Hole speech by shifting the Fed’s focus squarely back to labor weakness, rather than describing labor as merely “not a risk to inflation.” How he chooses to describe labor conditions will be an important indicator for Fed policy through year-end.
Sources: Bureau of Economic Analysis, Bureau of Labor Statistics, US Census Bureau
Equity News and Notes
A Look At The Markets
- Stocks were higher in July as the S&P 500 advanced for the third month in a row. The index finished with a +2.2% gain and now sits an impressive +27.2% above early April lows. Not to be outdone, the tech-heavy Nasdaq gained +3.7%, pushing its win streak to four months, and is up a whopping +38.3% from YTD lows. Six sectors outperformed led by a mix of Tech, Utilities, and Industrials. Laggards included the Healthcare and Consumer Staples sectors as the risk-on rally continued a rotation out of defensive pockets of the market. Overall breadth deteriorated in July as “Big Tech” and the “Magnificent 7” outperformed. The equally-weighted S&P 500 trailed the market-cap weighted index by 1.1%, falling 3% behind YTD.
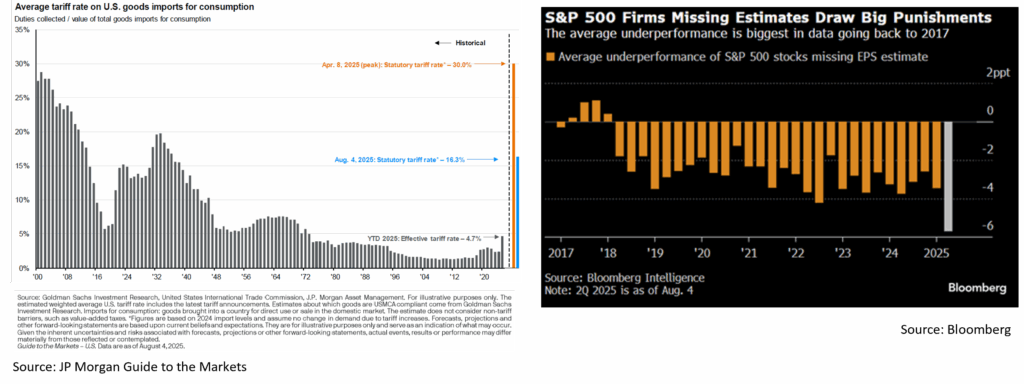
- Markets moved higher throughout July as preliminary trade agreements were reached with large partners including Japan, the EU, and South Korea. There were also several headlines suggesting an easing of trade tensions with China, and the tariff pause was extended until August 12th. While the ultimate micro- and macroeconomic impact remains uncertain, the market for now seems comforted by the additional clarity and relative stability that trade deals have brought. The “worst case” of 30% effective tariff rates are also seemingly off the table.
- July saw the start of Q2 earnings season, and the results so far have been better than expected. With 66% of the S&P 500 having reported, 82% of companies have beaten analyst expectations by an average margin of +8.0%. Both metrics are above their respective 10-year averages. This has raised the earnings growth rate from +4.9% as of 6/30 to +10.3% as of 7/31. Also boosting sentiment, more companies are lifting forward guidance this quarter (56% in Q2 vs. 27% in Q1). If forced to find a fault with the rosy corporate profit season, we would point to the ongoing dominance of the “Magnificent 7”. These mega cap tech companies grew earnings by +26% YoY in Q2 vs. only +4% for the remaining 493 constituents, an unusually wide gap that raises questions about the broader economy.
- The market’s reaction to earnings has also been noteworthy as companies are being rewarded less for beats and punished more for misses. Earnings beats have only produced an average 55 bps increase in price relative to the market the day after reporting, roughly half the 20-year average. Earnings misses have resulted in the worst average post-report underperformance since 2017. We feel this is emblematic of two dynamics. First, an unrealistically low bar was set by analysts due to the April tariff scare. This may result in analysts lifting second half estimates as we gain clarity on tariffs and how companies plan on dealing with them (pass through, shift supply chains, margin hit, etc.). Second is the price action heading into the earnings season. With the S&P 500 pushing to all-time highs and valuations stretched, investors felt that many of these stocks were “priced to perfection”. This could pose a risk to stocks should earnings not continue to surprise to the upside.
- Volatility collapsed in July as the VIX hit its lowest level since February. The MOVE Index, the bond market’s volatility gauge, recorded a reading of <80 by the end of the month, the lowest since January 2022. Accordingly, July saw no S&P 500 moves of 1% or more in either direction. We expect a pickup in volatility in August and September, historically two of the weakest months for the market. There is likely to be a tug-of-war between dip buyers and the “wall of worry” given lofty valuations, questions surrounding the health of the labor market and the economy, the Fed maintaining a patient approach on rate cuts, and ongoing policy uncertainty. Stay tuned.
Sources: Bloomberg, FactSet
From the Trading Desk
Municipal Markets
- July saw a sustained bull steepening trend that initially emerged at the end of April. The front end of the curve moved sharply lower due to tailwinds generated by optimism around Fed action, while 10-year+ portions of the curve lagged.
- Yields on the 1 to 3-year part of the curve declined by 18 bps while 5-year maturities experienced a yield drop of 14 bps. The 10-year maturity increased in yield by 6 bps, while yields rose by 13 to 15 bps from 10-years and out.
- The 2s-30s curve slope steepened 32 bps, topping the significant move in slope we saw in June. The bulk of relative steepness can be found inside of 10 years with 25 bps of steepening coming just from the 2 to 10-year portion of the curve. This shift in curve structure has fueled the positive price performance recently enjoyed by shorter maturity strategies.
- Against a backdrop of Treasury volatility, municipals followed suit, and for a 3rd month in a row relative valuation ratios closed richer in the front end than on the longer part of the curve. Specifically, 2-, 3- and 5-year AAA municipal/UST ratios declined by 4.9% – 6.7% relative to same maturity Treasuries, while and 30-year ratios largely stayed flat. Ratios closed the month at 68% over 5 years, 77% for 10 years, and 95% at 30 years.
- July tax-exempt new issuance rose to a high of $60B, while gross issuance totaled $64.1B, marking the 3rd highest month on record, according to JP Morgan. This brings the YTD tax-exempt total to $335B, up 17% over last year’s record level.
- Demand remains strong though with $2.6B of positive municipal net fund flows according to Barclays. The bulk of the +$17.3B of YTD net flows is accounted for by ETFs, inflows that have largely come at the expense of mutual funds.
Corporate Markets
- Investment Grade issuance during the month of July was unseasonably light with just $84.4 billion coming to market. It was a $15.6 billion miss on expectations and the meager $12.2 billion brought to market during the last week of the month did not help. YTD, total issuance hovers around $979 billion and the supply projection for $125 billion should tip the balance to over $1 trillion, in-line with overall expectations for this point in the year. Given this, market volatility and interest rate moves will continue to be drivers of the issuance backdrop going forward.
- Credit spreads over the month were relatively benign and stayed within a band of 1-3 bps for much of the time. The 76bps OAS end of month print on the Bloomberg US Corporate index was the low for the year and just 4 bps lower than where we began 2025. Continued uncertainty surrounding the President’s plan for global tariffs has been a focus of many market participants and has put pressure on sentiment at times. High demand and the prospect of current yield levels fading have balanced each other out.
- US Treasury rates were generally higher over the course of the month. The benchmark 10Yr bond rose 15bps to 4.38% whereas the 2Yr bond rose 24bps to 3.96%. The move in the very front end of the curve eased some of the deepening of the 6-month to 5Yr troth that has been in place for quite some time. The flattening trend during the month was, again, inconsistent, and future moves in that range will be dictated by the commentary and potential action coming out of the federal reserve.
Sources: Bloomberg, JP Morgan, Barclays, Lipper
Financial Planning Perspectives
Financial Planning Perspectives Sub-header
President Trump signed a sweeping tax and spending bill on July 4th that impacts a wide range of individual and business tax provisions, public health funding and access, and education funding, among other areas. The notes that follow solely reflect individual tax provisions of note.
OBBBA made permanent existing income tax rates and brackets established in the 2017 TCJA and also established the following provisions:
- Increased the Standard Deduction by $750 ($1,500 for married filing jointly (“MFJ”) to $15,750 ($31,500 for MFJ), while continuing to adjust the standard deduction annually for inflation.
- For taxpayers with modified adjusted gross incomes (“MAGI”) under $500,000, the State and Local Tax deduction (SALT) cap was increased from $10,000 to $40,000 for joint filers over the next five years. Beginning in tax year 2026, the SALT cap will be subject to an annual 1% inflation adjustment and phases out completely at $600,000, reverting back to $10,000.
- Child Tax Credit was permanently increased to $2,200 in 2025 and indexed for inflation on an annual basis with $1,700 refundable with adjustments for inflation.
- Estate, Gift and Generation Skipping Tax Exemption amounts were made permanent with a $15M exemption per person beginning in 2026 and will be indexed annually for inflation thereafter ($30M for married couple). Estate tax “portability” between spouses remains in place, and the same is true for IRC Section 1014 – Basis of Property Acquired from a Decedent (“step up in basis”);
- No Tax on Tips exempts tips up to $25,000 subject to an income phase out for individuals with $150,000 of MAGI and $300,000 for those married filing jointly.
- No Tax on Overtime excludes up to $12,500 of overtime income per taxpayer ($25,000 for MFJ) with income phase-outs beginning at $150,000 of MAGI for single taxpayers and AGI of $300,000 for MFJ;
- Qualified Passenger Vehicle Loan Interest Deduction provides above-the-line deductibility of interest up to $10,000 covering loans for the purchase of qualified domestically assembled passenger vehicles, subject to a MAGI phase out of $100,000 or $200,000 MFJ;
- Temporary Expanded Standard Deduction for Seniors (No Tax on Social Security) provides an enhanced exemption on up to $6,000 of income for qualifying individuals age 65 or older. The deduction is subject to phase out at $75,000 for individuals and $150,000 for MFJ and is set to expire on December 31, 2028;
- “Trump Accounts” are newly created vehicles for minors that provide an ability, beginning in 2026, to annually contribute up to $5,000 per account (on an after-tax basis). The annual $5,000 contribution limit will be indexed for inflation after 2027. All eligible children (U.S. citizens with a social security number) born after December 31, 2025 and prior to January 1, 2029 will also be eligible for a one-time federal contribution of $1,000. Distributions from these accounts are limited until the minor turns 18 years of age;
- The Alternative Minimum Tax (AMT) exemption amounts are made permanent and in 2026 are set at $500,000 and $1M (indexed for inflation).
- Annual limits for distributions from 529 Plans for qualified educational expenses (K-12) will increase to $20,000 (up from $10,000). Eligible expenses have been expanded to include tutoring, standardized testing fees, AP exams, as well as college admission exams;
- Mortgage Interest Deductibility remains limited to $750,000 of interest paid on acquisition indebtedness (no deduction of interest on home equity loans), however it is now possible to deduct mortgage interest insurance premiums; and
- Beginning in 2026, permanent above-the-line Charitable Deductions for non-itemizing taxpayers ($1,000 Single and $2,000 MFJ).
Please reach out if you would like to discuss how these changes may impact your circumstances.
For questions, please call Jim O’Neil at (617) 303-0775.
Source: “One Big Beautiful Bill Act” Public Law No.: 119-21 (07/04/2025)
This commentary reflects the opinions of Appleton Partners based on information that we believe to be reliable. It is intended for informational purposes only, and not to suggest any specific performance or results, nor should it be considered investment, financial, tax or other professional advice. It is not an offer or solicitation. Views regarding the economy, securities markets or other specialized areas, like all predictors of future events, cannot be guaranteed to be accurate and may result in economic loss to the investor. While the Adviser believes the outside data sources cited to be credible, it has not independently verified the correctness of any of their inputs or calculations and, therefore, does not warranty the accuracy of any third-party sources or information. Specific securities identified and described may or may not be held in portfolios managed by the Adviser and do not represent all of the securities purchased, sold, or recommended for advisory clients. The reader should not assume that investments in the securities identified and discussed are, were or will be profitable. Any securities identified were selected for illustrative purposes only, as a vehicle for demonstrating investment analysis and decision making. Investment process, strategies, philosophies, allocations, performance composition, target characteristics and other parameters are current as of the date indicated and are subject to change without prior notice. Registration with the SEC should not be construed as an endorsement or an indicator of investment skill, acumen, or experience. Investments in securities are not insured, protected or guaranteed and may result in loss of income and/or principal.