


Insights & Observations
Economic, Public Policy, and Fed Developments
- There seems to be a “Groundhog Day” element to writing economic commentary lately. At the start of June, we are still concerned about tariff uncertainty, as well as the scope of federal layoffs, and unless you look at the details, it is entirely possible to miss the fact that another month has passed.
- The US International Trade Court ruled on 5/28 that President Trump had no legal basis to assess tariffs using the International Emergency Economic Powers Act, and they would need to be reversed. Tariffs remain in place while the administration appeals; however, we see this as less a comment on the likelihood of a successful appeal than on simple logistics. It is easier to collect tariff revenue that will eventually be returned than to try to tariff imports well after they have arrived.
- President Trump has several other avenues available to apply tariffs, so we believe this decision prolongs rather than ends the trade war and will ultimately still be a negative for growth. We expect President Trump to be more aggressive in the use of other tariff mechanisms in the meantime, and he doubled steel and aluminum tariffs to 50% shortly after this decision. This decision also weakens the US’s negotiating position, and we see a reduced likelihood of any significant trade deals being reached until after the appeal. Interestingly, Treasury yields rose when news of the tariff decision broke and then fell when the courts announced they would be left in place during appeal. This suggests the market is more concerned with the ballooning US debt than the growth implications of restrictive tariff policy.
- The House passed the “Big Beautiful Bill Act” on 5/22, sending a Tax Cuts and Jobs Act extension and debt ceiling increase into reconciliation. There are significant differences between the House and Senate bill, including the size of tax cuts, so for now we believe specific provisions don’t matter nearly as much as the size of the contribution to the national debt. If the broad contours of the bills hold, it is likely to close the deficit by 0.1 – 0.2% from the current -6.8% of GDP, meaning the national debt will still increase, but slightly slower than before. The Congressional Budget Office’s estimate released on 6/4 puts the size of this increase at $2.4T over ten years. They also estimate $2.9T in tariff-related revenue outside the budget, so it’s at least possible that tariffs – if they were to remain in place at April levels, which is uncertain – could offset most of the additional cost of the extension. If so, the annual deficit would likely be even smaller, though still negative, perhaps in the -5% range. This is still not a great trajectory and Treasury yields rose as its passage became more likely.
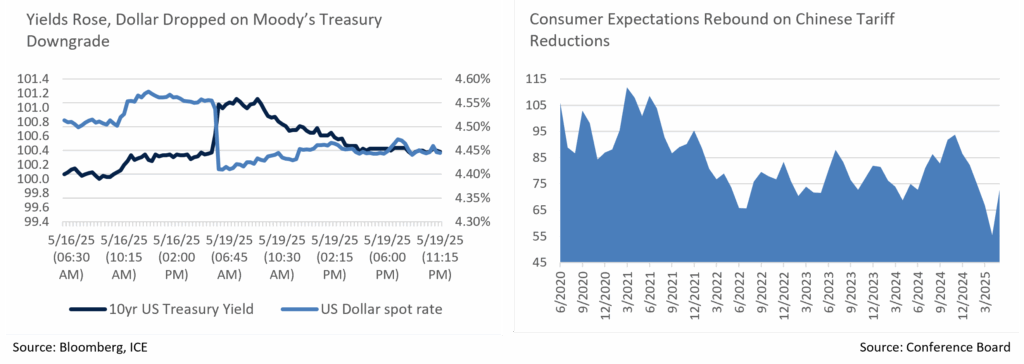
- Moody’s downgrade of the US Treasury to Aa1/Stable on 5/16 was well digested by the markets; yields rose, and the dollar fell on the news, but the moves were not large and had partially reversed by Monday’s trading. This market reaction was quite different than earlier S&P and Fitch downgrades when the dollar rose and yields fell in a flight to quality. A sovereign default is improbable for any entity that issues debt entirely in its own currency, and the downgrade reflects the possibility of the US eventually monetizing its own debt, rather than defaulting. The restrained nature of the market move suggests a very low probability of this occurring, and we remain very confident in the Treasury’s creditworthiness.
- The Conference Board’s Consumer Sentiment indicator rebounded sharply in May, from an abysmal 54.4 to a still soft 72.8. Survey responses suggested the temporary reduction in tariffs on Chinese imports as a primary driver. While on one hand these are “low information” respondents who do not carefully follow financial markets, on the other that makes them representative of most US consumers, and improvements in sentiment may support spending and keep growth from softening as much as we fear it could.
Sources: FHN Financial, Conference Board, Congressional Budget Office, Moody’s
Equity News and Notes
A Look At The Markets
- Volatility turned to the upside in May as the S&P 500 rallied +6.2%, the best month since November 2023 and the strongest May performance since 1990. After some significant swings, the index ended May in positive territory for the year at +0.5% and less than 4% from its all-time closing high. The Nasdaq outpaced the major averages with a +9.6% gain in May, although the growth-oriented index remains slightly negative (-1.0%) YTD. The DJIA posted a more modest gain of +3.9% in May and remains at a small loss for the year (-0.6%). Ten of eleven sectors were positive for the month, led by Technology (+10.8%), Communication Services (+9.6%), and Consumer Discretionary (+9.4%), homes for the much discussed “Mag 7.” With breadth once again narrowing, the equal-weight S&P 500 trailed the market-cap weighted index by 1.84% and has lost nearly all its YTD outperformance.
- Trade headlines remained front and center with markets gyrating based in part on changing perceptions of tariff severity and impact. May’s gains were fueled by a perceived de-escalation of US-China trade conflict although the eventual end game is still unknown. The S&P 500 rallied more than 3.25% on news the US had agreed to a 90-day reduction in Chinese tariffs from 145% to 30% at the same time China promised to cut their tariff assessments from 125% to 10%. This came after a deal was reached with the UK earlier in the month. While offering some reprieve for investors, the only current agreement is with the UK, although the administration has touted talks with Japan, India, South Korea, and other trading partners. Market participants are still skittish when it comes to tariff headlines as we approach the July 9th deadline of the 90-day extension.
- Bond yields have also been in focus, partially tempering the risk-on trade as yields rose across the curve. US Treasuries suffered their first losing month of the year in May with the policy-sensitive 2Yr UST leaping 30 bps, while 10Yr and 30Yr issues were each up nearly 25 bps. The bellwether 10Yr UST briefly traded above 4.5%, while the 30Yr hit 5.15%. Yields were pressured due largely to budget concerns stemming from negotiations over the so-called “One Big Beautiful Bill” that aims to extend the 2017 tax cuts and offers additional tax sweeteners. Yields are also being impacted by inflation worries stemming from tariffs, a Fed seemingly in no rush to cut the Fed Funds Rate, as well as rising overseas yields (most notably Japan).
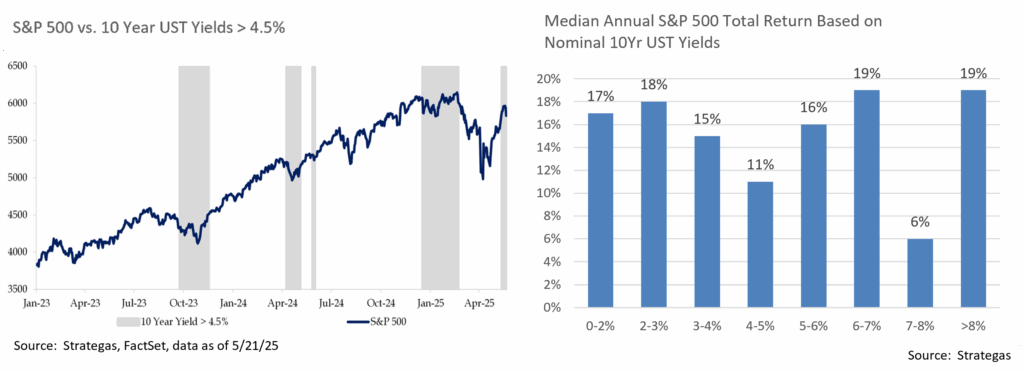
- As depicted in the accompanying graph, 10Yr UST yields above 4.5% have recently proven to be problematic over the short run for equities as they offer investors a compelling alternative to stocks, pressure valuations, and raise borrowing costs. However, history also tells us that stocks have adjusted well over time in most interest rate environments, although equities often initially stumble short term when the rate of change of yields is elevated in either direction.
- As the market works its way through a highly uncertain policy environment the fundamental picture remains supportive. The just completed Q1 earnings season was encouraging with +13.3% average S&P 500 earnings growth, though the extent of tariff impact has yet to be realized. The latest estimate for Q2 ’25 calls for healthy GDP growth of >4.5%, some of which is expected to reflect a reversal of the noisy trade data that led to Q1 weakness. “Soft” economic data drawn from sentiment and confidence surveys has rebounded, and the hard data has demonstrated resilience. The labor market, while showing signs of fatigue, is continuing to hold up. The CBOE Volatility Index (VIX) is now back under 20 and credit spreads are showing little signs of stress. Acknowledging that the market is most likely near-term overbought and due for a degree of consolidation, the bulls appear back in charge for the time being.
Sources: Bloomberg, FactSet
From the Trading Desk
Municipal Markets
- The municipal curve bull steepened during May, with the front end lower in yield by 10-15 bps and the 5-year curve dropping 18 bps. The 7-year portion of the curve saw yields fall 13 bps, while 10-years moved only marginally by 1 bp. Maturities over 10 years faced selling pressure that caused yields to rise by up to 14 bps for 30-year maturities. The 2s-30s curve slope steepened by 29 bps on the month, with 12 bps of steepening coming just from the 10 to 15-year part of the curve alone.
- Treasury yields remained volatile with upward pressure and municipals closed May richer on a relative basis. The most pronounced effects of this move impacted the front end through the belly of the curve, specifically 2 to 7-years for municipals, where ratios tightened by 4-7%. The effect was more muted with longer maturities. The 5, 10, and 30-year AAA Muni/UST ratios ended the month at 71%, 75%, and 91%, respectively. The 30-year ratio is in line with the 5-year average, and although 5 and 10-year ratios remain tighter than their historic average, today’s levels are up from prior lows, and we feel they offer an attractive entry point given absolute yields.
- May was marked by a robust primary calendar of $50B, maintaining a recent trend of high issuance. Per Barclays Research, May issuance was 6% higher than the same period last year and notably larger than the $32B average of the prior five years. May issuance brings the YTD total to $216B, an 11% increase over 2024. Municipal supply was absorbed by $3.1B of subscriptions into municipal ETFs and mutual funds, partially offsetting a surge in April redemptions. The biggest beneficiaries have been ETFs (+$7.8B YTD), while open-ended municipal mutual funds remain a laggard (-$1B YTD).
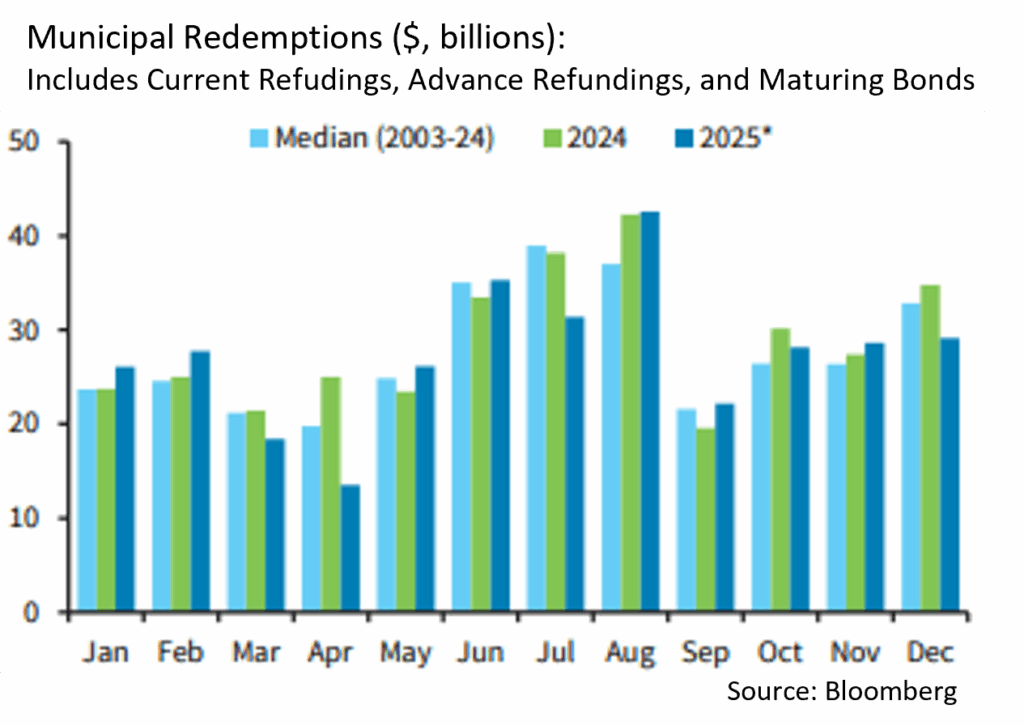
- The summer months typically see strong technicals for the muni market, as trends for the past few years have seen heightened redemptions in summer bolstering favorable supply/demand dynamics. We expect that trend to continue with CreditSights estimating redemptions for May coming in 21% higher than last year, and June, July, and August estimates totaling $149M.
Corporate Markets
- Investment Grade Corporate credit spreads have rebounded well from early April global trade-induced turbulence, tightening considerably later that month and in May. Option Adjusted Spreads (OAS) on the Bloomberg US Corporate Bond Index began May at +106 bps, down 13 bps from a YTD high of +119 bps before tightening further to 88 bps by month’s end, a level not seen since late March. We expect credit spreads to remain in their current range for some time, although short-term volatility is anticipated as policy and economic news comes forth.
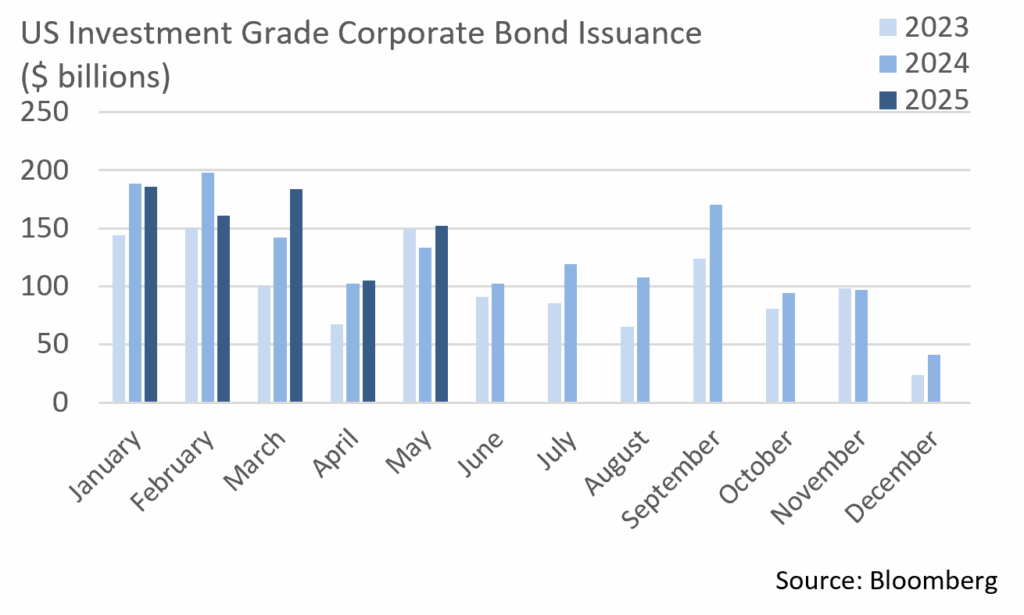
- Syndicate desks had an active month after a very slow April as issuers brought $152.5B of new debt to the markets. It was the busiest May since 2020 when $242B of new Investment Grade Corporate supply was issued. YTD issuance now stands at $788.5B, 3% above the same period of last year. The first week of June is off to a strong start and is on pace to meet expectations of $10B.
- Appetite for credit remains robust with high demand for longer dated credits. Market concessions have been limited and on par with the YTD average of only 3.5 bps. The health of risk appetite is anecdotally evidenced by certain deals enjoying negative concessions and several order books being 4x covered. Market technicals remain favorable, leaving issuers with ready access to the debt markets, and we expect corporations to take advantage over the second half of the year.
- US High Yield returns reached monthly levels not seen since July 2024 as worries eased in the aftermath of the 90-day tariff pause. The Federal Reserve also looks to be in a holding pattern for now and recession odds have once again begun to recede. All told, Bloomberg US Corporate High Yield Index yields fell from 7.90% to 7.46% in May, closing at a healthy 121 bps below its YTD high. This grind lower occurred despite pressure on Treasuries. Although we remain cautious on lower quality credit longer-term, high yield spread compression is an indication of improving economic sentiment and favorable overall market conditions for credit investors.
Sources: MMD, Bloomberg, Bond Buyer, CreditSights
Financial Planning Perspectives
Women & Wealth Management: Later-In-Life Divorce or Loss of a Spouse
Our colleague, Kelly McKernan, hosted a webinar earlier this year titled, “Women & Wealth Management: Later-In-Life Divorce or Loss of a Spouse,” that is worth revisiting given the importance of the subject.
Engaging women in the planning process in a proactive, personalized manner can be integral to their long-term financial well-being. Today’s world is quite different than it once was, a reality that we take to heart as wealth managers. A few facts and considerations that speak to the importance of ensuring that women are fully engaged in wealth management follow.
- Women face growing financial responsibilities as nearly 8 in 10 women will end up the sole financial decision-maker for their household, often for two decades or more.1
- A rising incidence of divorce among older populations is making the need for financial planning advice and investor confidence ever more pressing. In fact, 36% of those getting divorced are age 50+, double the rate of two decades ago.2
- Furthermore, according to NIH data, more than one in four people experiencing divorce in the US is at least age 50.3
As has long been the case, women tend to outlive men, and this coupled with longer life expectancy suggests that women ought to incorporate an extended time horizon into their financial plans.
- Life expectancy for American women reached 80.2 years at the end of 2022, while men live an average of 74.8 years.4
- Married women typically outlive their husbands by 15 years.5
The aforementioned webinar focused on later-in-life divorce and loss of a spouse because these are two emotionally challenging life experiences that often introduce significant financial ramifications. When these situations occur, there are immediate term, near term, and eventually longer-term planning implications.

Our approach to these complex matters starts with ensuring that clients understand that they do not face such decisions alone. We start by gaining an understanding of your personal situation and emotional needs. Each client’s circumstances are different, and there are few “right or “wrong” answers. We also actively engage with our clients’ family members, as well as professionals such as attorneys, accountants, and insurance agents. Other resources such as AARP, the Social Security Administration, Medicare.gov, and HealthCare.gov. also offer valuable information.
Above all, we’re here for you and encourage an open dialogue. Should you feel any family members or friends also might benefit from working with Appleton Wealth Management, please let us know.
1. CNBC.com, 4/27/2022
2. American Psychological Association, “More Couples Are Divorcing After Age 50 Than Ever Before”, Nov. 2023
3. NIH.gov, “The Graying of Divorce”, 4/6/22
4. McKinsey & Co. and Allianz Life Insurance, “Women, Money and Power”, 2008
5. AARP.org, “Financial Planning for the Loss of a Spouse”, 2022
This commentary reflects the opinions of Appleton Partners based on information that we believe to be reliable. It is intended for informational purposes only, and not to suggest any specific performance or results, nor should it be considered investment, financial, tax or other professional advice. It is not an offer or solicitation. Views regarding the economy, securities markets or other specialized areas, like all predictors of future events, cannot be guaranteed to be accurate and may result in economic loss to the investor. While the Adviser believes the outside data sources cited to be credible, it has not independently verified the correctness of any of their inputs or calculations and, therefore, does not warranty the accuracy of any third-party sources or information. Specific securities identified and described may or may not be held in portfolios managed by the Adviser and do not represent all of the securities purchased, sold, or recommended for advisory clients. The reader should not assume that investments in the securities identified and discussed are, were or will be profitable. Any securities identified were selected for illustrative purposes only, as a vehicle for demonstrating investment analysis and decision making. Investment process, strategies, philosophies, allocations, performance composition, target characteristics and other parameters are current as of the date indicated and are subject to change without prior notice. Registration with the SEC should not be construed as an endorsement or an indicator of investment skill acumen or experience. Investments in securities are not insured, protected or guaranteed and may result in loss of income and/or principal.