


Insights & Observations
Economic, Public Policy, and Fed Developments
- Backward-looking data is rarely market-moving, but what made September’s GDP revisions especially interesting are the way they called into question 2025’s prevailing narrative. While the headline growth rate of 3.8% alone would be noteworthy, the details are now significantly stronger. An initial final sales to private domestic consumers of 1.2% had already been revised to 1.9% in the second estimate but rose an entire point further to 2.9%. Business fixed investment surged as well, notably equipment (+7.4% to +8.5%) and intellectual property (+12.8% to +15.0%) spending. The prevailing wisdom has been that consumers and businesses have been holding back on spending due to tariff uncertainty; this is now harder to argue. On-again, off-again tariff implementation and a massive AI investment that likely was always going to be directed inside the US (and therefore less susceptible to sudden tariff changes) do add some nuance here, but economic growth in the second quarter is now unquestionably more robust than it looked at first blush.
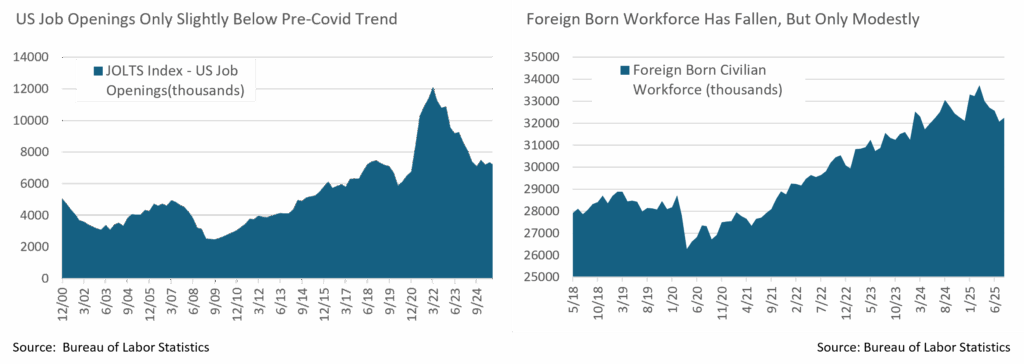
- What’s interesting is that it’s now even harder to align this strong growth with anemic hiring. A federal government shutdown meant we did not get a September Nonfarm Payrolls report at the start of October, but the most up-to-date data shows barely positive hiring over the late spring and summer. The two leading theories for this are that a sharp reversal in immigration trends means very few new jobs are needed to maintain full employment, or that AI is boosting productivity so significantly that companies don’t need to hire. Jobs opening data suggests worker demand is perhaps slightly below the pre-covid trendline, and the foreign-born workforce has fallen somewhat, but neither is conclusive. Given this, we don’t have the full picture yet, and in all cases, the disconnect between growth and hiring bears watching.
- To little surprise, with their first cut of 2025, the Fed cut rates 25bps in their September meeting. Their “Dot Plot” suggests two further cuts are on the way before year-end, though with a caveat: the median dot is two cuts, but with two large clusters, one at two cuts, the other at zero cuts. In other words, relatively modest surprises in incoming data could shift the consensus considerably.
- This is a problem for the Fed, though, in that it’s unclear when we will actually get that data. The Bureau of Labor Statistics (payrolls, CPI, PPI), Census Bureau (retail sales), and Bureau of Economic Analysis (GDP, PCE) will not publish economic releases as long as the federal shutdown that began on 10/1 persists. These are critical releases coming at a crucial moment for the Fed.
- It’s difficult to predict how long this shutdown will last, but there is at least a risk that it could be extended. There is no single policy at the heart of this shutdown that might drive negotiation, unlike 2018 and 2019’s border wall or 2013’s ACA. The debt ceiling does not need to be raised, taking some urgency off negotiations. Democrats appear to have been caught flat-footed in opposition, and if they don’t fold quickly, they will likely require a tangible win to pass a continuing resolution. The Trump administration’s relationship with the media has grown contentious, robbing them of a traditional source of leverage against the opposition party. With continuing resolutions subject to filibuster but federal budgets not, it’s possible the Trump administration may choose to simply focus on a budget rather than temporarily extend funding, which would likely drag the shutdown into November. The direct market implications of this will be less severe than in past shutdowns, thanks to the absence of a debt ceiling showdown; however, it will certainly complicate the Fed’s job, as it will have to assess the appropriate level of rates while essentially flying blind, without access to economic data.
Sources: Bureau of Economic Analysis, Bureau of Labor Statistics Federal Reserve
Equity News and Notes
A Look At The Markets
- Stocks were higher last month as the S&P 500 advanced +3.5%, to give the index its 5th monthly gain in a row. September’s gains leave the S&P 500 up +13.7% for the year and an impressive +34.2% off the April 8 closing low. Since 1950, the S&P 500 has gained >30% over a 5-month span only 5 other times, with a median gain of +14% over the ensuing 12 months. The S&P 500 bucked the historical trend of September being the worst month of the year (avg since 2000: -1.5%) as the index enjoyed its best September in 15 years. Technology and Communication Services stocks led the way higher, leading to outperformance from the Nasdaq (+5.6%). The Materials and Consumer Staples sectors were laggards on the month, partially due to stickier inflation and the overall risk-on tone.
- Small-cap stocks continued to surge with the Russell 2000 gaining +3% for the month to also push its monthly win streak to 5. Notably, the small-cap index made its first all-time high (ATH) since November 2021, and all four major US indexes hit ATHs on the same day, marking only the 26th time in the past 25 years. Despite the positive move in smaller stocks, breadth narrowed in September as the equal-weight S&P 500 underperformed the cap-weighted index by nearly 300 basis points. September’s outperformers were mostly found in larger stocks, illustrated by the Mag 7’s +9.0% monthly gain. Concentration risk remains top of mind as the top 10 companies in the S&P 500 now represent 40.4% of the overall index.
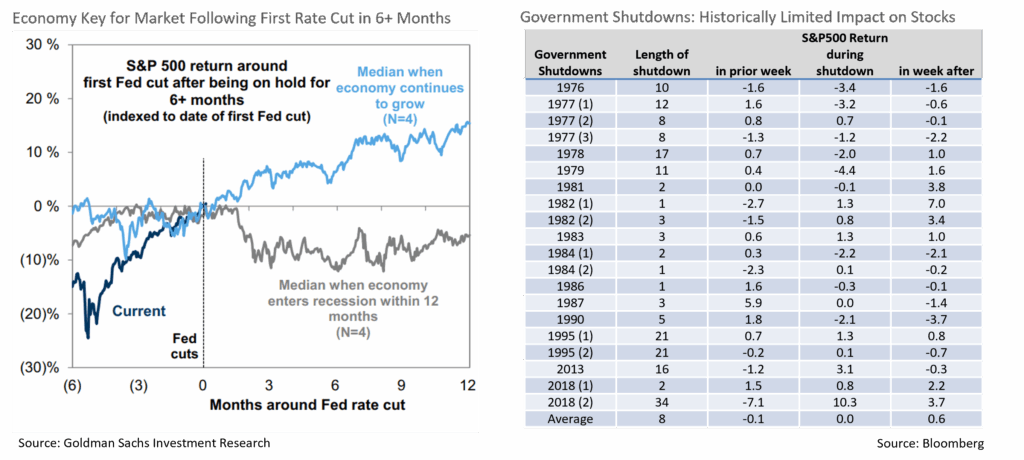
- September’s upside was driven by several factors, including economic resilience despite a slowing labor market, with the Citi Economic Surprise Index hitting its highest level of the year. The AI story continues to unfold with enthusiasm still outweighing concerns over valuation, capex, and increased competition. The biggest driver was the September FOMC meeting, where the Fed delivered its first rate cut since Dec 2024, but more importantly, signaled the possibility of 2 more cuts by year-end. Some investors have questioned why the Fed would cut rates with a hot stock market, but a study from JP Morgan showed that the Fed has cut rates with equities within 1% of record highs 16 times in history, with average gains of +15% over the following year. We believe putting the cut into the context of the economy and the potential for a recession is crucial, as shown below. Over the past 40 years, the market has gained an average of +15% (albeit a small sample size) in the year following a resumption of cuts, absent a recession. Our base case is for no imminent recession, given current quarter GDP expectations of +3.8%, the most recent retail sales beat, earnings growth of 7.7% expected in Q3, cap ex spending, S&P 500 operating margins at highs, productivity growth, and the wealth effect of stocks and housing sitting at highs.
- As we move into early October, a risk worth watching is the government shutdown, which began at midnight on Oct 1 and continues as of this writing. Ironically, the threat of government job cuts is likely to further fuel the expectations for further Fed rate cuts, providing a potential lift for risk assets. We will be monitoring the situation closely, as it likely lasts longer than the historical average of 8 days. Away from the shutdown, we remain constructive on equities and would use any volatility or weakness to add to positioning. As shown below, government shutdowns tend to be relative “non-events” with little impact on financial markets in the longer-term.
Sources: Bloomberg, FactSet
From the Trading Desk
Municipal Markets
- The month of September was characterized by a significant curve flattening, with rates on the front end moving higher and the intermediate to long end posting a strong rally. This led to September registering solid positive total returns, particularly 7-years and longer on the curve. Yields increased by 20 to 6bps in the 1 to 3-year part of the curve, respectively, while in the 5 to 7-year part of the curve, yields were lower by 5 to 17bps. The most meaningful rally, however, occurred 10-years and out, where yields dropped consistently and closed out the month lower by 30 to 39bps.
- The net result of these contradictory yield moves resulted in a significantly flatter curve slope than what we had seen a short while ago. At the end of September, the 2s-30s slope stood at 194bps, flatter by 47bps during the month, while the 2s-10s part of the curve flattened 40bps to close the month at an absolute 62bps, a significant reversal of the early summer’s continued steepening. Our bell-shaped curve positioning, avoiding the richest part of the curve (i.e., inside of 5 years) and extending durations systematically via bond purchases out to the 12-year part of the curve, has opportunistically set up our core strategies to take advantage of this market move.
- Municipal ratios diverged on the month, with 2- and 3-year ratios widening by 3% and 1%, respectively, while all points on the curve from 5-year maturity and out saw ratios tighten by 2 to 5.8%. Ratios out to 3 years settled at approximately 63%, while 5- and 10-year ratios closed the month at an absolute 62.12% and 70.65%, respectively. The 30-year maturity also saw just inside of 4% of tightening and closed the month at 89.51%
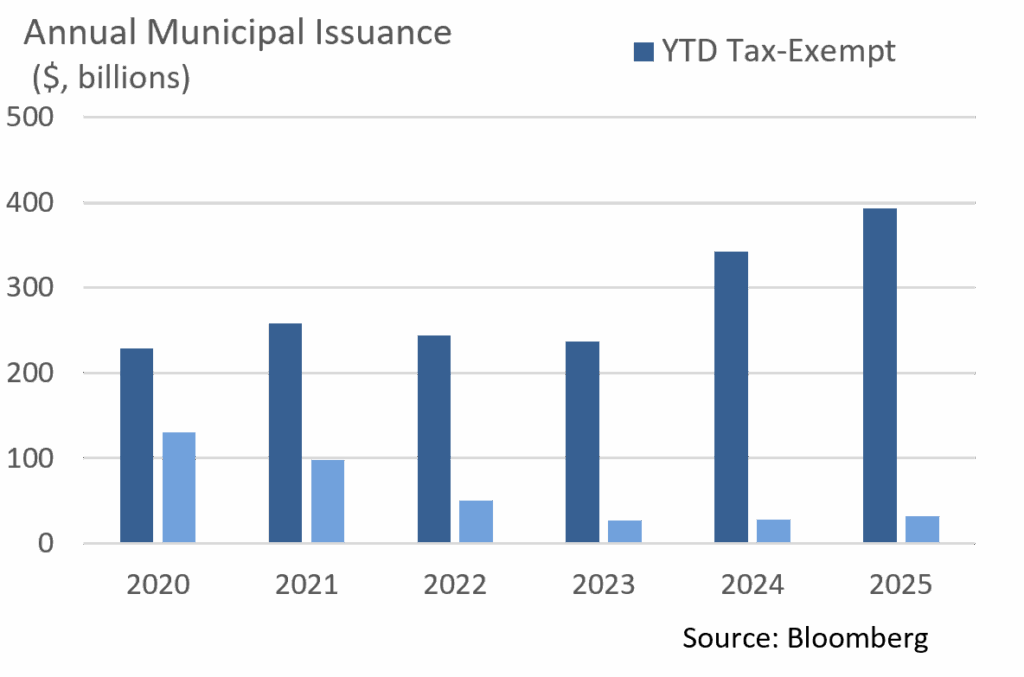
- According to JP Morgan, September gross issuance totaled $47B, modestly below August’s $48B. This exceeded the 5-year average of $40B by 18%, with tax-exempt supply coming in at $44B, also solidly ahead of pace relative to the 5-year average. This brings the YTD gross supply to $424B, while the tax-exempt issuance total is $393B, ahead of last year by 15%. Expectations are for issuance to continue to outpace that of 2024 through the end of the year, with some dealers upsizing their beginning of the year issuance calls.
Corporate Markets
- Given the macro headlines, the incredible resiliency of US Investment Grade credit spreads continues as levels remain intact. The 74bps OAS print on the broader Bloomberg US Corporate IG index is just 2bps of the YTD high set on 09/19/25. This was also the lowest point since March 1998, and well below the 30-year average of 137bps. With that said, the technical backdrop for credit continues to be strong, and the persistence of an active participant pool will likely continue. We feel that IG credit spreads will be range-bound in the near term. Event risk remains a top focus for the markets, and any major thematic pressure could push spreads a little higher.
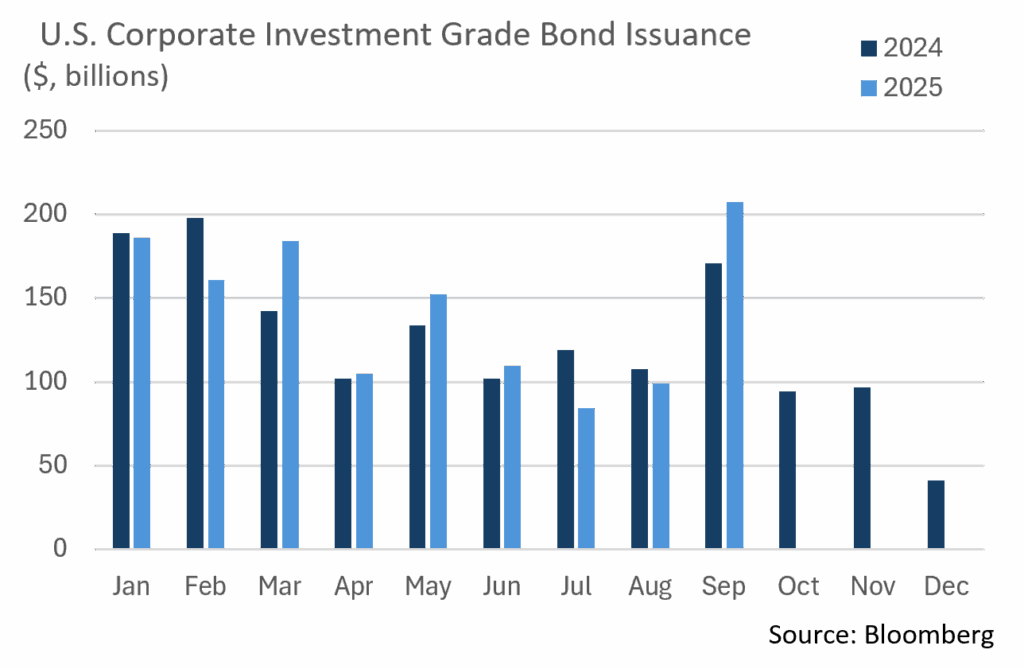
- Amid this positive technical backdrop, issuers are taking full advantage of continued demand. The $207.5 billion in issuance in September makes it the largest month of the year, the largest September overall, and the 5th largest month on record. This September’s primary market was strong, and we are on track to reach the YTD target and may possibly surpass it. Given some of the headline news at times, we have seen concessions on new deals at low levels and order books that are several times higher than bonds that are available. Expectations for new debt in October are roughly $90 billion, but this momentum could shatter that number.
- Demand for credit is trickling down the credit spectrum as the high yield (HY) primary market closed September with $57.6 billion in new debt, the largest month since 2020, the biggest September, and the third largest month on record. The overall level of HY yields continues to be attractive for some investors. However, the level at which HY credit spreads have decreased is tightening the risk/reward relationship. The HY market reacts more aggressively as volatility creeps into the market and, while the backdrop remains on solid footing, that could change quickly. We continue to feel that high quality may offer the best risk/reward considering any potential changes in the macroeconomic environment.
Sources: Bloomberg, JP Morgan, Barclays, Lipper
Financial Planning Perspectives
Year End Tax Planning Strategies
As the calendar turns to October and the fourth quarter of 2025, we recommend that clients begin thinking about year-end tax planning strategies. Many clients have asked recently what they can do before the year is out to increase their retirement savings, take advantage of charitable efficiencies, or look for other tax-reducing strategies. Here are some ideas to consider.

Maximize Retirement Contributions, Including Potential Catch-Up Provisions
401(K) and 403(B) Limits for 2025:
The maximum contribution amount is $23,500, although catch-up provisions are available for those over certain age thresholds:
- 50+ years: catch up provision of an additional $7,500
- 60-63 years: catch up provision of an additional $11,250.
Striving to reach these limits allows one to put aside considerably more money on a tax-deferred basis.
Traditional and Roth IRAs
The maximum contribution limit is $7,000, plus an additional $1,000 if you are over age 50.
Consider a Roth conversion
If your income bracket is lower this year than you expect it to be in upcoming years, it may be a good time to convert IRA funds from a traditional IRA to a Roth. Doing so subjects funds to current year taxation but allows you to later withdraw on a tax-free basis. This can reduce the long-term impact of taxes on retirement fund withdrawals.
For example, a client whose annual alimony payments ended resulted in her dropping from the highest tax bracket to the lowest. Given this change in circumstances, the time was optimal to convert to a Roth IRA structure. Another client transitioned from full-time to part-time work, a change that provided an opportunity to make a conversion in a year in which this individual’s effective tax rate had been reduced.
Examine your Charitable Giving Strategies
For those over age 70½, a qualified charitable distribution (QCD) up to $108,000 from your IRA can be excluded from gross income. Once an individual reaches age 73, charitable contributions will offset all or a portion of their required minimum distributions (RMDs).
We frequently advise clients to also factor market conditions into their tax management thought process. The stock market has generated outstanding returns over the past 2 ½ years, an environment that suggests gifting low tax basis stock rather than cash may be appropriate. Doing so helps fund your philanthropic objectives while also avoiding a potentially sizeable capital gains tax should you instead sell those shares.
With any charitable contribution, remember to make desired donations before December, as many organizations close a week or two before year-end, and you do not want to risk missing the 2025 cut-off.
Fund your Health Savings Account (HSA)
HSAs are an extremely attractive benefit option that offers a triple tax advantage. Contributions are made through pre-tax payroll deductions; account balances, earnings, and interest grow tax-free; and qualified medical expenses can be reimbursed from these accounts through tax-free withdrawals.
The 2025 limits for HSAs are $4,300 for individuals and $8,550 per family.
Before you make any changes of this nature, we recommend speaking with your Appleton Wealth Manager and a tax professional. Reach out with any questions on this or other financial planning needs, and best wishes for the upcoming holiday season.
Source: Internal Revenue Code and Certified Financial Planner Board of Standards, Inc.
This commentary reflects the opinions of Appleton Partners based on information that we believe to be reliable. It is intended for informational purposes only, and not to suggest any specific performance or results, nor should it be considered investment, financial, tax or other professional advice. It is not an offer or solicitation. Views regarding the economy, securities markets or other specialized areas, like all predictors of future events, cannot be guaranteed to be accurate and may result in economic loss to the investor. While the Adviser believes the outside data sources cited to be credible, it has not independently verified the correctness of any of their inputs or calculations and, therefore, does not warranty the accuracy of any third-party sources or information. Specific securities identified and described may or may not be held in portfolios managed by the Adviser and do not represent all of the securities purchased, sold, or recommended for advisory clients. The reader should not assume that investments in the securities identified and discussed are, were or will be profitable. Any securities identified were selected for illustrative purposes only, as a vehicle for demonstrating investment analysis and decision making. Investment process, strategies, philosophies, allocations, performance composition, target characteristics and other parameters are current as of the date indicated and are subject to change without prior notice. Registration with the SEC should not be construed as an endorsement or an indicator of investment skill, acumen, or experience. Investments in securities are not insured, protected or guaranteed and may result in loss of income and/or principal.