


Insights & Observations
Economic, Public Policy, and Fed Developments
- For the second straight year, the biggest economic news of August came in Jerome Powell’s Jackson Hole testimony. In a speech taken as dovish (likely more so than he intended), Powell brought the Fed’s dual mandate back into balance after an extended period in which the price stability mandate dominated. And, while the Fed remains concerned over inflation in the pipeline, Powell painted labor market weakness as a more immediate risk. In response, futures markets fully priced in a September cut.
- They will most likely not be disappointed. But the Fed will be data dependent, and given where they see risk, we expect employment data will outweigh inflation in solidifying a September cut. The Nonfarm Payrolls release on 9/5 will be critical, but the BLS Preliminary Benchmark Revision to the Establishment Survey on the 9th is the biggest wildcard for policy rates. There’s a very loose consensus that this will be a large negative revision, similar to last year’s. The last revision was driven by the business “birth/death” model overstating business formation and a sizable influx in immigrant workers. We expect little change in the former, but with the latter having reversed sharply in 2025, there is high uncertainty around this revision. Most likely, as expected data would lock in a cut in September, but upside surprises could allow the Fed to hold.
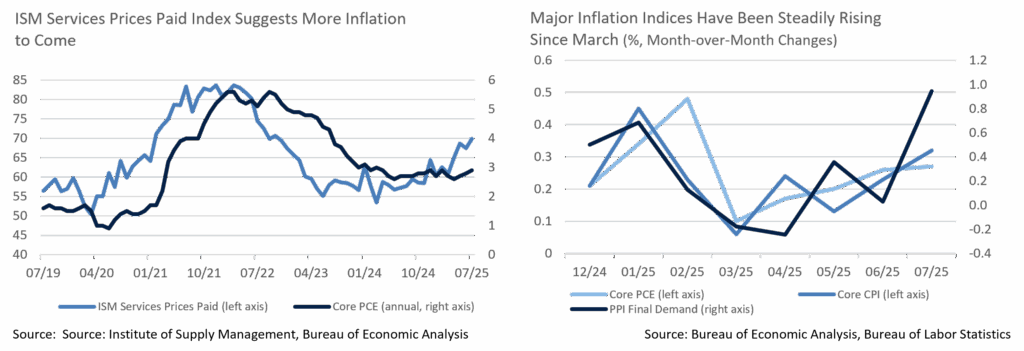
- We do not think an upside surprise to inflation on its own is likely to stop the Fed from cutting. That’s too bad, because there’s growing evidence that tariffs have begun flowing into inflation data. After bottoming in March, CPI, PPI, and PCE have been accelerating, and after a few months of goods price pressures, all three experienced an unexpected pop in services prices in July. PPI was the hottest print in three years, driven by substantial trade services contributions. There’s a plausible case to be made this represents companies protecting margins via preemptive price increases. The ISM Services PMI Prices Paid sub-index is worrisome as well; this is a reliable leading indicator for core inflation and hit its highest level since Covid in July. We think the bar for August CPI inflation stopping a Fed cut is extremely high, but a hot print may slow the pace of future reductions more than the market now expects.
- Tariffs continue to be murky. Courts ruled at month’s end that Trump’s use of the International Emergency Economic Powers Act was unconstitutional, though the case was sent back to the Court of International Trade to determine if tariffs should be rolled back broadly or only for the case plaintiffs. Most likely, this significantly extends uncertainty around tariff levels; Trump has appealed to the Supreme Court for an expedited ruling. Meanwhile, in mid-August, Trump doubled tariffs on India, a country with an early negotiated deal, over allegations they have been buying and reselling Russian oil. Steel and aluminum tariffs were also unexpectedly broadened to include goods containing the materials, notably with no in-transit exemption, shocking importers.
- We have recently seen more encouraging economic data. July retail sales technically missed, but on the back of large prior period upwards revisions, so the nominal level of spending was better than expected. And, in the first Q2 GDP release, we had pointed to the decline in Final Sales to Private Domestic Purchasers to +1.2% as being of concern. In the second release this was revised up to +1.9%, unchanged from Q1. Demand is still a little weak, but it appears to be holding stable, which is encouraging.
- President Trump shifted gears in his campaign to induce the Federal Reserve to cut rates, attempting to fire Lisa Cook for alleged improprieties in mortgage applications. Cook has vowed to stay on and fight; the President can fire her for cause, but this will likely require a conviction. Unless she steps down voluntarily, which appears unlikely, we expect a long fight and lingering concerns over Fed independence.
Sources: Bloomberg, Chicago Board of Trade, Bureau of Labor Statistics, Bureau of Economic Analysis, Bureau of Labor Statistics, Institute of Supply Management, &US Census Bureau
Equity News and Notes
A Look At The Markets
- Stocks moved higher in August as the path of least resistance was skewed to the upside for risk assets. The S&P 500 gained +1.9%, closing above 6,500 for the first time on the penultimate trading day of the month. The Nasdaq gained +1.6%, its fifth straight monthly gain, and set its own all-time high earlier in the month. The DJIA outperformed, posting a gain of +3.2% in August, and reached an all-time high. Nine of the eleven sectors were higher led by Materials and Healthcare, both of which posted gains >+5%. Utilities were the laggard with a -2.0% loss as the risk-on bias didn’t favor more defensive sectors.
- We would point to several bullish influences in explaining August’s strength. Corporate earnings came in better than expected, a resilient consumer continued to spend, and trade uncertainty lessened as sporadic headlines of trade deals and tariff pauses trickled in. However, the two factors that we believe played the largest role were growing expectations for a Fed Funds rate cut, and an accompanying breadth expansion. Coming into the month, market odds showed only a 40% chance of a rate cut in September, but a weak jobs report immediately ratcheted those odds up to ~90%. Stubborn inflation data pushed the futures-derived likelihood back to 70%, but Chairman Powell’s Jackson Hole speech leaned dovish as he noted downside risks to the labor market. Following Powell’s “pivot,” cut odds once again rose to 90% and the S&P gained over +1.5%.
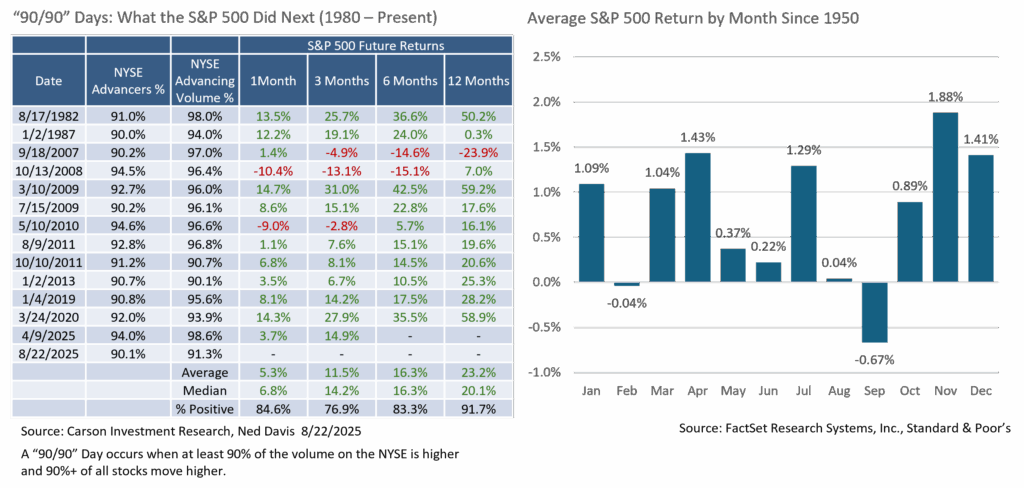
- With growing prospects of a Fed cut, investors leaned into smaller stocks and cyclical names, both of which tend to be levered to the domestic economy and lower rates. The equal-weight S&P 500 made its second all-time high of the year and outperformed the market-cap weighted index by 81bps. The Russell 2000, the leading small-cap stock index, had its best month (+7.0%) since November 2024. Over 70% of S&P 500 stocks were trading over their respective 200-day moving averages at month’s end, the best reading of the year. Following Powell’s remarks at Jackson Hole, NYSE trading was decidedly one-sided with 90% of issues moving higher and 90% of the total volume to the upside. Since 1980, such ”90/90” days have only occurred 14 times, 13 of which were followed by positive forward returns. These breadth thrust metrics are reassuring relative to sustaining this bull market and a factor likely to lower the odds of a major market top.
- In terms of risks, we are evaluating several factors heading into the fall season. Chief among them is the health of the consumer, which largely depends on the labor market. Jobless claims have moved higher, and the last jobs report was objectively poor, putting the burden on the upcoming report. Geopolitical and trade headline risk remain constant, and any tariff impacts have likely yet to be fully realized. Inflation reports also bear watching as upward pressure could put the Fed in a tough spot, jeopardizing further cuts after September’s meeting.
- Lastly, the calendar poses a threat as September has historically been the worst month for stocks. Given the run we’ve enjoyed since early April, and being mindful of elevated valuations and stretched positioning, we wouldn’t be surprised to see a seasonally appropriate pause coming, but do not foresee a sustained downturn at this stage.
Sources: Bloomberg, FactSet
From the Trading Desk
Municipal Markets
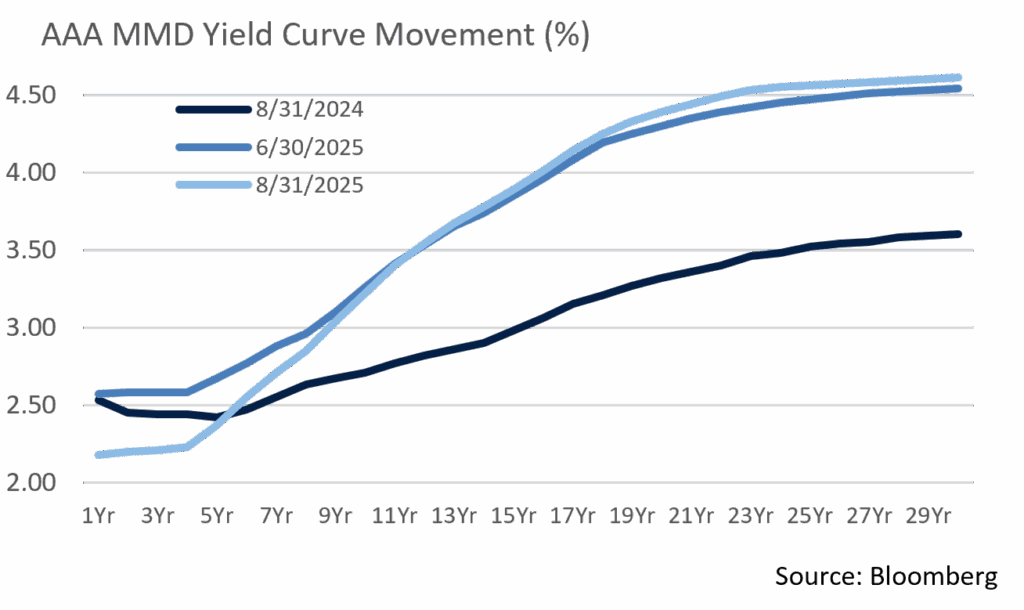
- Municipal yields sustained the downward trajectory that we have witnessed since the end of May over the course of August. The drop in yields was consistent across the curve, though more pronounced for maturities inside of 10 years. Specifically, the 1 to 3-year part of the curve saw yields decline by 19 to 21bps, while 5- to 7-year yields fell by 14 to 16bps. Maturities of 10 years and longer, recent laggards amid a summer bond rally, rallied as well, with strong demand causing yields to fall by 10 bps on the AAA 10-year and 6 to 9bps for longer maturities.
- The curve continued steepening, albeit at a slower pace relative to recent months. At the end of August, the spread between 2s and 30s stood at 241 bps, up another 13bps after steepening by 32bps in July. As was the case in July, the bulk of the steepening move has been felt with maturities of up to 10 years as 2 to 10-year issues account for 9bps of the 13bps steepening incurred in August.
- According to JP Morgan, August gross issuance totaled $48B, exceeding the 5-year average by 16%, while tax-exempt supply came in at $45B, exceeding the 5-year average by 34%. This brings the YTD gross supply to $378B, while the tax-exempt issuance total is $348B. According to JP Morgan, September supply is expected to total approximately $46B, but with less reinvestment support from anticipated redemptions; therefore, technicals could prove to be challenging in the coming months, especially when overlayed with market-driving economic data that could inject additional volatility into the markets at large.
- While the summer months are traditionally constructive for municipals due to outsized amounts of principal and coupon payments coming back into the market, this summer’s strong issuance more than kept pace with the typical reinvestment trend. The steepness of the curve and the relative attractiveness of municipal yields, particularly north of 10 years, coupled with macro factors such as a slowing labor market, led to revised expectations of upcoming Fed rate cuts and provided strong momentum for municipals during August.
Corporate Markets
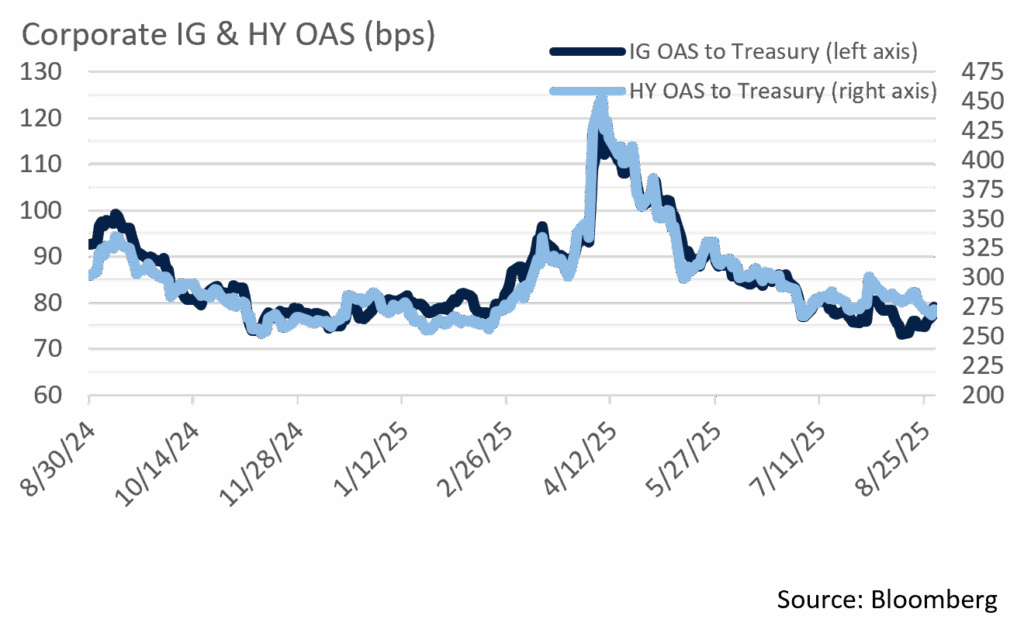
- Unlike last month’s rangebound spread environment, the trajectory of US Investment Grade Credit spreads spiraled down to YTD lows in August. In fact, the 73 OAS printed on the 15th for the Bloomberg US Corporate Bond Index was the lowest level since March 1998. Similarly, high yield spreads moved lower by 6bps point to an OAS of 272 to end the month. Due to corresponding movement in US Treasuries, the YTW on the Bloomberg US High Yield Index fell to 6.75%, a low that has not been seen since April 2022.
- Spread direction suggests that investors are reaching for yield as reductions in the Fed Funds rate are close to being initiated. As a result, the market is feeling pressure on both ends of the yield curve. We do not see a great deal of impact forthcoming in terms of credit spreads, although given the amount of issuance expected, there could be near term widening before the end of Q3.
- The pace of Investment Grade issuance was slower than the previous couple of months, although the backdrop for issuers remains strong. The $99B of new debt brought to market in August was in line with the $90-$100B estimated by syndicate and also right on the 5-year average of $100B. Year-to-date issuance reached $1.079 trillion, a sizeable level relative to historic norms. This is 1% lower YoY yet remains on track to easily hit the market’s $1.5 trillion expectation for 2025.
- The cost of bringing new debt to market is quite low for issuers as concession spreads are minimal, spreads are hovering around 20+ year lows, and demand for high quality credit is robust. Of YTD issuance, 46% has been in the financial sector, which collectively accounts for 44% of the single A ratings category. From a maturity perspective, 27% of YTD issuance comes from the 5 to 7-yr part of the curve, while 31% was issued in 10 to 30-year maturities. As anticipated, September issuance began with an increase in companies coming to market and we feel that the favorable backdrop enjoyed of late by issuers will remain strong.
Sources: Bloomberg, JP Morgan, Barclays, Lipper
Financial Planning Perspectives
Pet Trusts: Lifetime Planning Arrangements for Spike

Millions of Americans own pets and often consider them to be an integral part of the family. In 2024, according to the American Veterinary Medical Association (AVMA), nearly 60 million US households owned a dog, while 42.2 million had a cat. Given the affinity Americans hold for our pets, it’s not at all surprising that we spend an average of $580 annually on veterinary care per household for dogs and $433 for cats. Whether these costs relate to basic needs such as food and bedding, supplies and toys, or medical care, funding pet care is a common household expense. In fact, families are expected to spend $157 billion on their pets in 2025.1 The pet health insurance industry, once a relatively minor part of the overall insurance industry, has grown dramatically. As reflected in the 2024 figures, over $4.7 billion was spent on pet health care insurance, more than double the pre-COVID 2020 period.2
Many individuals have concerns as to what will happen to their beloved pet(s) when they are no longer physically able to provide care, whether due to illness, moving to a nursing home, or when they eventually pass away. As a response to these longstanding concerns, all 50 states have now passed laws allowing pet owners to make legally binding financial arrangements to provide for their pets. These so called “pet trusts” are widely used on a nationwide basis, as pet owners can gain the peace of mind of knowing their pets will have a legally secured future.3
These legal arrangements for the ongoing care of a pet, made during life by way of a trust or upon death by way of a trust created per the terms of a last will and testament, involves the pet owner(s) creating a trust as the “Grantor.” These Grantors name a caregiver for the pet and a Trustee who will provide financial and legal oversight of the trust assets and ensure the terms of the trust are adhered to by the caregiver. The Grantor may include precise language in the trust as to how the pet is to be provided for in the in future (specifying such matters as routines and schedules, feeding, compensation for the caregiver, veterinary care and final arrangements).
While state laws vary as to amounts that can be placed into pet trust, they are virtually identical in that a trust can be established for a domestic animal or animals (some include an animal in gestation when the trust was established) and will terminate upon the death of the animal or animals identified by the terms of the trust. Furthermore, provisions of the pet trust govern how the assets are distributed upon the death of the pet or pets.
Although it may sound a bit out of leftfield, the reality is that many people are creating pet trusts as an element of their overall estate planning. If you are interested in learning more, please call Jim O’Neil at (617) 303-0775.
- American Pet Products Association (APPA)
- American Veterinary Medical Association (AVMA)
- A complete list of state laws can be found at the ASPCA website: https://www.aspca.org/pet-care/pet-planning/pet-trust-laws
This commentary reflects the opinions of Appleton Partners based on information that we believe to be reliable. It is intended for informational purposes only, and not to suggest any specific performance or results, nor should it be considered investment, financial, tax or other professional advice. It is not an offer or solicitation. Views regarding the economy, securities markets or other specialized areas, like all predictors of future events, cannot be guaranteed to be accurate and may result in economic loss to the investor. While the Adviser believes the outside data sources cited to be credible, it has not independently verified the correctness of any of their inputs or calculations and, therefore, does not warranty the accuracy of any third-party sources or information. Specific securities identified and described may or may not be held in portfolios managed by the Adviser and do not represent all of the securities purchased, sold, or recommended for advisory clients. The reader should not assume that investments in the securities identified and discussed are, were or will be profitable. Any securities identified were selected for illustrative purposes only, as a vehicle for demonstrating investment analysis and decision making. Investment process, strategies, philosophies, allocations, performance composition, target characteristics and other parameters are current as of the date indicated and are subject to change without prior notice. Registration with the SEC should not be construed as an endorsement or an indicator of investment skill, acumen, or experience. Investments in securities are not insured, protected or guaranteed and may result in loss of income and/or principal.