


Insights and Observations
Economic, Public Policy, and Fed Developments
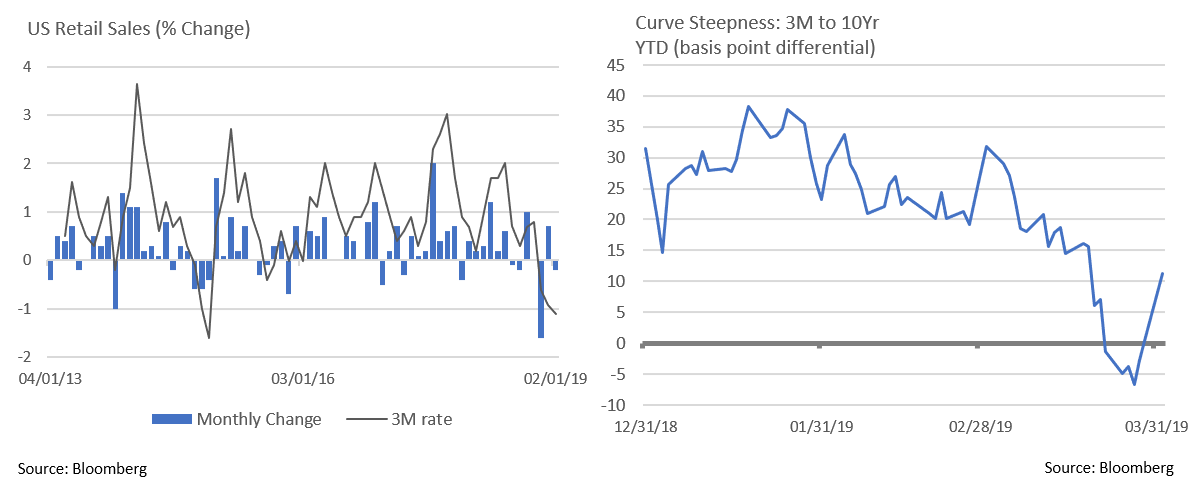
- Evidence of a global slowdown continued to mount in March. A sharp deceleration in retail sales in December was revised further downward and followed by weakness in January and February. Consumer spending restraint is weighing on the economy’s ability to meet the Fed’s 2% inflation target. Core PCE, the Fed’s preferred inflation measure, slowed to 1.8% over the trailing year. The government shutdown likely bears some responsibility, although there was a clear deceleration in Q1 consumer spending.
- Q4 GDP growth was also revised downward from 2.6% to 2.2%, inside our expected 2-2.5% range and in line with the original Bloomberg consensus estimate. This brings full-year growth to 2.9%. With a buildup in inventory, consumer spending weakness, and tepid Fed Beige Book readings, consensus Q1 ’19 estimates have fallen to roughly 1.5%. With tax cut-driven fiscal stimulus wearing off, the US economy seems to be returning to its post-crisis trendline 1.5-2% growth. Absent an unexpected acceleration in inflation, this should keep a lid on interest rates.
- After unexpectedly weak German PMI data spooked the markets, the US Treasury curve inverted in March, with the 10Yr yield dropping below the 3-month for the first time since 2006-07. This is considered an indicator of a forthcoming recession, although we suggest taking this with a grain of salt. The inversion was brief, yields are at much lower absolute levels than previous inversions, and quantitative easing has depressed long-term rates. Nonetheless, the curve reflects market uncertainty, with investors willing to pay a premium to lock in a risk-free rate for longer.
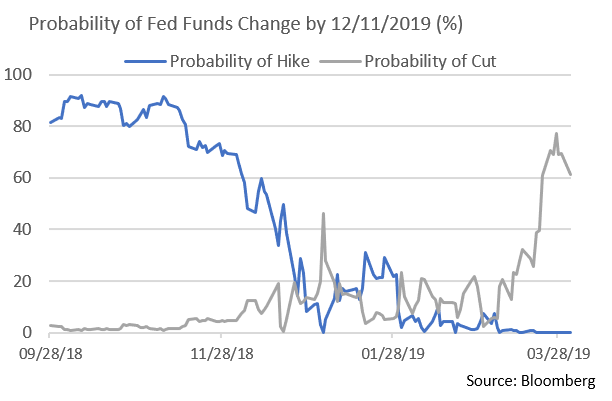
- We have also seen a sharp change in Fed Funds Rate expectations. The likelihood of a Fed Funds cut by year-end increased sharply to 64% as of 3/31, with more than a 22% probability of two or more cuts. This is a radical shift from the end of 2018 when odds of a hike or cut were low and about even.
- The trade picture remains murky. Trade talks between Trump and Xi were delayed until “at least April.” The Wall Street Journal reports that talks are in their final stages; however, Bloomberg suggests growing concern about Chinese attempts to walk back concessions. Trump wants to keep tariffs in place until there is evidence China is complying with terms. An overhang of trade uncertainty remains, despite markets pricing in a reasonably favorable outcome. Should that not prove to be the case, we could see considerable market turbulence.
- Auto tariffs could soon push China negotiations to the sidelines. In late March it was confirmed that a Commerce Department study concluded that the auto industry was critical for national security, giving Trump until May to impose tariffs of up to 25%. Trump is likely using tariff threats as a negotiating tactic, but as most trading partners have refused to budge, their imposition remains a real threat. The potential impact on US jobs and consumers is significant; the Alliance of Automobile Manufacturers has estimated a 25% tariff would cause price increases of $2,000 – $7,000 on imported cars, and other analysts have predicted major US job losses should the conflict escalate.
Equity News & Notes
Stocks End Best Quarter Since 2009
- After a rough end to 2018, the S&P posted its best quarter (+13.6%) since Q3 2009 (+15.6%). The main drivers were familiar ones: improving tone around China trade, a dovish Fed pivot, and better than feared Q4 2018 earnings. The rally has been broad-based with the cumulative advance/decline line at an all-time high, the equal-weighted S&P outperforming its market-cap weighted counterpart, and small caps outperforming.
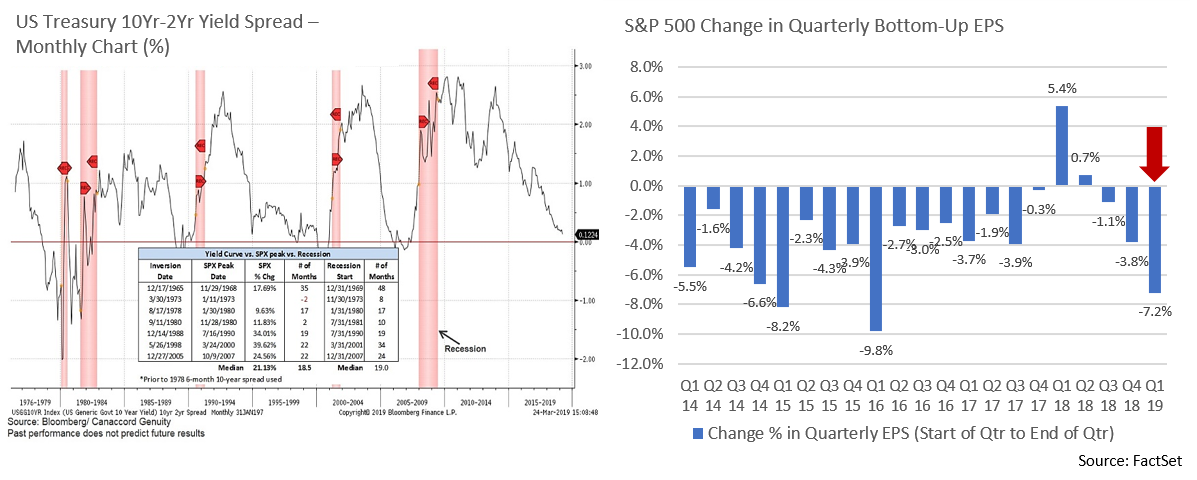
- The shape of the yield curve received a fair amount of attention in late March as certain sections inverted, an oft-cited indicator of impending recession. While concerning, the distinct nature of this inversion warrants emphasis. Recent inversions were the result of interest rates increasing, albeit with the short end rising more than longer dated issues. This time, rates have been dropping across the curve, with long rates declining by more than the short end. We believe this is largely a product of extremely low global yields creating demand for US Treasuries, as well as dovish Fed monetary policy expectations. We do not see problematic inflation, a factor that has historically forced the Fed to hike short-term rates thereby tightening financial conditions and slowing expansion.
- Despite being a longer-run recession indicator, inversion may be a short-to-medium term buy signal in that the equity markets have historically peaked an average of 18 months post-inversion (median gain of >20%). Many in the financial media have covered the most recent inversion by harkening back to 2007, the year the curve was last inverted. However, the long end of the curve was steepening in 2007, not flattening. Referencing 2007 clearly has cache given what followed, although we feel yield curve inversion dynamics were much more similar to today’s in December of 2005. The S&P 500 gained 28% over the next 22 months.
- The stock market has been taking its cues from interest rates and the shape of the yield curve and that is apparent in dispersion of sector performance. Financials, which are highly sensitive to interest rates and the slope of the yield curve, were down more than 3% in March. Lower rates and a flatter curve reduce the net interest margin for banks, a key earnings driver, particularly for regional banks which lack sizeable exposure to investment banking and/or trading revenues. On the opposite end of the spectrum, Real Estate and Utilities, often seen as bond proxies, were each up 4.25% last month.
- Another investor concern has been declining earnings estimates. As the accompanying chart demonstrates, Wall St analysts brought down their bottom-up earnings estimates by 7.2% over the quarter, the most since 2016. While this sounds dire, the 15-year average decline in earnings expectations is 4.0%. In a tale as old as time, analysts tend to be too optimistic about a company’s future, then ratchet down expectations in the months leading up to the announcement, only to have the company exceed a lowered hurdle. With Q1 S&P 500 earnings estimates now projecting a decline of 3.9%, we wouldn’t be surprised to see a number closer to flat.
- One area of the economy receiving a boost from lower interest rates is housing. The average 30-year mortgage rate declined by 0.25% last week, the largest weekly drop in 10 years. This coupled with slowing growth in home prices has supported affordability. The most recent new home sales data posted a seasonally adjusted annual rate of 667,000, the best in a year. Meanwhile, the Bloomberg U.S. Housing and Real Estate Market Surprise Index just turned positive for the first time since last Spring. These trends offer hope that housing may be turning from an economic headwind into a modest tailwind.
From the Trading Desk
Municipal Markets
- The beat goes on in the municipal markets as strong demand continues to push down yields and spreads, while new issues typically remain oversubscribed. Net YTD municipal mutual fund flows of $22.5 billion over 12 consecutive positive weeks demonstrates sustained retail appetite for tax-advantaged income, with roughly equal allocations going into Intermediate and Long strategies.
- The absence of advanced refundings contributed to a 6% decline in issuance for March 2019 vs. the same month last year. However, Q1 comparisons relative to 2018 are up more than 14%, given that the first quarter of 2018 saw low issuance precipitated by 2017’s tax reform. While issuance remains healthy and has demonstrated breadth across the quality spectrum, robust demand for new municipal offerings continues to create challenges sourcing desired bonds.
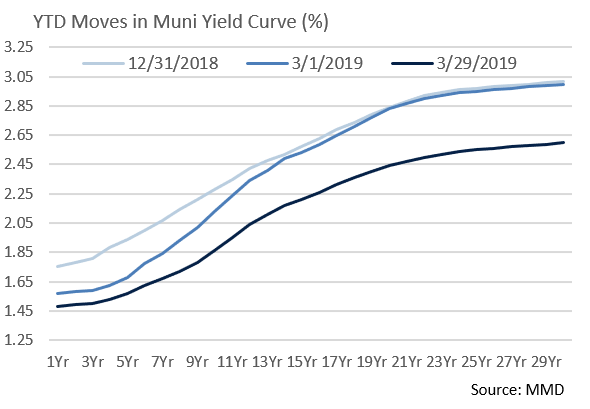
- The impact of SALT limitations should backstop tax-exempt demand in high tax states, many of which are home to large numbers of high-income investors. While the 10 Year muni/treasury ratio of 77.2% (as of 4/2) is low relative to historic averages, a dovish Fed coupled with favorable municipal technical factors have created a positive tax-exempt environment. Recent municipal market performance reflects these strong fundamentals with the Bloomberg Barclays Managed Money Short/Intermediate Bond Index posting 2.38% and 4.92% total returns over the YTD and 1 year periods ended 3/31.
Taxable Markets
- The Fed continued to emphasize patience concerning future rate hikes and is “in no rush” to make policy changes. Release of the January FOMC meeting minutes in March reconfirmed market expectations of no near-term interest rate hikes. This dovish policy was soon followed by the Fed’s “Dot Plot” which forecast no rate increases in 2019 (December’s plot targeted two), and only one in 2020. The clear change in tone led to a rapid flight to quality, further compressing Treasury yields and generating strong demand for other investment grade credits.
- The news of the month was Treasury curve inversion, as 3 months to 10 years inverted slightly, with both maturities converging around a 2.46% level. A Fed Funds rate of +/- 2.40% has held the very short end steady. By contrast, 2Yr-30Yr yields ended the month lower by 30-35 basis points, creating a disconcerting flattening. More specifically, the 1Yr Treasury ended the month at 2.39%, exactly in line with the 10Yr. The market is signaling that the 0.25% rate hike in December may have been premature and the probability of a rate cut went from nearly zero to just over 60% during the month of March. The next FOMC rate decision will be announced on 05/01/19 . . . stay tuned.
- Despite minimal apparent angst in DC, the annual federal deficit is now projected at close to $900 billion. The result is record levels of Treasury bond issuance. To date, demand is easily absorbing this supply, in part due to a premium available on US debt relative to many other developed market sovereign issuers. We caution that this may not stay the case as the deficit balloons. Should investor appetite diminish, significant pressure would be applied on the long end of the curve.
Financial Planning Perspectives
Required Minimum Distributions: What Goes In Must Eventually Come Out
Last month’s Financial Planning Perspectives focused on retirement account contribution limits and income phase-outs. While taking advantage of tax-deferred retirement savings and growth opportunities is well understood, we do not want to overlook when and how to take distributions out of retirement accounts.
Avoid Tax Penalties:
With some limited exceptions for early withdrawals, distributions from retirement accounts prior to age 59 1/2 are penalized at 10% of the amount withdrawn, in addition to one’s ordinary income tax rate for the year of withdrawal. Avoiding unnecessary penalties is an obvious objective.
Consider Deferring Income:
While many would like to delay the inevitable, at some point Uncle Sam will demand a piece of your retirement savings. Planning when to expose retirement distributions to current income tax is an important consideration. Forgoing taxable distributions in one’s 60’s – a strategy that may make sense to those not in current need of retirement assets – creates an ability to delay taxation on retirement income by waiting until the IRS-mandated RMD age. Others may look to accelerate distributions in low tax years.
Individuals also have a one-time option to delay their first required distribution until April 1st in the year following attainment of age 70 1/2, effectively pushing back taxation another year. However, this requires also taking the RMD attributable to the current year, effectively “doubling up” RMDs for that year. Most taxpayers do not delay their first RMD, either because they need the funds, or they wish to avoid taking two taxable RMDs in one year.
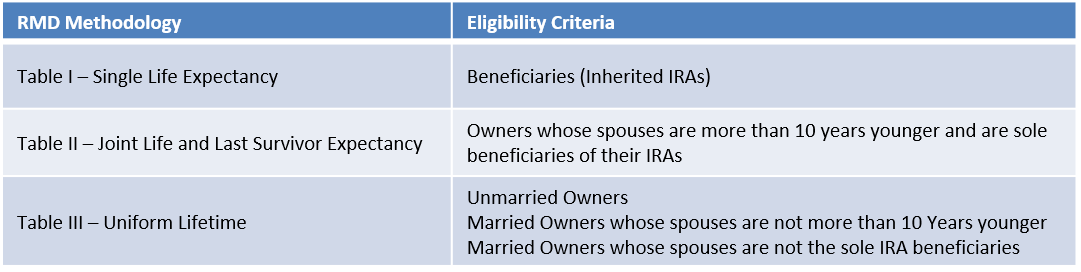
RMD Calculations:
Accountants and fans of IRS calculations may be the only ones conversant in RMD calculation methodologies, but here’s a stab at it. RMDs are calculated by dividing the market value of the retirement account as of the most recent December 31st by the applicable divisor:
While one can withdraw more than the annual RMD amount, failure to take the RMD comes with a steep price. Violators are subject to a 50% excess tax on the amount not taken, plus ordinary income tax.
Charitable Tax Strategies:
Qualified Charitable Distributions (QCDs) from IRAs are one of the few ways to avoid taxation of the tax-deferred growth of retirement account assets. Passage of 2017’s federal tax reform made the on again/off again QCD regulation permanent. QCD rules allow the owner of an IRA to donate part or all of the their RMD (up to $100,000) to a qualified charity as defined by IRS Publication 590-B (Other qualified plans such as 401(k) and 403(b) are not eligible). The distribution must be made directly from the account and the Owner must obtain a written acknowledgement. When filing tax returns, the 1099-R will reflect the entire IRA distribution and the individual must identify the total distribution and the taxable amount on their 1040.
Are Your Beneficiaries Current?
Target date funds notwithstanding, retirement planning should not be a “set it and forget it” exercise. We strongly encourage our clients to periodically review their primary and contingent beneficiaries, including ensuring that individual or trust registration reflects your financial planning goals.
For questions concerning our financial planning or wealth management services, please contact
Jim O’Neil, Managing Director, 617-338-0700 x775, [email protected]