



Insights & Observations
Economic, Public Policy, and Fed Developments
- The past month brought a suite of positive inflation releases. Inflation was expected to have improved in the month of June, and releases met or exceeded expectations. Falling energy prices during what proved to be a temporary lull in Iran hostilities were the main driver, but there were some interesting details as well; in particular, CPI inflation saw an unexpected drop in rental costs, and wireless phone services were one of the larger detractors. The former is independent of energy costs and could be related to net outmigration in the past year. The latter seems more likely to be a lagged effect of higher energy prices in previous months causing providers to drop rates and could be more evidence of energy prices paradoxically helping contain core price pressures.
- The market continues to scrutinize Fed Chair Warsh’s second press conference as it did to the first; the front of the Treasury curve fell while increasing inflation expectations drove longer maturities higher, after Warsh described the sharp jump in the 2yr during his first press conference as the market having “tightened” for the Fed, implying that despite his messaging around inflation the Fed might not follow through with rate hikes.
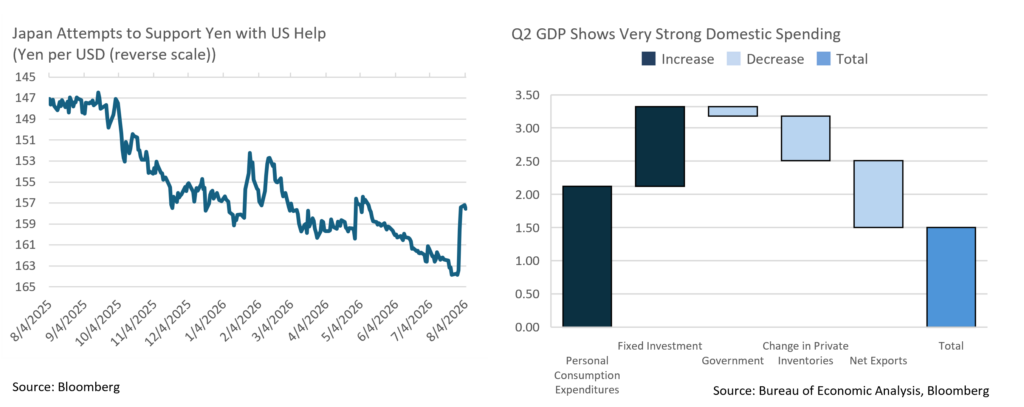
- Second Quarter GDP report missed expectations, 1.5% vs 2.0%, however this is deceptive; the headline was lowered by net imports and inventory replenishment, and underlying growth appears quite strong. Final sales to private domestic purchasers grew 3.9%, the highest quarterly growth in several years. We believe the economy is on much better footing than headline GDP growth implies.
- President Trump’s temporary Section 122 tariffs expired early the morning of Friday the 24th and were immediately replaced with new Section 302 unfair trade practice tariffs on 60 countries representing 99% of all US imports, ranging from 10% to 12.5%. The Trump administration tied these to slave labor in national supply chains, but critics argue this was a pretext to replace expiring tariffs. The economic impact is roughly a wash but do return tariffs to the news cycle; additional tariffs have been threatened, and further escalation is likely.
- We also expect further escalation with Iran. After a month of increasing hostilities, August opens with hope for a resumption of talks between the US and Iran. We’re less optimistic; there is no obvious “solution” to the conflict, and we believe this respite is likely to be temporary. This will likely continue pressuring Treasury yields, which have risen significantly since the start of the war.
- Recent weakness in the Japanese yen poses another risk to the Treasury curve; Japanese retail investors are the largest overseas holders of Treasuries, and sharp moves in Japanese yields or currencies have in the past flowed through into Treasury yields as the relative value of unhedged Treasuries for Japanese investors changes. The JCB stepped in on the 27th with what’s believed to be their largest yen intervention in history, an estimated $53B. For the first time in 15 years, the US Treasury joined them, and Treasury Secretary Bessent has indicated support will continue. This brings its own risks; the sheer size of the intervention suggests it may be difficult to support the yen at these levels, and failure may result in a sudden spike in bond yields globally.
- A new possible source of support for Treasuries has emerged from an unlikely place. As states propose possible state-level wealth taxes, there is a growing consensus amongst accounting firms that US Treasuries would be exempt from such taxes, as they are state tax exempt. If wealth taxes like the one California has proposed start to look likely to pass into law, demand for Treasuries could surge amongst the wealthiest of American investors.
Sources: Bureau of Labor Statistics, Bureau of Economic Analysis
From the Trading Desk
Municipal Markets
- As geopolitical and Fed messaging concerns took center stage throughout July and added to inflation fears in the market, municipals largely sold off, exceeding the US Treasury market moves and improving entry points for tax-exempt investors.
- Municipal yields experienced double-digit moves higher across the scale with the belly of the curve shifting the most. Specifically, maturities out to 3 years saw yields move 25bps higher, 5-7yrs rose by 32 and 36bps, respectively, while the 10-15yr part of the curve shifted higher by 42-43bps. Finally, 20-30yr maturities settled in 32-33bps higher on the month.
- The slope of the curve continues to steepen inside of 10 years. The 2s-10s slope is now at 74bps, steeper by 14bps from where it started the month and notably, the very front-end of the curve (2s-5s) is responsible for about 4bps of that. Short-focused strategies can now take advantage of the 9-10bps of additional pickup per year and get more adequately compensated for going out the curve than in the recent past. Steepness along the curve also adds to the total return prospects by increasing the value of the roll down the curve as bonds get closer to their maturity date.
- Given the sizeable move in yields and the underperformance of munis, ratios gapped considerably wider across the board. Specifically, the 2 and 3yr spots saw their ratios move wider by 5.20 and 3.50% respectively, the 5 and 7yr registered a 4.15-4.25% ratio move, and the 10yr maturity cheapened by 5% relative to its taxable counterpart. Ratio moves in the longer-end of the curve (20 and 30yrs) were more muted, at 1-1.6%.
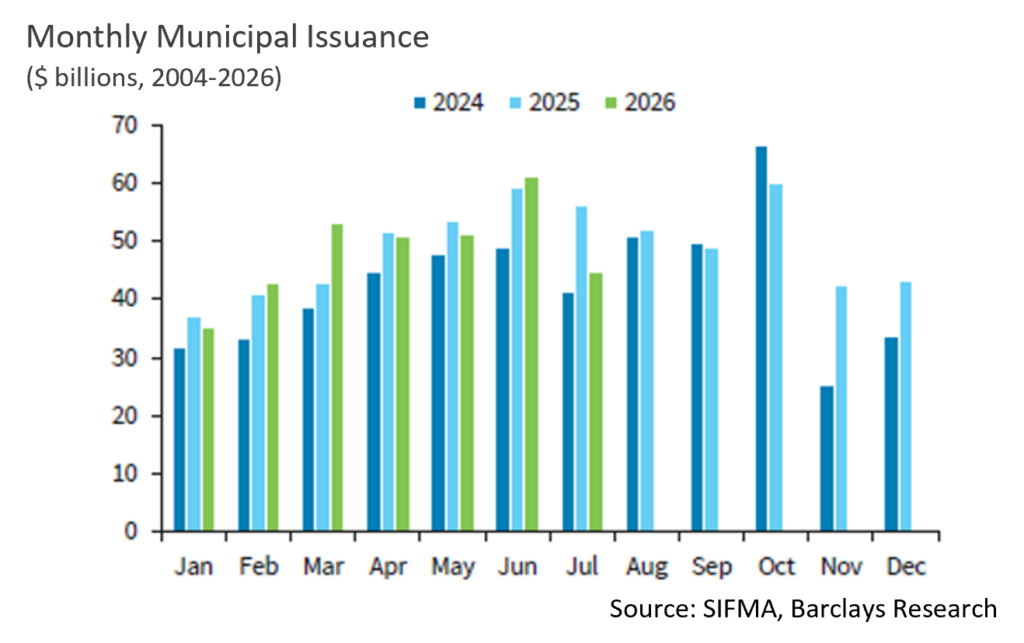
- According to JP Morgan, July closed the month with gross long-term issuance topping $44.8B, the 3rd highest July on record, but well behind the record setting July 2025, which saw issuance at $55.8B. Municipal fund subscriptions continued to show strength with Barclays recording approx. $5.6B coming into funds, with inflows being focused on national, ETFs and long-term funds.
Corporate Markets
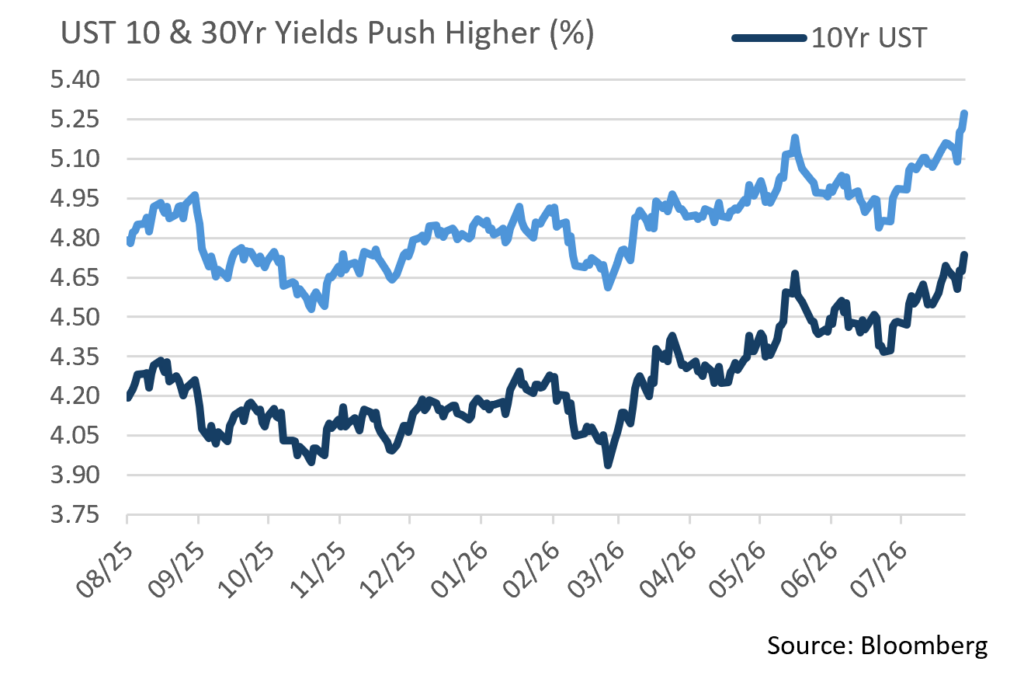
- After a selloff in the short end of the UST curve in June, it the was the longer end’s turn in July as the yield curve steepened. In a full bear steepening fashion, the 20Yr benchmark UST rose 33bps and the long 30Yr bond rose 32bps to 5.27%. This was the highest level the 30Yr has hit since June 2007 and, for perspective, this year’s low was 4.60% back in February. Inflation fears, a lack of Fed action after their recent meeting and continued geopolitical turmoil are pushing hedging costs against a further rise in rates higher, which in turn is pressuring the longer end of the curve. In our view, the Fed is unlikely to move rates in either direction over the remainder of 2026, but the markets are anxiously awaiting what comes out of the Jackson Hole Policy Symposium later this month.
- Investment Grade Corporate bond performance was lackluster in July given rising UST rates and the pressures of an AI issuance boom. Compounding these factors is considerable market uncertainty arising from the Middle East war, a dynamic that is making it challenging for issuers to come to market at times. Nonetheless, the $139.6B that came to market in July was generally well received and finished higher than syndicate expectations. The Technology and Finance sectors remain very active in the primary market, accounting for several jumbo deals completed in July. The “dog days of summer” are showing no signs of living up to their name as $130B of August issuance is expected, the most an August has seen since 2020.
- Market pressures are also weighing on IG spreads. The 4bps OAS move on the month does not tell the whole story as the 80bps OAS on the Bloomberg US IG Corporate index was the highest seen since the beginning of April and slightly above the year-over-year average of 77bps. This modest break in tight spreads and pressure being put on USTs is offering some attractive “all- in” levels. We believe that while there may be smaller moves in spreads, the current range should remain in place for now with room on the upside if geopolitical tensions persist.
Sources: Bloomberg, Bond Buyer, Barclays, JP Morgan, and Lipper Inc.
Public Sector Watch
Pension Funding Trendline is Positive Although Credit Vigilance Remains Important
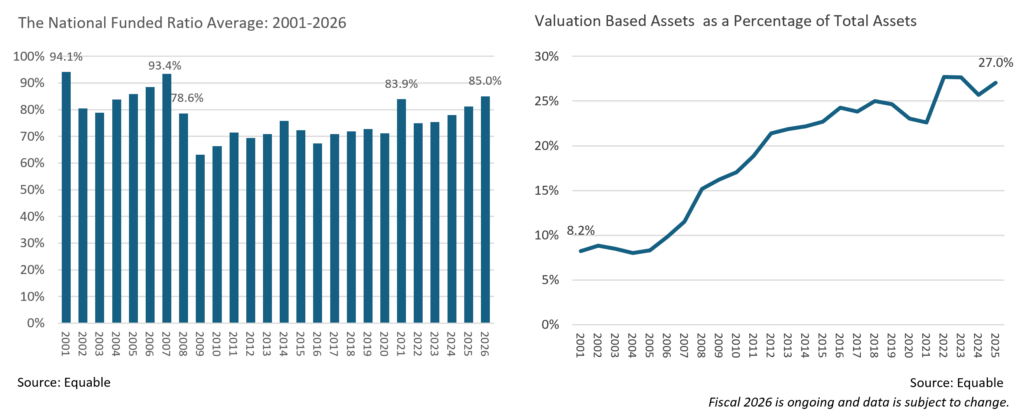
Equable recently published their “State of Pensions 2026”, analysis that reported that public pension funding remained on an upward track in FY2026, with the national funded ratio rising to an estimated 85.0%, the highest level since 2009 and up from 81.2% in FY2025. Aggregate unfunded liabilities declined to $1.13 trillion, down about $210 billion year-over-year.
This fiscal improvement has been driven by four consecutive years of investment returns above actuarial assumptions, with FY2026 projected returns of 9.4% versus a 6.9% assumed rate of return. The 10-year rolling return of 8.7% also exceeds current assumptions.
Despite these investment gains, employer pension costs continue to pressure government budgets. Employer contributions reached a record 31.8% of payroll, more than triple 2001 levels. Importantly, about 70% of current contributions are being used to amortize existing pension debt rather than fund current benefits.
Positively, most governments are now making full actuarially determined contributions, with contribution discipline improving significantly over the last decade. This trend has been a key driver of improved funded ratios and declining unfunded liabilities. Long-term risks remain centered on future investment performance, asset valuation, and the extent to which management remains committed to making sufficient contributions.
Public pension portfolios have increasingly shifted toward alternative investments which now represent about 32% of assets, while 27% of assets are subject to valuation risk. Valuation risk is the risk that the value of pension funds may have an inaccurately stated value due to reliance on private market pricing using valuation models rather than market-based pricing.
State-level disparities remain significant. Illinois and New Jersey remain the most challenged systems in our view with funded ratios below 60%, while seven states are now estimated to be fully funded or better. States with high pension debt relative to economic output face elevated long-term fiscal pressure.
From a credit perspective, stronger funded ratios and declining unfunded liabilities are generally supportive of state and local government credit quality because they reduce long-term balance sheet pressure and future contribution growth. However, progress remains dependent on sustained funding and favorable investment performance.
Pension trends remain broadly favorable for state and local governments due to strong markets, improved funding discipline, and declining unfunded liabilities. While recent improvements are encouraging, pension burdens remain uneven across states, highlighting the importance of issuer-specific analysis when evaluating long-term budget flexibility and liability management.
Sources: Equable, https://equable.org/report/state-of-pensions-2026/
This commentary reflects the opinions of Appleton Partners based on information that we believe to be reliable. It is intended for informational purposes only, and not to suggest any specific performance or results, nor should it be considered investment, financial, tax or other professional advice. It is not an offer or solicitation. Views regarding the economy, securities markets or other specialized areas, like all predictors of future events, cannot be guaranteed to be accurate and may result in economic loss to the investor. While the Adviser believes the outside data sources cited to be credible, it has not independently verified the correctness of any of their inputs or calculations and, therefore, does not warranty the accuracy of any third-party sources or information. Any securities identified were selected for illustrative purposes only, as a vehicle for demonstrating investment analysis and decision making. Investment process, strategies, philosophies, allocations, performance composition, target characteristics and other parameters are current as of the date indicated and are subject to change without prior notice. Not all products listed are available on every platform and certain strategies may not be available to all investors. Financial professionals should contact their home offices. Registration with the SEC should not be construed as an endorsement or an indicator of investment skill, acumen, or experience. Investments and insurance products are not FDIC or any other government agency insured, are not bank guaranteed, and may lose value.