



Insights & Observations
Economic, Public Policy, and Fed Developments
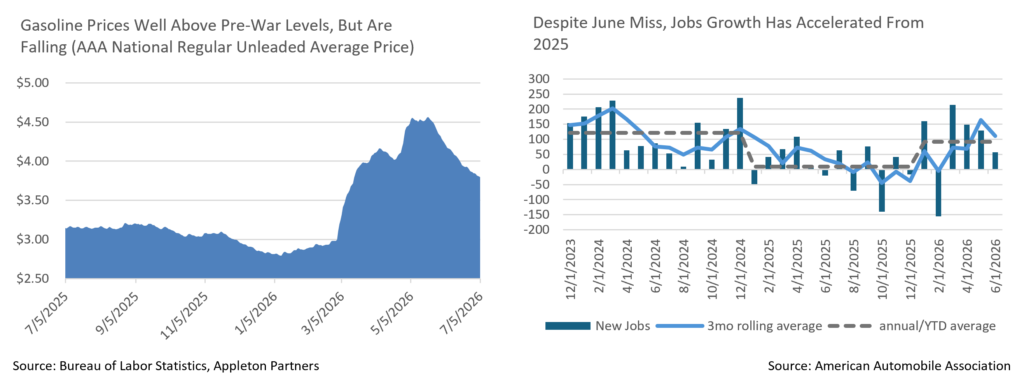
- The signing of a Memorandum of Understanding with Iran on June 17th may leave a lot of questions unsettled, and in the weeks since it has mostly held although tensions in the Middle East remain high and periodic flare-ups have occurred. But it provides the basis for a more stable ceasefire, and for negotiations toward a lasting peace. However, it also brings an unusual macro risk. Last month, we noted some evidence that high energy prices may have actually been depressing core inflation, by straining household budgets and forcing consumers to become price sensitive. Evidence for this continued to build in June, notably with a PPI report where the trade services component suggests sizable producer margin compression. Since oil began to flow through the Strait of Hormuz, gasoline prices have fallen 17% in the US, from over $4.50 to under $3.80. And, if rising gas prices appeared to suppress core inflation in the past few months, then it stands to reason that their fall could paradoxically cause core inflation to reaccelerate.
- What we can say so far is that consumer spending does appear to have weathered high energy costs unexpectedly well. Personal consumption data had been strong during the war, but early months may have been boosted by tax returns. By May, tax returns should not have been a major factor, yet personal consumption remained robust at 0.7% nominal and 0.3% real, both a tenth better than expectations. Any acceleration, both here or in the also-strong retail sales release (which is not inflation-adjusted, but the ex-auto and gas and “control group” series also beat, 0.5% vs 0.3% and 0.7% vs 0.4%, respectively) could be a warning sign that core inflation may reaccelerate as energy prices fall.
- June’s Nonfarm Payrolls missed badly, halving expectations at +57k with a further -74k in prior period revisions. However, the
- report was not unequivocally bad; the unemployment rate still ticked down to 4.2%, and as-expected average hourly earnings of 0.3% monthly and 3.5% trailing one year both accelerated and still suggest the overall trend remains a slowly tightening market. YTD job growth now averages +92k jobs a month, well above 2025’s +9.7k and only slightly below 2024’s rate of +122k.
- This matters because even a slightly stronger labor market has major implications for Fed policy. Coming into 2026, markets were concerned about labor market softness and felt inflation was under control (at the time, we disagreed with both). War in Iran shifted market attention back to inflation. However, job growth has solidified since then, so even if the current ceasefire takes pressure off inflation, the labor market case for rate cuts no longer exists. We believe inflation could worsen and could force the Fed to raise rates, but if it doesn’t, we think the Fed will remain on hold, and long-run neutral estimates will rise.
- New Fed Chair Kevin Warsh certainly gave markets no reason to look for cuts. The Fed’s June statement was cut to the bone, to less than half the length of recent statements, and in his Q&A, Warsh pushed back aggressively when asked to provide anything remotely close to what he considered forward guidance. Warsh was an inflation hawk before being nominated by President Trump to chair the Fed, making him an unlikely candidate to cut rates anyway despite President Trump’s own preferences, but what little color he provided in his first meeting does suggest cuts are unlikely; the closest thing to forward guidance in either the Q&A or his remarks was a terse “The Committee will deliver price stability” at the end of the Fed Statement.
Sources: Bureau of Labor Statistics, American Automobile Association, Bureau of Economic Analysis, U.S. Census Bureau, and Federal Reserve
From the Trading Desk
Municipal Markets
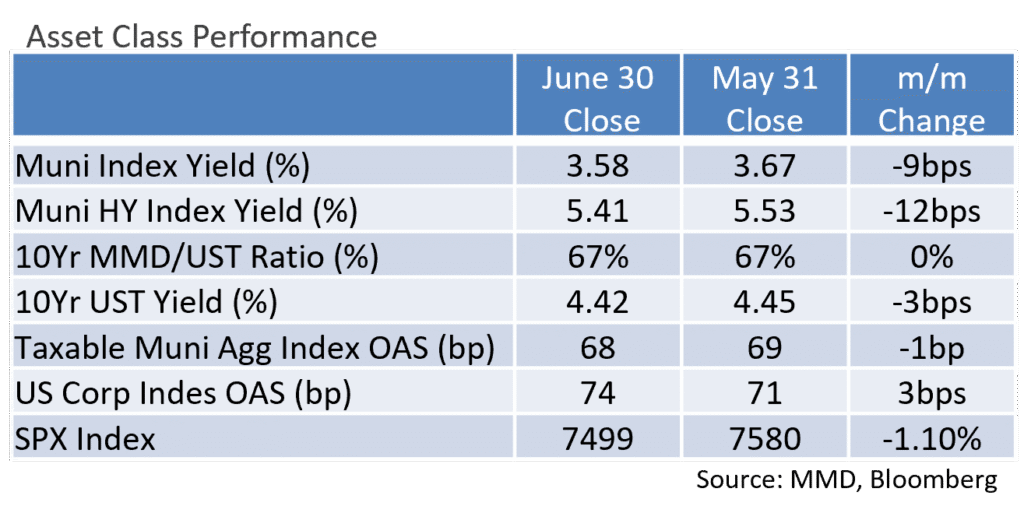
- During the month of June, municipals largely tuned out the Treasury market noise as yields and ratios ground lower despite robust supply and technicals that seemed less than ideal to start the month. Positive investor sentiment in the municipal market continued, and they consistently directed capital to the asset class despite geopolitical headlines persisting.
- Municipal yields moved in a barbell fashion, with the 2 ends of the curve outperforming the belly as the front and back ends of the curve experienced strong downward moves in yield. The 1-year maturity moved meaningfully lower, with the respective yield lower by 10bps. Maturities in the 3- to 12-year spots saw yields marginally lower by 3bps across the board, while the 20- to 30-year maturities registered lower yields by 14bps to 16bps.
- With the exception of the 2nd week of June, when municipals underperformed, ratios consistently moved lower as municipals provided an attractive haven during the UST market volatility. All points on the curve saw tighter ratios, with the barbell ends of the curve registering the most meaningful moves. Notably, the 2-year saw its ratio move lower by 4.36% while the 7- and 10-year spots richened by 1.4- and 1.06%, respectively. The 20- and 30-year ratios both closed the month lower by 2.66%
- On an absolute basis, the 2- and 3-year spots closed the month sub 60%, 5- and 7-year hovered in the 61-63% range, while the 10-year maturity settled at approximately 66%. At the long end of the range, the 25- and 30-year spots closed at approximately 76% and 84%, respectively.
- According to JP Morgan, June closed the month with gross long-term issuance topping $59.5B, marking the highest June on record and surpassing the previous titleholder of June 2025.
- Municipal funds subscriptions continued to show strength and helped absorb the record-setting supply. Monthly inflows topped $6.4B for the month, pushing the YTD inflows to the second highest on record.
Corporate Markets
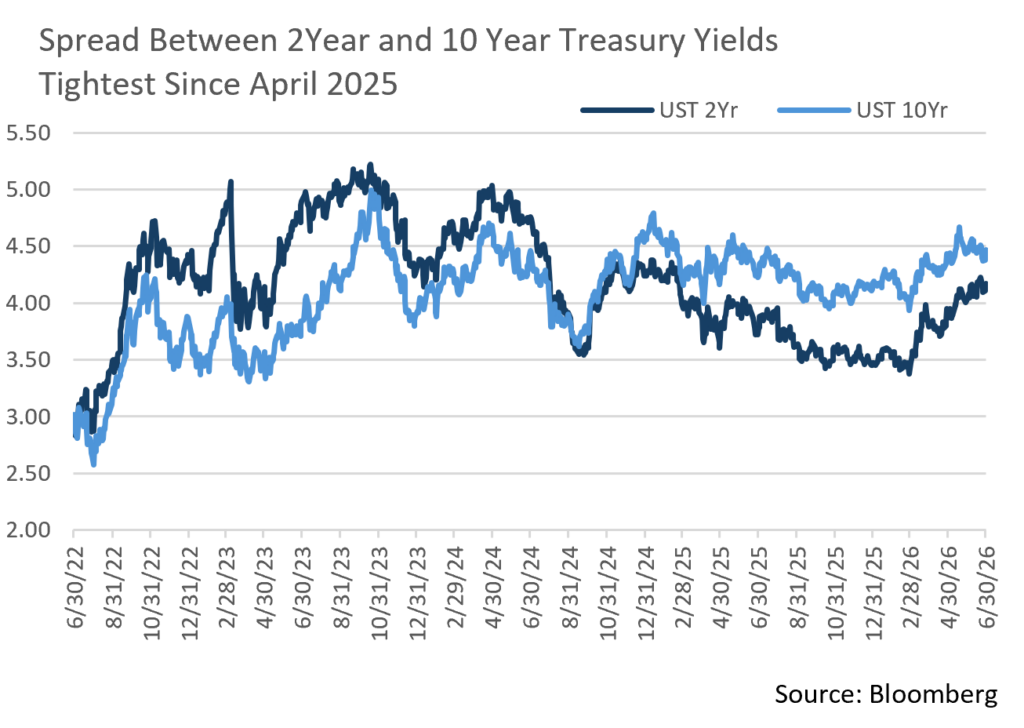
- The UST Curve took on a bear flattening trend over the course of the month, with short rates climbing materially higher. The two-year UST benchmark bond rose 17bps to close the month of June at 4.18%. Coincidentally, the three-year UST bond closed at the same rate. Further out on the maturity spectrum, the ten-year benchmark rate closed at 4.47%, just 3bps higher than where it began the month. The rise in short-term rates has compressed the spread between shorter and longer bonds, with the 2-10 year spread at just 29bps, which is the narrowest it has been since April 2025. The market has priced in the potential for one rate hike by the Federal Reserve by year-end and until that sentiment abates, the bear flattener trend may continue.
- Fund flows reported by Lipper each week continue to be very strong. Over the course of the month, short and intermediate investment-grade bond funds recorded $19.46B of inflows. The prior month had $38.2B of inflows, which was the highest since January, but the demand for investment grade continues to be very strong.
- Issuers continue to take advantage of the appetite for high-quality bonds. June’s $175B of new debt set a new June record, at 60% more than June 2025 issuance and higher than the record setting pace of June 2020. Two tech issuers accounted for a large amount of last month’s issuance, but the sector has accounted for a very large amount of year-to-date issuance to fund projects tied to the AI spending spree. The first half of 2026 has tied the first half of the record-setting yearly volume of 2020. Issuance will continue to persist as long as investors remain eager for bonds.
- The Bloomberg US Corporate Bond Index OAS began the month at 72bps and remained range-bound throughout the month, closing at 74bps. This is slightly lower than the YTD average of 78bps. We continue to feel that breakouts or abnormalities in credit spreads for long periods of time remain unlikely in the near term.
Sources: Bloomberg, Bond Buyer, Barclays, JP Morgan, and Lipper Inc.
Public Sector Watch
NASBO Spring 2026 Fiscal Survey Takeaways
July 1st is the start of many states’ fiscal year, and most are entering with historically strong liquidity and reserves but are also grappling with significantly tighter budget conditions than in the last several years. The post-pandemic era of extraordinary revenue growth and surplus accumulation is ending, and states are increasingly shifting their focus from expansion to preservation of financial flexibility. For many states, FY27 marks the first broad test of how well they can maintain structural balance after spending down much of the revenue windfalls accumulated during 2021-2024.
The National Association of State Budget Officer’s (NASBO) Spring 2026 fiscal survey of governors’ recommended budgets revealed a much more constrained operating environment characterized by slower revenue growth, reduced availability of surplus funds, federal policy uncertainty, and persistent spending pressures. The median state is projecting only +0.6% spending growth, essentially flat after inflation. Budget management actions have focused on spending cuts, eliminating vacant positions, and fund transfers. These actions suggest states are increasingly aiming to maintain structural balance rather than expand programs.
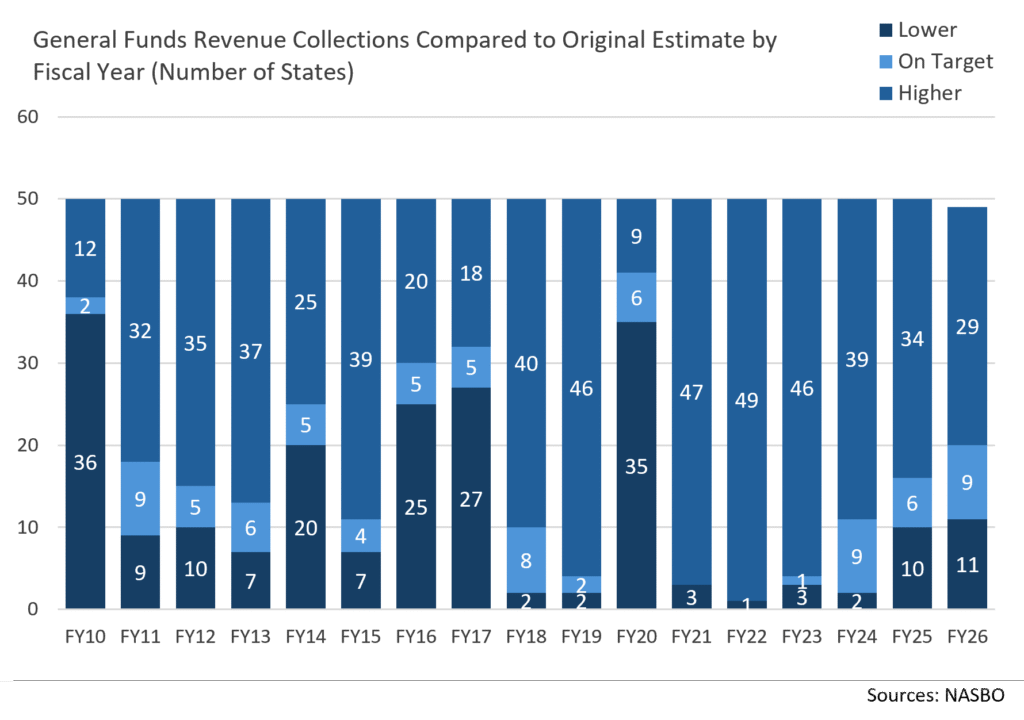
On the revenue side, growth remains positive but has slowed. General fund revenue is expected to grow 2.5% in FY27, following +2.2% and +4.9% increases in FY26 and FY25 that were led by growth in sales, personal income, and corporate taxes. However, states are acknowledging that future spending growth is likely to exceed revenue increases, creating rising out-year budget pressures.
Rainy day funds reached a new all-time high of $191 billion in FY25. Aggregate rainy day fund balances are now more than twice FY 2019. The buildup reflects several years in which revenues dramatically exceeded forecasts. Despite a difficult operating environment, NASBO reports that 26 states expect rainy day funds to increase in FY26, and 25 states expect the same in FY27.
- Median rainy day fund balances have been historically high over recent years – FY27:12.6% of spending (projected); FY26: 13.1% (projected); FY25: 13.5%; and FY24: 14.9%. In our view, reserve levels are one of the strongest indicators of state fiscal resilience.
- Nonetheless, draws from the general fund are becoming more common. General fund balances peaked in FY23 at $254 billion and in FY25 were down to $214 billion. NASBO reports that GF balances are expected to decline to $141 billion in FY26 and $114 billion in FY27. This largely reflects one-time capital investment, and transfers to reserve funds mark a return to more typical fiscal practices rather than a sign of credit deterioration.
- Given that reserve balances remain substantially greater than pre-pandemic levels, most states enter FY 2027 with significant capacity to absorb economic volatility, a characteristic that offers credit comfort. Despite a more challenging environment, we do not expect a need for severe spending reductions in the states where we are invested.
Source: NASBO
This commentary reflects the opinions of Appleton Partners based on information that we believe to be reliable. It is intended for informational purposes only, and not to suggest any specific performance or results, nor should it be considered investment, financial, tax or other professional advice. It is not an offer or solicitation. Views regarding the economy, securities markets or other specialized areas, like all predictors of future events, cannot be guaranteed to be accurate and may result in economic loss to the investor. While the Adviser believes the outside data sources cited to be credible, it has not independently verified the correctness of any of their inputs or calculations and, therefore, does not warranty the accuracy of any third-party sources or information. Any securities identified were selected for illustrative purposes only, as a vehicle for demonstrating investment analysis and decision making. Investment process, strategies, philosophies, allocations, performance composition, target characteristics and other parameters are current as of the date indicated and are subject to change without prior notice. Not all products listed are available on every platform and certain strategies may not be available to all investors. Financial professionals should contact their home offices. Registration with the SEC should not be construed as an endorsement or an indicator of investment skill, acumen, or experience. Investments and insurance products are not FDIC or any other government agency insured, are not bank guaranteed, and may lose value.