


Insights & Observations
Economic, Public Policy, and Fed Developments
- May was a volatile month for Treasuries, with the 10Yr peaking at 4.68% and the 30Yr hitting its highest level since 2007, at 5.30%, before receding by month-end. Yields soared globally after a Japanese wholesale inflation report came in significantly hotter than expected, +2.3% on the month vs. +0.8%, on surging oil and commodity prices. Japan is the largest foreign holder of U.S. Treasuries, and the prospect of potential higher domestic yields changed the breakeven for holding overseas bonds, pressuring sovereign yields worldwide. America is more removed from the immediate effects of war in Iran than most developed countries, as we are much less dependent on the Strait of Hormuz for oil, but this is a perfect example of how market linkages can “import” overseas risk and occasionally catch participants off guard. Rates subsequently retraced, but the Treasury curve closed May higher as the War continues to pressure yields at home and abroad.
- May could prove an inflection point for inflation data. Two notable developments occurred. First, an April Producer Price Inflation report came in well over consensus, +1.4% vs. +0.5% headline, and +0.6% ex-food, energy, and trade vs. +0.3%. What was especially notable here was less the impact energy costs had on the headline, than the fact energy prices appear to already be flowing into service categories such as transportation and warehousing (where prices rose 5% over the month). This was quite a bit faster than markets had anticipated, and the risk is that producer services prices could begin to fuel consumer core services inflation.
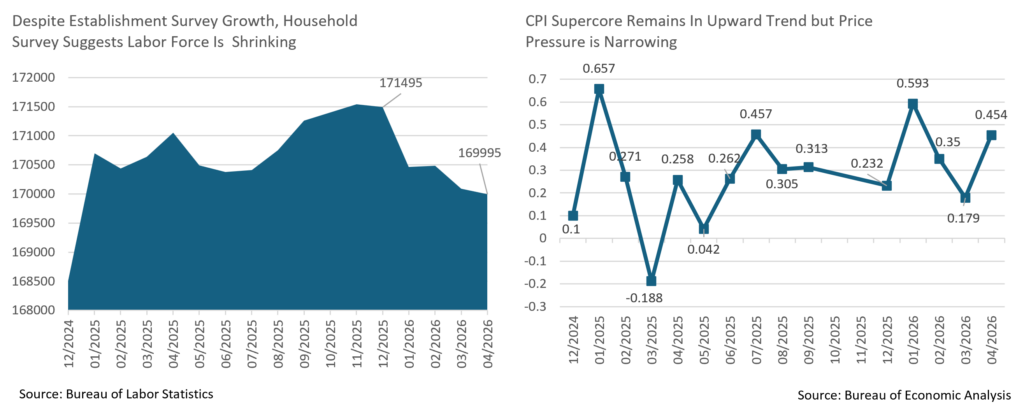
- Of course, there’s no guarantee they will, and that was the interesting thing about April’s CPI inflation report; housing inflation was overstated by the catch-up from the shutdown-impacted October 2025 period, and “supercore” core services ex-housing re-established a long-running upwards trendline… but it also narrowed considerably. Prices were otherwise generally little changed on the month, with most of the increase coming from computer and software, likely due to data center demand. The PCE inflation report later showed a similar pattern. Retail sales are slowing after tax season but both retail sales and personal consumption appear to be growing in real terms. This suggests that retailers are losing pricing power to pass along higher costs and that consumers are still spending but becoming more price sensitive. If so, higher input prices may lead to tighter margins rather than higher consumer inflation, which would be boon for rates.
- After alternating months of job expansion and contraction, we got our second straight labor upside surprise at the start of May, with 115k new jobs nearly doubling market expectations for 65k. The internals of the report were slightly better as well, with growth less concentrated in healthcare than in months past. Average hourly earnings was a little lower than expected, but at +0.2% for the month and +3.6% for the year it has still been above its pre-pandemic average, suggesting demand may not be red-hot, but is far from tepid. One concerning note is that the broader Household survey has been in contraction for several months now; this showed strong growth all last year and was one of the reasons we were more optimistic about labor conditions than most. However, in 2026 it’s given up about half of its gains from 2025. Expectations are for 85k new jobs in May with an unchanged unemployment rate; we would like to see the growth trend in the Household survey reverse as well.
Sources: Bureau of Labor Statistics, Bureau of Economic Analysis, U.S. Census Bureau
From the Trading Desk
Municipal Markets
- Despite volatility driven by geopolitical headlines, investors continued to view the municipal market favorably. Capital was aggressively committed despite at times diverging yield trajectories intra-month.
- Municipal yields offered a mixed picture as the front end rallied, while the belly of the curve moved slightly higher and the longer end settled lower, creating a serpentine effect on the curve move. The 1-year AAA maturity saw the most meaningful yield move of 14bps, while maturities in the 3 to 15-year range saw yields flat to slightly up (2 – 4bps), 20 and 25-year maturities registered yields declines of 3bps, while the 30-year maturity rose in yield by 1bp.
- From a ratio perspective, the zig-zag curve move pressured ratios in the front end of the curve but less so out further. On a net basis for the month ratios exhibited a tapering tightening effect. The 2 and 3-year maturities richened by 2.5-3.35%, while 5 and 7-year ratios tightened by 1.35% and 0.70%, respectively. Further out, 10 and 20-year ratio changes were more muted with levels tighter by only 0.5% to 0.85%, and the long end ratio was very marginally cheaper by 0.04%. The month closed with 3-yr ratios of 61%, 5-yrs at 63%, while the 10-year maturity settled at 67%. On the long end of the curve, the 25- and 30-yr spots closed at 79% and 87%, respectively.
- According to JP Morgan, May saw gross long-term issuance topping $50.4 billion, marking the 7th highest month on record and the largest May. In the face of strong issuance, municipal fund demand remained robust and helped push valuations higher. Barclays estimates that May fund subscriptions totaled $7 billion with a focus on ETFs and long-term/national funds, bringing the YTD fund intake to $40 billion.
- While waiting for summer technicals to emerge, the market is poised to contend with sustained heavy issuance in June with estimates of +$10 billion net positive supply. This could prove an opportune moment to put capital to work while yields continue to be attractive and supply plentiful.
Corporate Markets
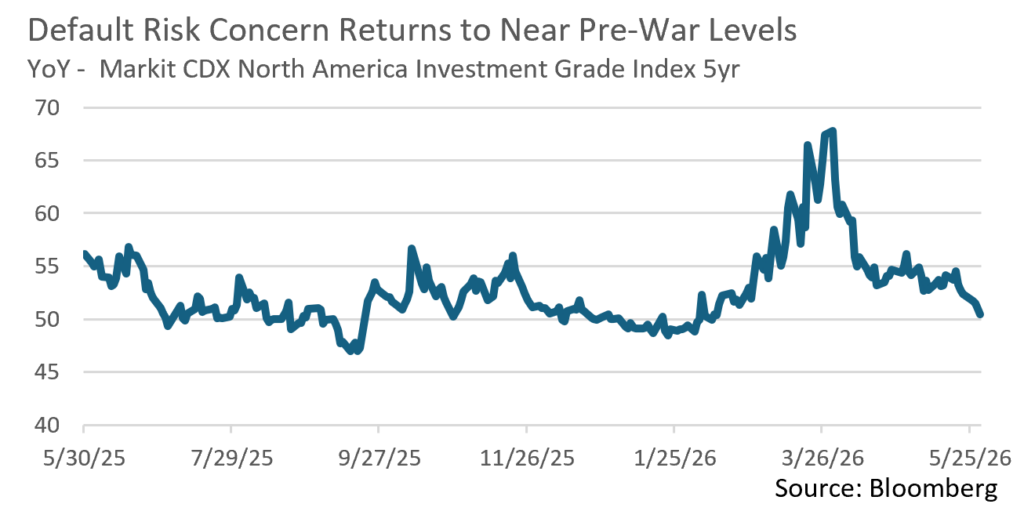
- Credit concerns in the Investment Grade space began to rise after the US/Iran conflict began in late February. This followed a rather benign period since the “Liberation Day” blip back in the spring of 2025. This sentiment is generally tracked via the CDX IG index which implies a “cost” of insuring against the probability of defaults across a wide range of investment grade companies. Prior to the start of the conflict, the CDX IG index was close to 50bps but climbed to a YTD high 68bps in late March. This was followed by a sharp decline in April and a further drop back towards pre-war levels of 50bps by month-end. Risk appetite has rebounded and investor demand for bonds remains robust.
- The overall tone of Investment Grade credit was on solid footing in May. In fact, IG credit spreads have been on a tightening trajectory since the beginning of April. It took 53 days for credit spreads to rise from the YTD low of 71 OAS on the Bloomberg US IG Index to the YTD high of 93 OAS on March 16th. While we haven’t retraced the full extent of the Q1 widening, it took 74 days to get back down to an OAS of 72bps. A large part of that move came in May as war tensions eased a bit and economic growth largely held up. We expect to see a stabilization of credit spreads in this range despite historically low spreads, especially if investor risk sentiment remains favorable.
- According to Lipper, May started off with a massive $6.88 billion flowing into Short and Intermediate Investment Grade funds. Positive flows brought the full month’s total to $17.63 billion, helping to fuel spread compression and soaking up some of the $163.9 billion of new issuance. While May issuance was just shy of expectations, it was still a very busy month for the syndicate. Compressed spreads and low concessions have made it a very opportunistic time for issuers to come to market. We anticipate that the new issuance engine will continue to run at a rapid pace with June expected to bring $130 billion, and the $1.85 trillion expected in 2026 is well within reach.
Sources: Bloomberg, Bond Buyer, Barclays, JP Morgan, and Lipper Inc.
Public Sector Watch
Credit Notes
Surface Transportation Reauthorization Update & GARVEE Funding
On May 18, the U.S. House of Representatives Committee on Transportation and Infrastructure released the BUILD America 250 Act – its surface transportation authorization legislation – which authorizes $580 billion over five years (fiscal years 2027 to 2031). The bill is designed to replace the Infrastructure Investment and Jobs Act (IIJA) due to expire in September 2026. Major allocations include $376 billion for highways, $88 billion for transit, $65 billion for rail, and $50 billion for bridges.
The bill proposes annual registration fees for electric vehicles ($130) and hybrid vehicles ($35), with each rising by $5 biennially beginning in 2029 until reaching $150 and $50 per vehicle, respectively. The fees are intended to support the Highway Trust Fund (HTF) as traditional gas tax revenues erode due to increased fuel efficiency and EV adoption.
The Highway Trust Fund faces a structural funding gap, with some projecting the HTF would be depleted as soon as 2028. The BUILD America 250 Act proposes $475 billion in HTF support over the authorization period which, in conjunction with the new fees, should keep the fund solvent for some time.
The legislation remains an early-stage committee proposal subject to markup, House passage, Senate negotiation, and Presidential signature. Final funding levels, formulas, and policy provisions could change materially through the legislative process.
GARVEE bonds are secured by future federal highway reimbursements tied to HTF funding. Reauthorization proposals reinforce expectations of continued federal reimbursement flows, which is a key credit support for these structures.
GARVEE credits should remain stable in the near term, supported by expected continuity of federal funding. However, the policy-linked nature of these credits warrants monitoring as the authorization process unfolds.
Separately, there have been headlines surrounding the suspension of a federal gas tax to mitigate the impact of surging gas prices. So far, all proposals have included language stating that any foregone Highway Trust Fund revenues would be backfilled with transfers from the Treasury general fund. So long as the Highway Trust Fund receives backfill revenue, we would not view this change negatively.
State Gas Tax Holidays
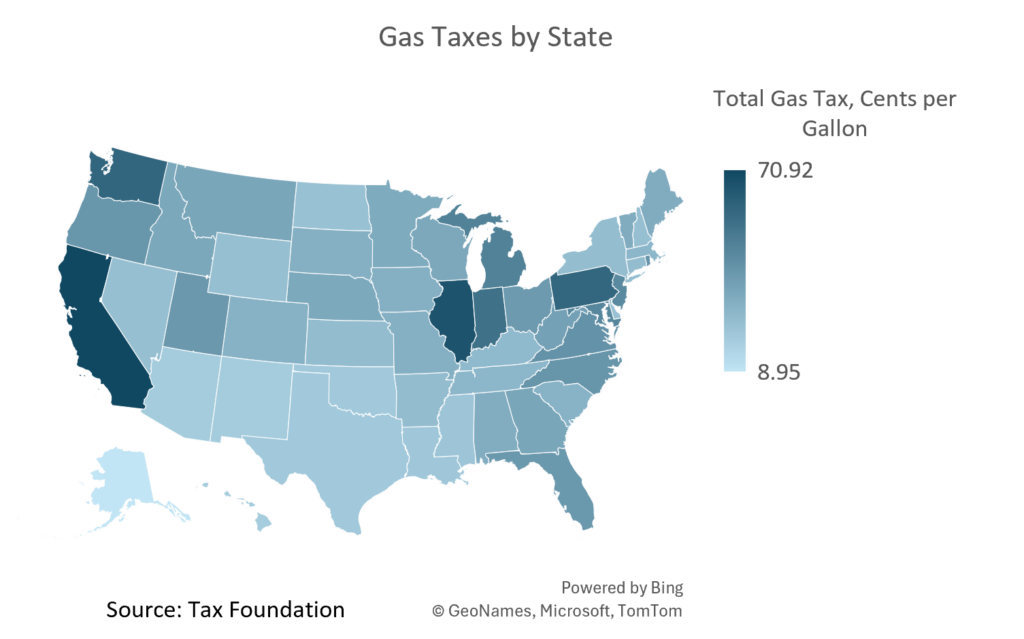
Rising prices at the pump have inspired lawmakers in several states to suspend motor fuel taxes. Gas tax holidays last made headlines in 2022 when gas prices soared due to Russia’s invasion of Ukraine and a post-pandemic surge in demand. Connecticut, Florida, Georgia, Maryland, New York, and Puerto Rico all declared gas tax holidays in 2022.
As of spring 2026, three states have enacted gas tax relief measures. In March, Georgia suspended collection of motor fuel excise taxes through June 2nd. Indiana’s governor signed an executive order suspending both the state’s 7% gasoline usage tax and the 36-cent excise tax through June 7th. Utah also enacted a 15% reduction in its gas tax rate from July 1 through December 31st.
Gas tax holidays are also being discussed in several other states, including Alabama, Arizona, Connecticut, Florida, Maryland, New York, Pennsylvania, and South Carolina.
From a credit perspective, gas tax holidays result in temporary reductions in pledged transportation revenues. However, impacts are typically mitigated through general fund transfers or the use of budget surpluses. Gas taxes on average make up a small portion of overall state budgets, so a temporary holiday should have a minimal credit impact.
Sources: Tax Foundation, Barclays, Moody’s, JP Morgan, Committee on Transportation and Infrastructure, Holland and Knight
This commentary reflects the opinions of Appleton Partners based on information that we believe to be reliable. It is intended for informational purposes only, and not to suggest any specific performance or results, nor should it be considered investment, financial, tax or other professional advice. It is not an offer or solicitation. Views regarding the economy, securities markets or other specialized areas, like all predictors of future events, cannot be guaranteed to be accurate and may result in economic loss to the investor. While the Adviser believes the outside data sources cited to be credible, it has not independently verified the correctness of any of their inputs or calculations and, therefore, does not warranty the accuracy of any third-party sources or information. Any securities identified were selected for illustrative purposes only, as a vehicle for demonstrating investment analysis and decision making. Investment process, strategies, philosophies, allocations, performance composition, target characteristics and other parameters are current as of the date indicated and are subject to change without prior notice. Not all products listed are available on every platform and certain strategies may not be available to all investors. Financial professionals should contact their home offices. Registration with the SEC should not be construed as an endorsement or an indicator of investment skill, acumen, or experience. Investments and insurance products are not FDIC or any other government agency insured, are not bank guaranteed, and may lose value.