



Insights & Observations
Economic, Public Policy, and Fed Developments
- Despite some stiff competition, we’d argue the breakdown in correlation between Brent oil and the 10Yr UST was the biggest economic news of the past month. The treasury curve had been trading tightly with the price of oil since the summer, but after September’s runup in rates following a break in technical resistance, a sharp selloff in AI stocks on overinvestment fears caused Treasuries to catch a bid. The 10Yr is sitting back under 5%, and we’re reassured to see it behaving in a more normalized manner.
- It would have been more reassuring still had Fed Chair Kevin Warsh not then tried to attribute this return to normalcy to the Fed’s September 25bps hike. In his October press conference, Warsh managed to partially undo some of the good he had done in September, in our eyes. He struck a dovish tone and attributed the above-mentioned normalization in yields to the Fed’s intervention, not AI concerns. He also stressed that he was happy with how the “spoonful of medicine” the Fed had administered was working through the economy, which given the infamous “long and variable lags” of monetary policy stretches plausibility. This follows an appearance in Thailand where he emphasized a stronger push from the press to more closely focus on monetary policy than he felt necessary. We still believe the Fed will ultimately remain committed to beating inflation, but we think Warsh hurt his credibility and came across a man hoping to change the subject from inflation.
- This is doubly concerning because inflation continues to surprise to the upside. Core CPI in September beat a tenth, +0.3% vs +0.2%, and came within a fraction of rounding to +0.4%. Inflation readings have been volatile but had been steadily falling into 2025; they appear to have bottomed out early that year, however, and have trended upwards since then, even before the war in Iran. One of the reasons we expect further Fed Funds hikes is the trend in inflation data suggests monetary policy likely fell below neutral and became accommodative in 2025, and it may be hard to cut below current levels.
- The Nonfarm Payrolls report at the start of the month missed, 29k vs. an expected 90k. The details of the report were more nuanced. The unemployment rate rose, but it was due to an increase in participation and not a fall in employment. Meanwhile, after a long period of bouncing between 34.2 and 34.3 hours, the average workweek has now been at 34.4 hours for two months. We might take all of this as evidence of healthy labor demand despite the headline miss had not the average hourly earnings missed, +0.1% vs. a consensus +0.3%. That’s still a reasonably healthy +3.0% on a trailing-year basis, comfortably higher than pre-pandemic norms. Earnings are still trending lower, however, and inflation is also higher than pre-pandemic levels, making nominal strength a little less impressive on a real basis.
- America voted in the midterm elections on Tuesday the 4th. Most, if not all, of the races have been settled by this time, and we will discuss election implications in future publications.
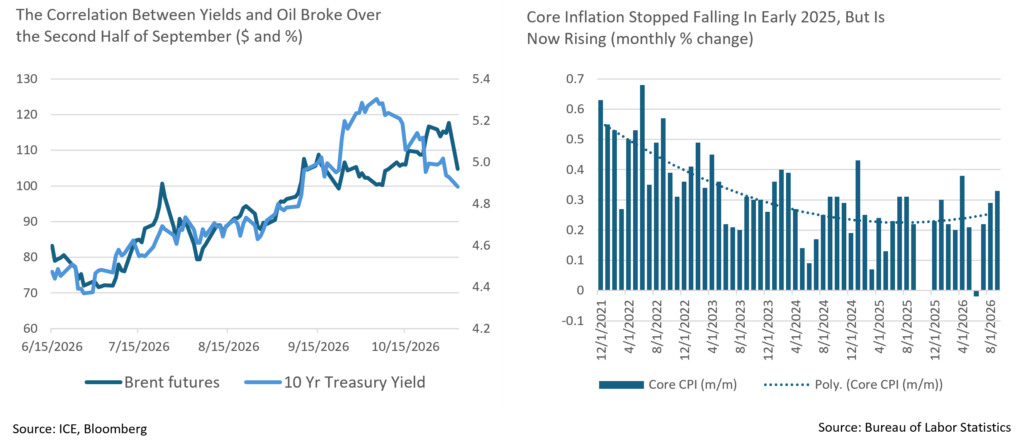
Sources: Bloomberg, Bureau of Labor Statistics, and Intercontinental Exchange
From the Trading Desk
Municipal Markets
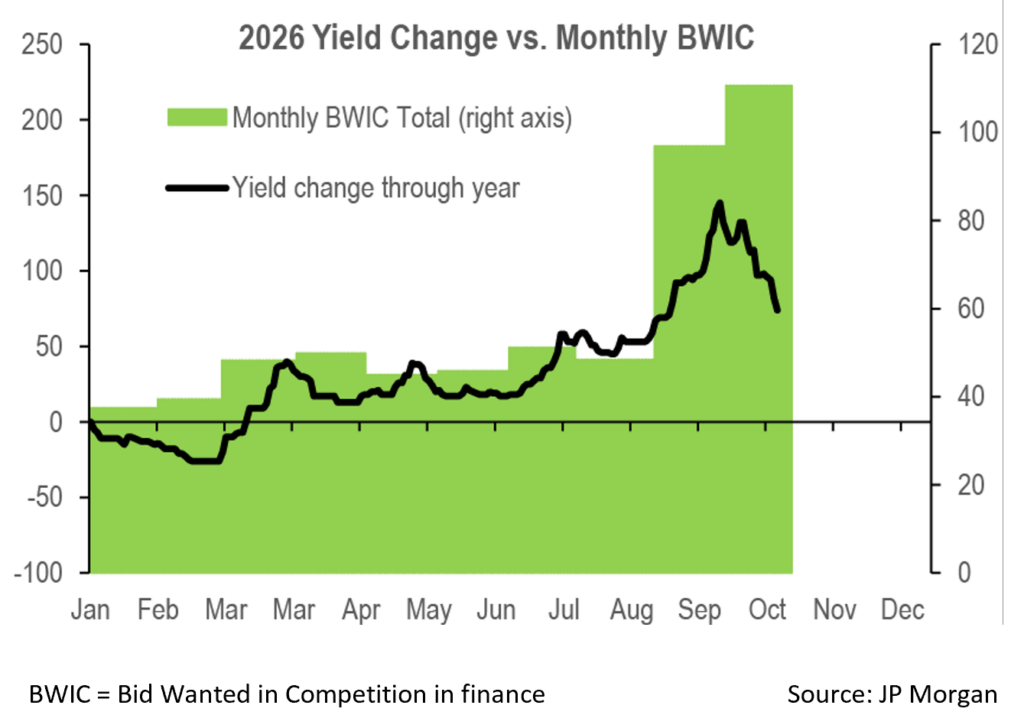
- After the sharp selloff in September, municipal yields started the month at multi-year highs on the back of record primary and secondary market supply.
- Having demonstrated significant value both on an absolute and relative tax-equivalent basis, October saw a significant rally in rates, almost fully retracing the yield increase of the prior month. This produced the best monthly October return since 1980 (JP Morgan) with the Bloomberg Municipal Bond Index gaining +3.85%. Specifically, 1 to 5-yr maturities saw yields drop by 76- 86bps, 7 and 10-yrs by 71bps, 12 to 15-yrs by 64-68bps points, and the long-end closed lower by 32bps.
- The municipal curve bull steepened dramatically as front-end yields fell by over a factor of 2x relative to the long end (80bps vs 32bps). Consequently, the 2-10s steepened by 17 bps, and within that range 2-5s accounted for 12 bps of the move. The 2-30s slope steepened by 56 bps to close at 215 bps, prompting many investors to embrace longer-dated maturities.
- Ratios richened substantially, with all points on the curve tightening by at least 2.75% and the front-end experiencing double digit ratio moves. Specifically, the 2-year got richer by 15%, the 3-year by 12.42%, and the 5-yr by over 10%. Ratios for the 7- and 10-yr portions of the curve fell by 8.7-9% in a descending fashion, and the month closed with most intermediate maturities in the 60-68% range.
- While net municipal fund flows were solidly positive (+$1.1 – $1.7B weekly), there was significant divergence between ETFs and municipal open-end funds. The former was strongly positive while the latter registered redemptions throughout the month on account of tax-loss harvesting trades.
- October saw $45B in long term tax-exempt supply, a slowdown of 7% relative to the prior October. However, on a YTD basis, issuance has increased 6% YoY.
Corporate Markets
- Stronger oil prices, persistent above-target inflation, and deficit concerns drove a September US Treasury sell off that spilled into October. That carryover was short lived as the October 7th FOMC minutes release confirmed a unanimous expectation of hiking rates further before the end of the year. A rate rally slowly ramped up mid-month with a rally fully in play to close out October. Intermediate and longer rates fell 30 – 35bps, well above the 7–16bps 1yr and in on the month. At one point the 10Yr benchmark bond broke through a resistance of 5%, and it has held in ever sense. We expect an additional hike in December and see potential for the curve to steepen over the 2 to 10Yr maturity range.
- The US Investment Grade market saw some spread widening amid a sizable UST rally. The Bloomberg US IG Corporate Index posted a positive total net return for the month and the best performing month YTD. Lower UST yields was a big factor, offsetting +7 bp OAS of spread widening. Despite credit underperforming USTs, investment grade fundamentals remained intact regardless of Fed policy uncertainty, inflation pressure, geopolitical risk, and higher energy prices.
- The primary market set an annual issuance record of $1.76 trillion even as mid-month volatility forced multiple borrowers to stand down. Even though new issuance is expected to slow somewhat, as fatigue from the AI boom is now impacting buyers, we anticipate a degree of further spread widening as year-end approaches.
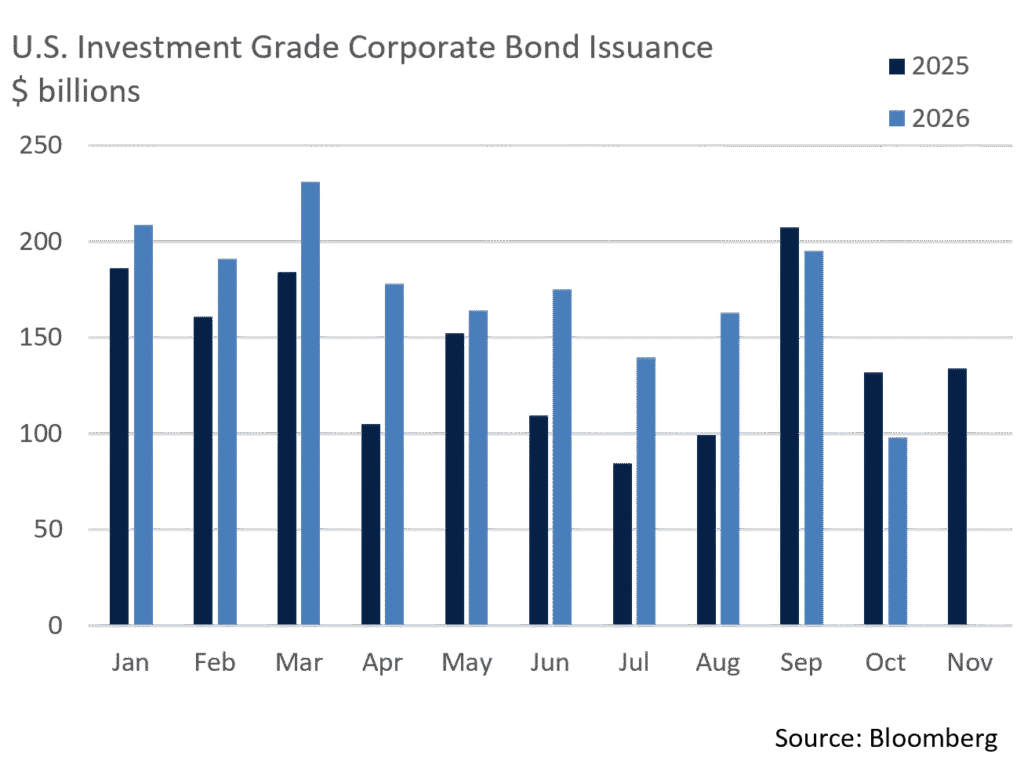
Sources: Bloomberg, Bond Buyer, Barclays, JP Morgan, and Lipper Inc.
Public Sector Watch
Bond Measures and Ballot Initiatives in the Recent Election
There were several sizable bond measures and impactful ballot initiatives on the ballot that deserve attention in the midterm elections. Looking first at bond measures, over $133B of bonds were on the ballot for approval in this election. This total is up over 11% from 2024, largely driven by population growth in the major issuers along with persistent inflation that has increased the cost of financed projects. Texas and California remain the primary drivers of new issuance, accounting for 47% and 38% of the total, respectively.
Turning our attention to ballot initiatives, various measures could have impact on municipal credit, with the most pertinent summarized below. The research team will monitor these and other initiatives and will periodically update our credit opinions.
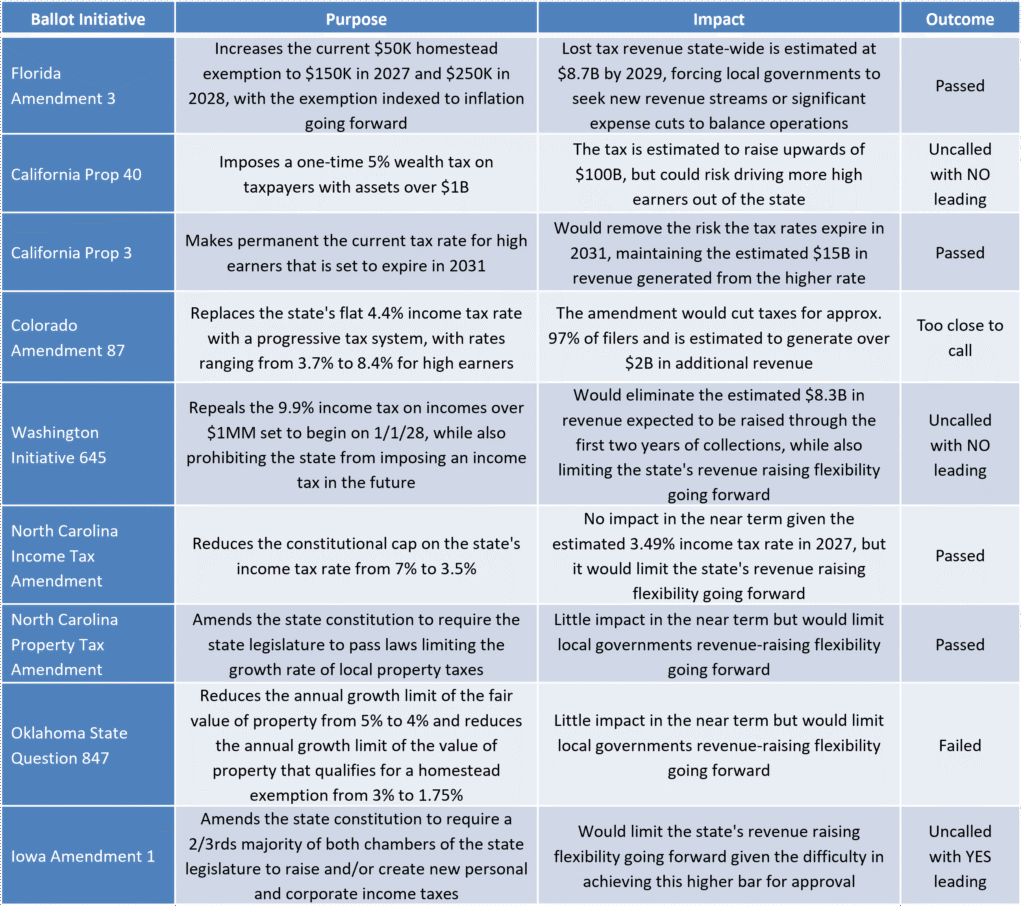
**Outcomes are generally unofficial and based upon the most recent data available.
Sources: https://ballotpedia.org/, California Secretary of State, Texas Bond Review Board, JP Morgan Research, Morgan Stanley Research, BondBuyer
This commentary reflects the opinions of Appleton Partners based on information that we believe to be reliable. It is intended for informational purposes only, and not to suggest any specific performance or results, nor should it be considered investment, financial, tax or other professional advice. It is not an offer or solicitation. Views regarding the economy, securities markets or other specialized areas, like all predictors of future events, cannot be guaranteed to be accurate and may result in economic loss to the investor. While the Adviser believes the outside data sources cited to be credible, it has not independently verified the correctness of any of their inputs or calculations and, therefore, does not warranty the accuracy of any third-party sources or information. Any securities identified were selected for illustrative purposes only, as a vehicle for demonstrating investment analysis and decision making. Investment process, strategies, philosophies, allocations, performance composition, target characteristics and other parameters are current as of the date indicated and are subject to change without prior notice. Not all products listed are available on every platform and certain strategies may not be available to all investors. Financial professionals should contact their home offices. Registration with the SEC should not be construed as an endorsement or an indicator of investment skill, acumen, or experience. Investments and insurance products are not FDIC or any other government agency insured, are not bank guaranteed, and may lose value.