


Insights & Observations
- The federal government reopened on November 12th after the longest shutdown in American history. The resulting continuing resolution will only fund most of the government through January 30th, so a second shutdown is possible, maybe even probable. Until then, however, we will be wrestling with two concurrent problems.
- First, a sizable backlog of federal economic data needs to be worked through. Some data, notably most of the October releases, will be missed altogether, with subsequent reports representing two-month changes. These reports are not expected until after the December FOMC meeting, therefore, the Fed will not have clarity on economic conditions after September when they next meet.
- The second and more subtle issue is that it’s unclear how much of an impact the shutdown had on the economy. A traditional rubric is a protracted shutdown can strip around 0.1% per week off GDP; this would suggest Q4 growth slowed more than a half point more than it might otherwise have. Even if the Fed did have more contemporaneous data, it would take a few more months to fully assess the impact the shutdown had on the real economy beyond a simple lack of data.
- Of the delayed releases we do have, the September jobs report was arguably the most encouraging. The 119k jobs created were still objectively weak, but more than double the Bloomberg consensus estimate of 51k, and higher than any of their surveyed forecasts. There were modest downward prior revisions, and the market response was driven by an unemployment rate increase from 4.3% to 4.4%. However, the rate rose due to marginally attached workers re-entering the workforce rather than a decrease in employment; this isn’t necessarily a “bad” reason.
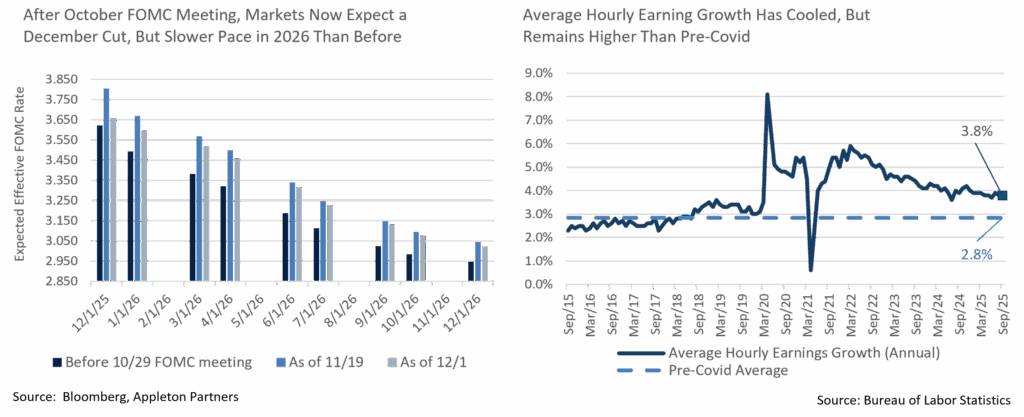
- If low job growth is due to low labor availability rather than demand, as a popular hypothesis holds, then one place you might find support for this is the average hourly earnings data that BLS releases with labor reports. For now, the evidence is inconclusive; earnings rose by less than forecast in September, though to be fair, this was a month when the potential workforce unexpectedly increased as more workers began searching for jobs. On a year-over-year basis, earnings are still showing healthy growth, at a better-than-expected +3.8%. This is a full point above the pre-Covid trend.
- After the October FOMC meeting, December rate cut expectations came full circle, driven largely by Fed speak. Quite possibly by design, the hawkish members most inclined to hold rates spoke early in the month and drove December cut probabilities down to an intra-month low of 29%. As dovish speakers took the floor in the second half of the month, market expectations reversed and now a December cut is fully priced in. However, while December expectations shifted significantly, longer-term ones were little changed. The Fed is now expected to cut in December (though, we would caution that markets are still too confident, given how closely the Fed is divided), but forward rate expectations for 2026 and 2027 gave back very little of their post-meeting movement. The market in aggregate expects the Fed to move slower in 2026 than before. While rate expectations are only 10bps higher by the end of 2026 than they were before October’s meeting, the cuts that will get us there are expected to occur later in the year, and a third cut is now less certain. The drama around a potential December cut has, in our eyes, obscured a meaningful shift in next year’s policy expectations.
Sources: Bloomberg, Appleton Partners, and Bureau of Labor Statistics
Economic, Public Policy, and Fed Developments
Equity News and Notes
A Look At The Markets
- Stocks were mixed in November as a late-month rally drove the S&P 500 into positive territory, extending its monthly winning streak to seven. The index rose +0.13% after trading down as much as -4.4% and now sits with an impressive YTD total return of +17.8%. As of November 20th, the Nasdaq was down as much as -7% MTD before rallying to close off -1.5%, snapping a 7-month winning streak. Both the DJIA (+0.3%) and Russell 2000 (+0.9%) outperformed the S&P 500 on the month but continue to lag the broader index by roughly 4.0% YTD. Technology was a laggard on the month, falling -4.4%, joining Consumer Discretionary and Industrials as the only sectors in the red. Eight sectors outperformed the broader index, led by Healthcare (+9.1%), which continued to bounce after trailing much of the year.
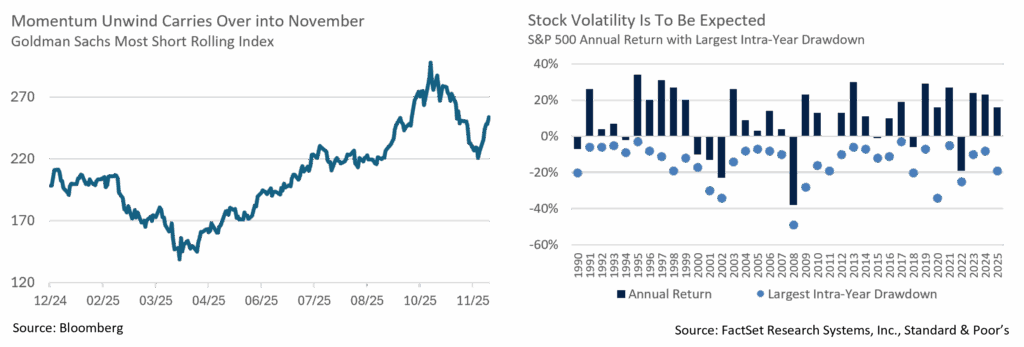
- November was marked by an increase in volatility as traders rotated out of momentum themes such as retail favorites, most shorted stocks, unprofitable technology, crypto, quantum computing, and AI darlings that had been outperforming off April’s lows. For context, Goldman Sachs’ Most Shorted Index gained an eye-popping +115% from April 8th through October 15th before falling -26% from the peak to November 20th, including a plunge of -5.5% on the 13th. These rotations were sparked by a choppy repricing of Fed rate cut odds, as Powell’s late-October press conference, hawkish Fedspeak, and the latest FOMC minutes all raised doubt that the Fed would ease further in December. Odds of a cut stood at 68% to start November, then dropped below 30%, only to close the month back above 80%. Heightened scrutiny surrounding spending, capex, and ROI on investment for AI companies exacerbated the volatility before greater stability emerged later in the month. We view these rotations as healthy as they were accompanied by money flowing into other areas of the market that had been lagging rather than indiscriminate selling.
- A widening of breadth was welcome as investors looked beyond a handful of megacap tech names. The equal-weight S&P 500 outperformed its market-cap peer by 179bps in November after trailing by a combined 616bps over the prior 2 months. Only 2 of the Mag-7 were positive in November (AAPL and GOOG) as NVDA closed -12.6%, weighing down this high-profile group. At ~35% of the index, we have highlighted the growing concentration risk of the Mag-7 in market-cap weighted indices such as the S&P 500.
- At its November low, the S&P 500 was -5.8% off its late-October all-time high, leaving the index with its second -5% drawdown of the year. During this period, the VIX spiked to 28 and many feared the start of something worse. In times of heightened volatility, it’s helpful to remember that drawdowns are normal, as the average year sees 3.4 declines of -5% or more and 29 trading days of -1% or greater (we’ve had 27 YTD). The market had advanced +38% off the April lows and gone 198 days trading above its 50-day moving average. The market’s strength heading into the latest drawdown was abnormal, not the drawdown itself. The S&P 500 has had 31 drawdowns of -5% or more since 2009 and is up 1,200%. Volatility is a feature, not a bug, of the market and the price of admission.
- The market still must contend with potential fallout from the upcoming Fed meeting on December 10th. Questions regarding cuts, the end of quantitative tightening (QT), and the real possibility that they start adding to the balance sheet (QE) are all up in the air. We believe the net result will be dovish and expect a tailwind for risk assets. Away from the Fed, the fundamental backdrop remains supportive as corporate profits are still growing at double digit rates, balance sheets remain healthy, and margins are expanding. Capex spending should remain robust, led by AI/tech spending, and share buybacks and M&A are expected to accelerate. The economy is in a soft-patch but looks ready to firm following the end of the record-long shutdown and monetary policy support. Finally, upcoming fiscal policy support measures are on the horizon as we look towards 2026. We remain vigilant for pullbacks and volatility but continue to see them as buying opportunities.
Sources: Bloomberg, FactSet
From the Trading Desk
Municipal Markets
- November saw little change in the municipal yield curve in the face of record municipal supply and intra-month volatility in UST rates. As investors contended with an inverted front end of the curve, the curve steepened slightly on the month, particularly within 10-year or shorter maturities. Specifically, the 2 to 30-year curve steepened by 3bps, while the 2 to 10-year and 2 to 5-year curves steepened by 4bps and 5bps, respectively.
- Relative to absolute yield moves, the 1-year saw the largest magnitude move, dropping by 6bps, while the 3-year stayed flat. The 5- and 7-year parts of the curve saw yields increase between 3 and 4bps, creating a curve twist. All spots on the curve north of 7 years saw yields either remain flat or change by only 1bp. Directionally, all experienced a yield increase other than the 15-year spot, which experienced a 1bp decline.
- AAA municipal ratios cheapened by 1-3% across the board and ended the month at 70% for 3 years, 67% over 5 years, 69% for 10 years, and 89% in 30 years.
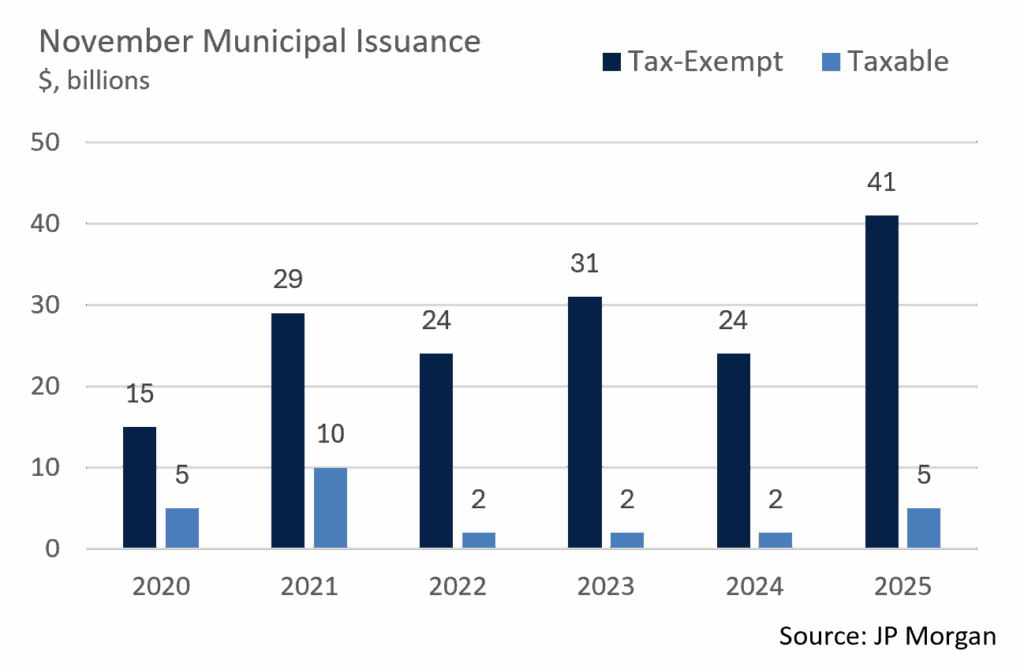
- According to JP Morgan, November gross municipal issuance totaled $45.2B, substantially higher than the same month of the prior year, marking the 3rd highest gross supply for the month on record, trailing only November 2010 and 2017. On a purely tax-exempt basis, supply of $40.7B marked the largest issuance month ever, slightly outpacing November 2017. This brings the YTD gross supply to $529B, of which tax-exempt issuance is $483B, levels that exceed 2024’s pace by 15 and 14%, respectively. New supply has been receding somewhat after a period of aggressive issuance, a trend that may prove to be supportive for municipals. This technical factor is also indicated by November estimated redemptions of more than $30B, along with subdued market activity around the Thanksgiving holiday.
- In anticipation of another 25bp Fed rate cut at the December 10th meeting, municipal fund flows sustained their upward momentum. November’s net flows of about $1.4B increased the YTD total to over $45B, the bulk of which (>$29B) is accounted for by ETF subscriptions.
Corporate Markets
- Investment Grade Credit spreads within the Bloomberg US IG Corporate Bond Index began the month at an OAS of 82bps before ending 2bps lower at 80bps. While that level is still elevated relative to the last few months, it is narrower than the YTD average of 85bps. The backdrop in Investment Grade remains strong, with demand continuing to outpace supply. Technical drivers have been persistent and do not appear to be letting up anytime soon as spreads remain range-bound. With a Fed rate cut in the cards for December, there could be further downward pressure on spreads as we close out the year.
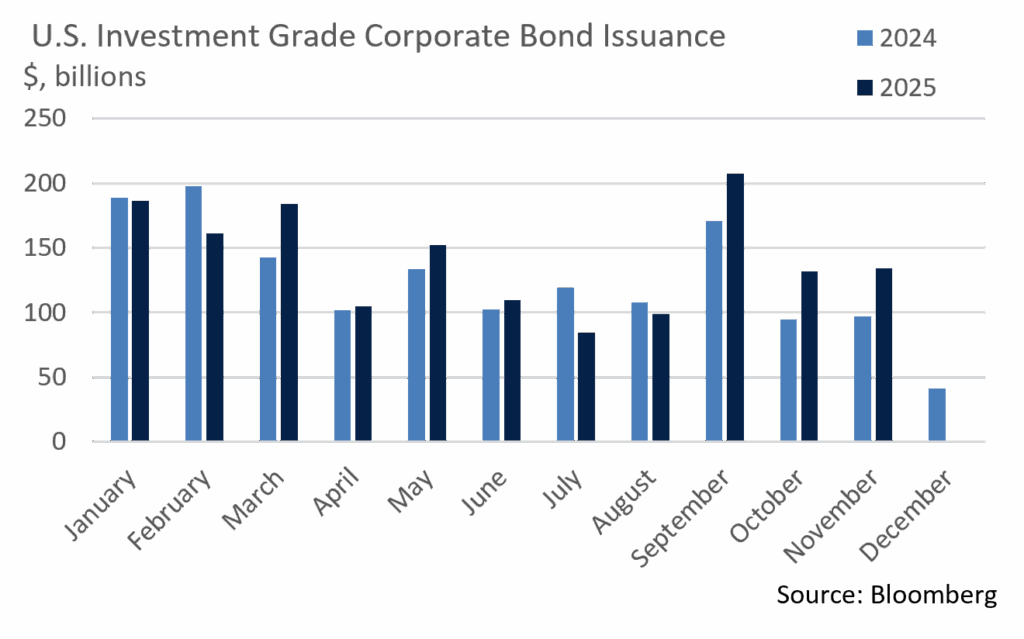
- November’s supply of $134B of Investment Grade bonds fell $3 billion short of November 2012’s record level. Several large deals came over the course of the month, and most offerings were met with considerable support from buyers chasing yield. On average, deals were 3+ times oversubscribed, with pricing coming in much tighter than initial expectations. December supply tends to be on the lower and slower side, and syndicate desks are calling for $40B of new deals to end the year. While there is potential to reach the $1.6T issuance mark for 2025, issuers will pick their spots going into year-end.
- High Yield bonds sustained their rally in November with the yield on the Bloomberg US Corporate High Yield Index ending the month at 6.57%. That ties the previous YTD low of September 18th and is 65bps off the average and 190bps below the YTD high. Issuers took advantage of lower yields and tighter spreads to bring $21B of new high yield offerings to market. This is an indication of favorable overall credit conditions, marking the largest November issuance since 2021. However, we anticipate that buyers will be more cautious in December given the delay in economic data and a dovish Fed.
Sources: Bloomberg, Barclays, JP Morgan, and Lipper
Financial Planning Perspectives
Benefits of a Risk-Efficient Equity Portfolio
As a fiduciary, Appleton’s responsibility is to help our clients pursue long-term growth while ensuring that investment decisions reflect prudent risk management, thoughtful analysis, and alignment with personal financial objectives. There are many financial metrics that we look at in analyzing our portfolios, and one we would like to highlight is the Information Ratio.
Information Ratio – Consistent, Repeatable Outperformance
The Information Ratio evaluates the consistency of excess returns relative to a strategy’s benchmark. It measures active return1 divided by tracking error.2 Higher values indicate more significant, repeatable outperformance, a characteristic often associated with manager skill rather than luck or factor exposure.
What Does a Consistently Strong Information Ratio Suggest:
- The higher the ratio the better, as it indicates superior risk-adjusted performance.
- Active decisions, or manager choices, are contributing meaningfully to performance.
- Outperformance has occurred across multiple periods, not solely over very short ones or by virtue of isolated trades.
- The strategy evidences a sustainable edge rather than relying on speculation.
ACES – the Appleton Concentrated Equity Strategy
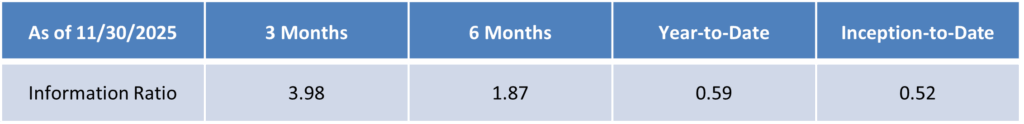
Our newest investment offering, the Appleton Concentrated Equity Strategy (“ACES”), may be appropriate for clients seeking an equity portfolio built around our highest-conviction ideas and designed to deliver risk-efficient long-term performance. While the strategy is less than two years old, it’s information ratio from inception-to-date is positive, a trend which we hope will continue.
This strategy is a concentrated, high-conviction equity approach typically composed of 20–25 positions. It follows an active, research-driven investment process designed to generate superior risk-adjusted returns relative to the benchmark. The portfolio focuses on established companies, generally with market capitalizations above $10 billion, and employs equally weighted, high active share position sizing relative to the S&P 500. Sector exposures are unconstrained, allowing the team to pursue compelling opportunities wherever they may arise.
This investment strategy can serve as a complement to a traditional balanced or fixed income-only portfolio and may be well suited for a Roth IRA or other retirement accounts with a longer time horizon and minimal withdrawal needs. It may also be appropriate for clients in the accumulation phase who prioritize higher growth over income and are able to accept equity risk.
Information Ratio for the Appleton Concentrated Equity Strategy:3
Please reach out to your Wealth Manager if you would like more information about ACES or other Appleton Wealth Management investment strategies.
- Active return is defined as portfolio return minus benchmark return.
- Tracking error is a fluctuation measurement of a portfolio relative to its benchmark. It is defined as the standard deviation of the difference between portfolio return and benchmark return over a given time period.
- Data derived from ACES model and not from actual client accounts. Information ratio for client accounts will vary. ACES model inception date is May 22, 2024. The benchmark for this strategy is the S&P 500 Index. For illustrative and comparative purposes, performance of the SPDR S&P 500 ETF Trust (“SPY”) is used as a proxy for the S&P 500 Index. This data is shown for informational purposes only. Past performance is not indicative of future return.
Source: Appleton Partners, Inc., Bloomberg, https://www.investopedia.com/terms/i/informationratio.asp
At Appleton Wealth Management, we take great pride in the financial planning services provided to our clients. Is there someone you care about who might benefit from working with us, but you’re unsure how to make the introduction?
If so, please let us know. We are happy to help.
Please contact your Wealth Manager or Jim O’Neil, Managing Director
617-338-0700 x775 | [email protected] | www.appletonpartners.com
This commentary reflects the opinions of Appleton Partners based on information that we believe to be reliable. It is intended for informational purposes only, and not to suggest any specific performance or results, nor should it be considered investment, financial, tax or other professional advice. It is not an offer or solicitation. Views regarding the economy, securities markets or other specialized areas, like all predictors of future events, cannot be guaranteed to be accurate and may result in economic loss to the investor. While the Adviser believes the outside data sources cited to be credible, it has not independently verified the correctness of any of their inputs or calculations and, therefore, does not warranty the accuracy of any third-party sources or information. Specific securities identified and described may or may not be held in portfolios managed by the Adviser and do not represent all of the securities purchased, sold, or recommended for advisory clients. The reader should not assume that investments in the securities identified and discussed are, were or will be profitable. Any securities identified were selected for illustrative purposes only, as a vehicle for demonstrating investment analysis and decision making. Investment process, strategies, philosophies, allocations, performance composition, target characteristics and other parameters are current as of the date indicated and are subject to change without prior notice. Registration with the SEC should not be construed as an endorsement or an indicator of investment skill, acumen, or experience. Investments in securities are not insured, protected or guaranteed and may result in loss of income and/or principal.