



Insights & Observations
Economic, Public Policy, and Fed Developments
- September’s month-end spike in Treasury yields was certainly dramatic and is covered in length elsewhere in this update. The longer-term setup for the move deserves attention, however; much attention has been paid to the continued oil price pressures as the Iran war drags on with no obvious end. There has been recent progress here; the US Navy has been effective in the Strait of Hormuz and estimates suggest we’re likely getting 50% of prewar volume through Hormuz, and including pipeline alternatives overall is now up to around 80% of prewar norms. But the situation remains fragile.
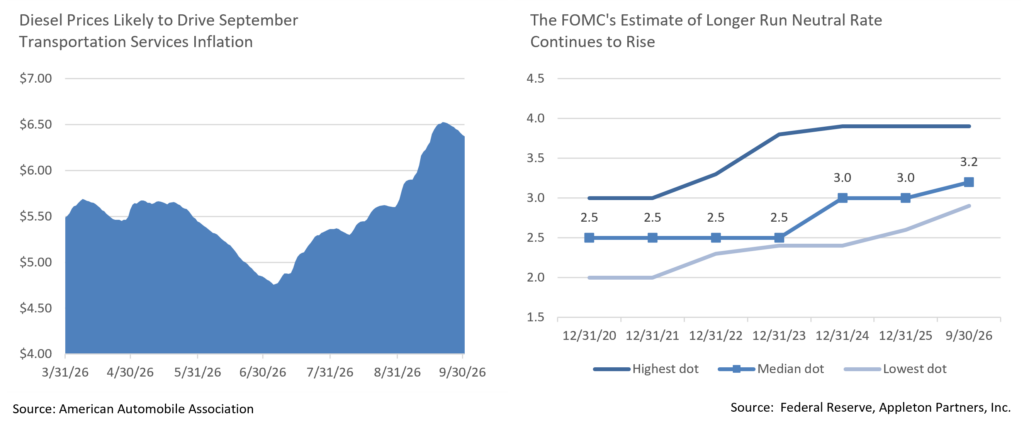
- Less attention has been paid to the long-term neutral rate, however, and we think this is another important factor. The FOMC’s assessment of what a “neutral” long term rate is for the US economy has quietly been shifting upwards for years. The current median dot, 3.2%, is higher than even the highest dot at year end 2020, and the lowest estimate today is still comfortably above the long-standing 2.5% in the post-Great Financial Crisis era. There are a number of possible reasons for this, though we would give strong consideration to national debt now exceeding 120% of GDP. But, in an environment where the neutral rate is approaching 4%, a historical norm of 100bps of curve steepness between the front of the curve and the 10yr does suggest long rates should be approaching 5%, as well. The market may not have been paying enough attention to this, and it appears to have now caught up.
- Thankfully, the economy elsewhere looks robust. Consumer spending remains extremely strong, with August retail sales well surpassing expectations at the headline, 1.2% vs 0.8%. Core measures were nearly triple, with ex Auto and Gas 1.2% vs 0.4% and “control group” 1.4% vs 0.5% control group. The Real Personal Spending report accompanying PCE was strong as well, a tenth over expectations at 0.6%. July’s weakness now increasingly looks like a blip. While there was some early evidence that high gas prices were dampening spending elsewhere, that increasingly looks to have faded.
- Inflation data showed nominal improvement last month, and in particular PCE fell from 3.3% to 3.0%. We’d suggest caution; the main driver here was a methodology changed that had been estimated to strip 0.2-3% off the headline. Cell services have been oddly hot for several months now and there’s growing price pressures in transportation services. This should only worsen next month, with AAA’s national average diesel price rising from $5.63 to a high of $6.51 over the month.
- After a shaky start in his first two meetings, Warsh did everything he needed to do in his press conference on the 16th. His continued refusal to provide not only forward guidance, but much of anything on Fed’s reaction function, remains a source of risk for longer rates and should increase the term premium, but he squarely put to rest any concerns he was trying to merely talk inflation down without doing anything. While he refused to answer a question on his estimate of the neutral rate directly, elsewhere he referred to the hike as removing “a dose of accommodation” and indicated he’d be “hard pressed to see conditions as restrictive,” strongly suggesting he thought we were below it and further hikes were likely. He also took an opportunity at his press conference to suggest his views were more hawkish than the averages expressed in the dot plot. Rates may have moved aggressively at the end of the month, but the week’s stability following the Fed meeting suggests this had little to do with Warsh.
Sources: U.S. Census Bureau, Federal Reserve, Bureau of Economic Analysis, American Automobile Association
Equity News and Notes
A Look At The Markets
- September lived up to its reputation as the market’s weakest month of the year with stocks closing mostly lower over the final month of the quarter. The S&P 500 dropped -0.5%, the Nasdaq gained +1.9%, the DJIA fell -4.3%, and the Russell 2000 fell -5.4% as any gains were concentrated in mega-cap tech. The Technology sector rose +4.4% and Communication Services gained +4.3%, making them the only sectors to finish higher. Cyclicals and rate-proxies were the hardest hit, as Financials (-7.3%), Materials (-6.9%), Real Estate (-6.7%), and Utilities (-6.1%) all sharply underperformed. Both the Nasdaq and Magnificent 7 reached fresh record highs towards the end of the month, but those milestones masked weakness elsewhere rather than signaling a broad rally.
- Market participation deteriorated in September, with the equal-weight S&P 500 falling -5.2% and riding a 6-week losing streak, its longest since 2022. While the market-cap weighted index closed the month within 2% of its all-time high, over half of the index is down at least -15% from their respective highs. Further illustrating the contrast between the largest companies and the broader market, only 43% of S&P 500 stocks ended the month above their respective 200-DMAs, a technical indicator often used to signal long-term trend. We’ve been vocal about our preference to see broad participation as part of a healthy bull market, but we’d caution against being too bearish based on breadth alone. It is a poor timing tool, and divergences can persist for months. You do not have to go far back for an example as 2024 and 2025 combined saw the S&P 500 (+43.5%) double the performance of the RSP (+21.4%). Corporate earnings, margins, and free cash flow growth remain strong, and valuations remain supportive with the S&P now trading at 19.0x forward earnings, below the 5- and 10-year averages.
- Corporate fundamentals tied to artificial intelligence provided the strongest support for equities, with semiconductor shares advancing 9.5% during the month. Improving models and expanding AI assistant applications reinforced demand for chips, memory, and cloud infrastructure, while encouraging industry conference commentary supported expectations for continued investment. Beyond technology, conference updates indicated stable consumer demand and constructive business conditions heading into third-quarter earnings season. Economic releases also suggested resilience as the September labor report showed an increase of 162K jobs against 55K expected, while core retail sales rose +1.4%, exceeding the anticipated +0.5% increase. September’s preliminary business activity readings strengthened further, although accompanying supply constraints and pricing pressures complicated the picture. Investors balanced these encouraging signs of demand against the possibility that stronger growth would prolong inflation pressures and keep borrowing costs elevated.
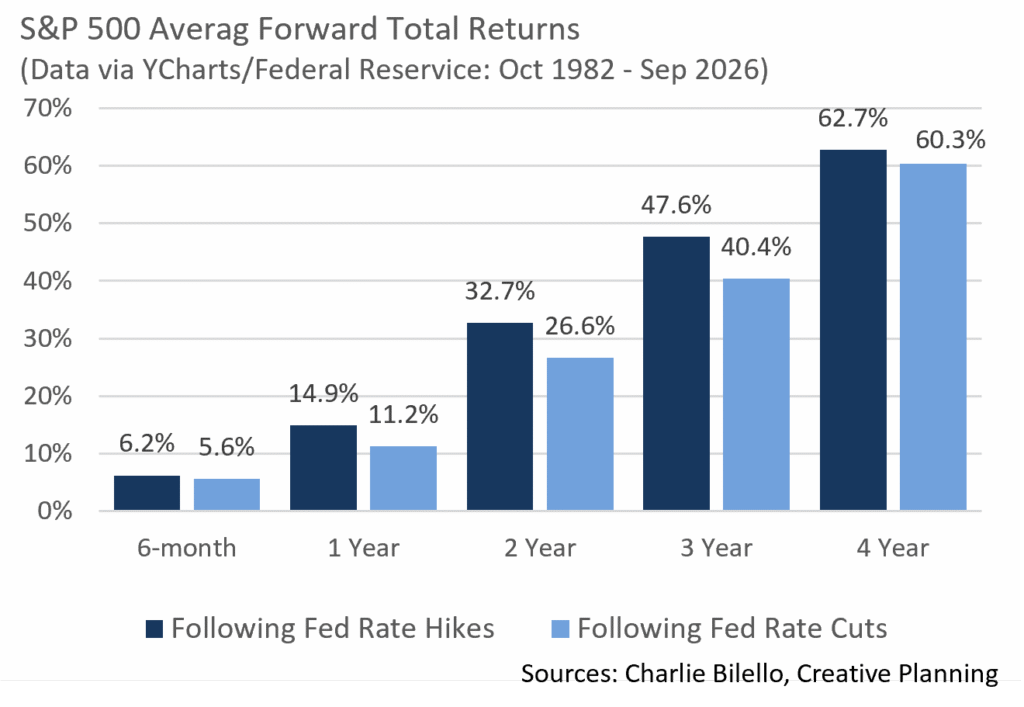
- Interest rates were the month’s dominant counterweight to corporate optimism. On September 16, the Fed raised its policy rate by 0.25% to 3.75%–4.00%, its first increase in more than three years, and policymakers signaled further tightening. The 2Y and 10Y Treasury yields each increased by 55 bps, ending September at 4.89% and 5.30%, respectively, pressuring rate-sensitive sectors despite generally constructive corporate fundamentals. Historically, stocks don’t behave well when rates move quickly in either direction. That said, the most recent move has been due, in part, to an improving economic growth backdrop with recent Atlanta Fed GDP estimates hovering near 5% for Q3 and the Citi Economic Surprise Index moving higher. Recent history suggests stocks can advance in the face of rising interest rates. The 10Y Treasury bottomed on 8/4/2020 at 0.50% and currently sits at 5.28%. During that time, the S&P 500 has returned 152%, or +16.3% annualized, over the same timeframe.
- Looking into October, the combination of resilient demand, uneven inflation progress, and tighter monetary policy makes upcoming inflation and employment reports, Federal Reserve communications, and third-quarter earnings important monitoring points. Corporate guidance will help investors assess whether the constructive business conditions described during September are translating into sustained profitability despite higher financing and input costs. Within technology, the relationship between AI investment, customer adoption, and earnings remains important, particularly after September’s gains reinforced the influence of a relatively narrow group of companies. Valuations and concentration warrant attention alongside evidence of breadth improvement across sectors and company sizes. Energy supply conditions also remain relevant because September’s disruptions added pressure to prices and the growth outlook. While risks remain, the appropriate focus is on how incoming evidence changes the balance between corporate fundamentals and economic constraints, rather than extrapolating either technology strength or broader market weakness into a forecast.
Sources: Bloomberg, FactSet
From the Trading Desk
Municipal Markets
- September was a record setting month for municipals, albeit not in ways market participants were anticipating or hoping for. Underpinned by macro concerns about inflation, federal government fiscal concerns and the outlook for real rates, municipal rates sold off violently to cap a month that recorded the worst monthly performance for the asset class since 2008 as measured by the Bloomberg IG Tax-Exempt Index.
- On the back of a significant US Treasury selloff, municipal activity was amplified by substantial tax-loss harvesting activity in the secondary market that led to disproportionate down moves and substantial underperformance relative to Treasuries. Municipal yields rose by anywhere from 53bps to 102bps in a descending fashion, with the front end underperforming all other parts of the curve and setting up comparisons with other notable market-resetting events like the COVID shut-down and “Liberation Day.”
- The municipal curve bear-flattened dramatically in September as front-end yields skyrocketed to twice the move seen by the long end of the curve. The 2-10s slope flattened by 28bps, with the 2-5 segment accounting for 11bps of that move. The 2-30s slope flattened by 48bps to close the month at 159bps, fully offsetting the steepening we had seen prior to September.
- Ratios cheapened across the board but inside of 5-years on the curve saw double digit repricing, with the 2-year getting cheaper by 14.5%, the 3-year by 12.75% and the 5-yr by over 10%. Parts of the curve starting in 7-yrs saw relative cheapness of 3.4-8% in a descending fashion and September closed the month with all maturities out to and including the 10-yr seeing ratios > 70% to USTs. The long bond ratio closed the month at over 91% of its taxable counterpart.
- Despite the volatility that dominated the market and some issuers consequently choosing to postpone their deals, supply of long-term tax-exempt debt totaled $52B, setting a record for September issuance according to JP Morgan.
- While preliminary, September shows as a positive inflow month of approximately $5.2B coming into the asset class as noted by JPM, totals are subject to change and may even drive the totals into negative territory as funds that report less frequently are set to publish their numbers.
Corporate Markets
- September turned out to be an extremely volatile month for Treasury yields. After ending august at 4.75%, yields rose slowly in the lead up to the September FOMC meeting, testing resistance at 5%. This level held after a well-received Fed Funds rate hike but broke abruptly one week later. The impetus may have been hotter than expected S&P PMI reports, but these were only modestly stronger than expected and this is not normally a market-moving release; simple fatigue and capitulation after a month of rising oil prices and concern about the long-end was more likely the primary reason. The 10yr ultimately set an intra-day high of 5.30% before closing the month at 5.28%. This represents the highest yield offered by the 10yr Treasury since 2007, before the Great Financial Crisis, nearly twenty years ago.
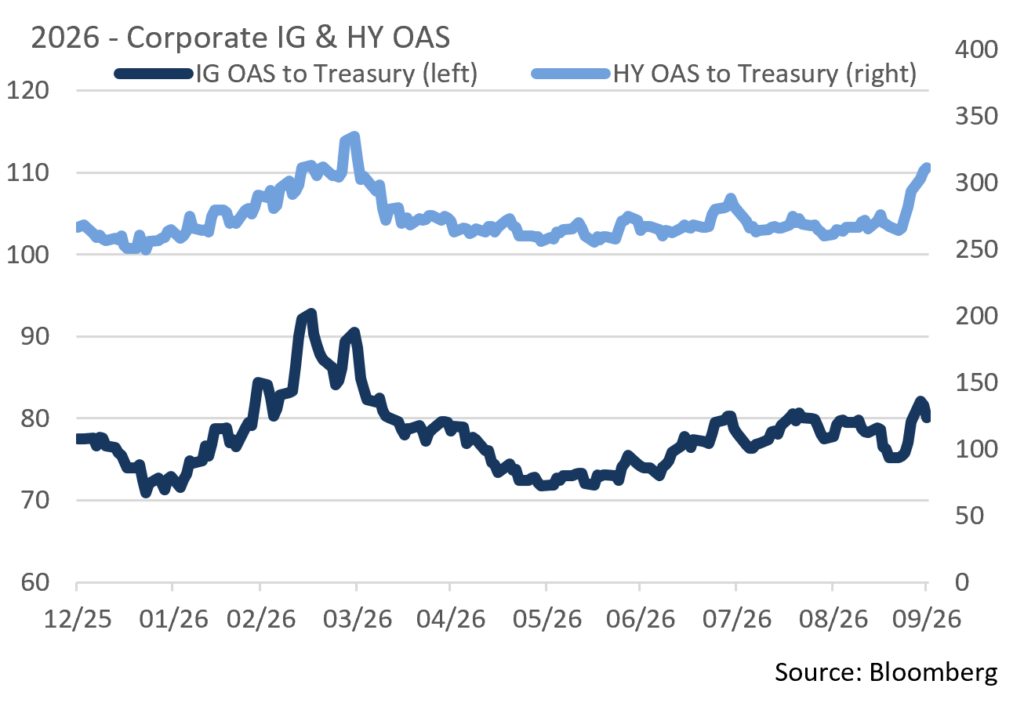
- US Investment Grade credit spreads remained range-bound and proved to be resilient given the volatility in US Treasury rates over the month. The Bloomberg US IG Corporate OAS moved just 3bps higher, reaching 80bps, with the high on the month of 82 bps, 7bps off the monthly low of 75bps. September month-end spread levels sit right on the YTD averages with the highs hitting back in March, still well below the 5yr average of 112bps. We do seem to be close to an inflection point. Pressure from US Treasury rates, further economic uncertainty, and another Fed Funds rate being priced in before month end could create a pause in demand for Investment grade bonds, allowing spreads to move slightly higher. While we remain cautious, we continue to manage keeping with our quality and duration bias.
- The rapid pace of issuance so far in 2026 began to slow as the month progressed. The $195B in issuance fell short of the $215B the market expected. A lower quality jumbo M&A deal brought by Paramount did garner lots of attention on the last day of the month. The $30B deal was the 6th largest on record and the largest since Amazon’s $37B deal back in March (4th largest on record). Demand reached 3.6x the amount of bonds available. Investors gravitated to the shorter/intermediate tranches driving some long end attrition which reshaped the deal overall. The technical backdrop of the investment grade primary market continues to be stable, but issuers are moving with caution given absolute yield levels, as well as the overarching theme of rate volatility. Expectations are for a slowdown in issuance in October and possibly the balance of the year.
Sources: Bloomberg, Bond Buyer, Barclays, JP Morgan, and Lipper Inc.
Financial Planning Perspectives
Year End Tax Planning
As we do every year when the calendar turns to October and we enter the fourth quarter, we begin to think about some year-end tax planning strategies. Many clients have inquired recently about what they can do before year end to increase their retirement savings, take advantage of charitable giving or look for some tax-reducing strategies. Below we map out some ideas and strategies clients may want to consider before December 31, 2026.
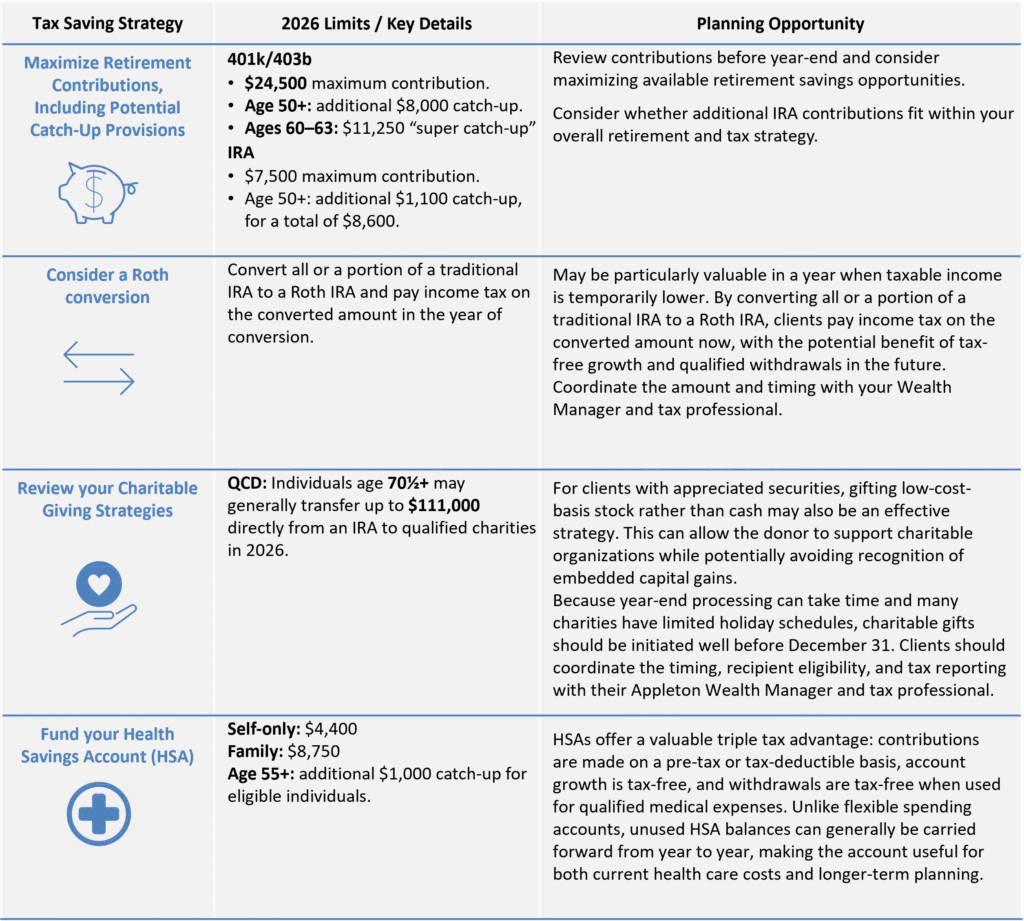
Before you carry out any significant changes, please coordinate a discussion with your Appleton Wealth Manager and your tax professional. Best wishes from Appleton Partners Wealth Management as we enter the 2026 holiday season.
Source: Internal Revenue Code and Certified Financial Planner Board of Standards, Inc.
This commentary reflects the opinions of Appleton Partners based on information that we believe to be reliable. It is intended for informational purposes only, and not to suggest any specific performance or results, nor should it be considered investment, financial, tax or other professional advice. It is not an offer or solicitation. Views regarding the economy, securities markets or other specialized areas, like all predictors of future events, cannot be guaranteed to be accurate and may result in economic loss to the investor. While the Adviser believes the outside data sources cited to be credible, it has not independently verified the correctness of any of their inputs or calculations and, therefore, does not warranty the accuracy of any third-party sources or information. Specific securities identified and described may or may not be held in portfolios managed by the Adviser and do not represent all of the securities purchased, sold, or recommended for advisory clients. The reader should not assume that investments in the securities identified and discussed are, were or will be profitable. Any securities identified were selected for illustrative purposes only, as a vehicle for demonstrating investment analysis and decision making. Investment process, strategies, philosophies, allocations, performance composition, target characteristics and other parameters are current as of the date indicated and are subject to change without prior notice. Registration with the SEC should not be construed as an endorsement or an indicator of investment skill, acumen, or experience. Investments in securities are not insured, protected or guaranteed and may result in loss of income and/or principal.