



Insights & Observations
Economic, Public Policy, and Fed Developments
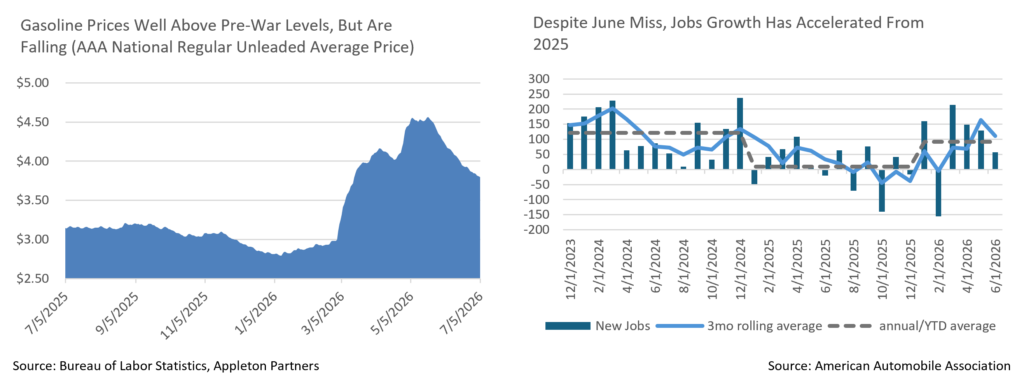
- The signing of a Memorandum of Understanding with Iran on June 17th may leave a lot of questions unsettled, and in the weeks since it has mostly held although tensions in the Middle East remain high and periodic flare-ups have occurred. But it provides the basis for a more stable ceasefire, and for negotiations toward a lasting peace. However, it also brings an unusual macro risk. Last month, we noted some evidence that high energy prices may have actually been depressing core inflation, by straining household budgets and forcing consumers to become price sensitive. Evidence for this continued to build in June, notably with a PPI report where the trade services component suggests sizable producer margin compression. Since oil began to flow through the Strait of Hormuz, gasoline prices have fallen 17% in the US, from over $4.50 to under $3.80. And, if rising gas prices appeared to suppress core inflation in the past few months, then it stands to reason that their fall could paradoxically cause core inflation to reaccelerate.
- What we can say so far is that consumer spending does appear to have weathered high energy costs unexpectedly well. Personal consumption data had been strong during the war, but early months may have been boosted by tax returns. By May, tax returns should not have been a major factor, yet personal consumption remained robust at 0.7% nominal and 0.3% real, both a tenth better than expectations. Any acceleration, both here or in the also-strong retail sales release (which is not inflation-adjusted, but the ex-auto and gas and “control group” series also beat, 0.5% vs 0.3% and 0.7% vs 0.4%, respectively) could be a warning sign that core inflation may reaccelerate as energy prices fall.
- June’s Nonfarm Payrolls missed badly, halving expectations at +57k with a further -74k in prior period revisions. However, the
- report was not unequivocally bad; the unemployment rate still ticked down to 4.2%, and as-expected average hourly earnings of 0.3% monthly and 3.5% trailing one year both accelerated and still suggest the overall trend remains a slowly tightening market. YTD job growth now averages +92k jobs a month, well above 2025’s +9.7k and only slightly below 2024’s rate of +122k.
- This matters because even a slightly stronger labor market has major implications for Fed policy. Coming into 2026, markets were concerned about labor market softness and felt inflation was under control (at the time, we disagreed with both). War in Iran shifted market attention back to inflation. However, job growth has solidified since then, so even if the current ceasefire takes pressure off inflation, the labor market case for rate cuts no longer exists. We believe inflation could worsen and could force the Fed to raise rates, but if it doesn’t, we think the Fed will remain on hold, and long-run neutral estimates will rise.
- New Fed Chair Kevin Warsh certainly gave markets no reason to look for cuts. The Fed’s June statement was cut to the bone, to less than half the length of recent statements, and in his Q&A, Warsh pushed back aggressively when asked to provide anything remotely close to what he considered forward guidance. Warsh was an inflation hawk before being nominated by President Trump to chair the Fed, making him an unlikely candidate to cut rates anyway despite President Trump’s own preferences, but what little color he provided in his first meeting does suggest cuts are unlikely; the closest thing to forward guidance in either the Q&A or his remarks was a terse “The Committee will deliver price stability” at the end of the Fed Statement.
Sources: Bureau of Labor Statistics, American Automobile Association, Bureau of Economic Analysis, U.S. Census Bureau, and Federal Reserve
Equity News and Notes
A Look At The Markets
- Stocks were mixed in June as both the S&P 500 (-1.1%) and Nasdaq (-2.8%) closed the month lower despite hitting fresh all-time highs earlier in the month. The DJIA (+2.5%) and Russell 2000 (+3.6%) fared better as they are less exposed to mega-cap tech and the slumping Magnificent 7 (-8.9%). Despite headline losses, six sectors finished higher in June, with a mix of cyclical and defensive sectors outperforming, led by Industrials (+7.2%) and Healthcare (+6.5%). Communication Services (-7.9%), Consumer Discretionary (-4.8%), and Tech (-3.3%) all underperformed on the rotation out of the Mag 7 and software. The Energy sector was the other notable laggard as WTI crude closed the month back below $70/barrel, plummeting -20.4% for its worst month since November 2021.
- June’s weakness did little to diminish what was otherwise an exceptional quarter for investors. The S&P 500 (+14.9%) and Nasdaq (+21.4%) both logged their best quarters since Q2 2020, and for the S&P, it was the 12th best quarterly performance since 1950. For small caps, Q2 was the 8th best for the Russell 2000 (+21.2%) going back to the inception of the index in the 1970’s. In the context of the election cycle, the quarter was more impressive. The S&P 500’s +14.9% gain in Q2 was the best second-quarter return of any midterm election year since 1938. The result stands in stark contrast to historical trends, as the second quarter of a midterm year has traditionally been the weakest quarter of the four-year presidential cycle, averaging a -4.4% loss. Historic returns following quarterly gains of >10% are decidedly positive with 3- and 6-month median returns of +4.7% and +9.6%, respectively.
- In a reversal of May’s narrow leadership, June brought increased participation in the rally as the equal-weight S&P 500 (RSP) outperformed the cap-weighted index by 295 bps, finishing the month +1.9% higher. Market internals confirmed the breadth expansion with 62% of stocks in the S&P 500 trading above their respective 200-day moving averages by the end of June. That’s the highest reading since early March and well above the 56% mark on 6/2, the last time the cap-weighted index reached an all-time high. Also confirming the broadening out was the cumulative advance/decline reading, which made a new all-time high to close the month despite the headline index losses for the month. We continue to view a wider cohort of stocks contributing to market gains as a healthy, rotational trade and will monitor how it plays out in the coming months.
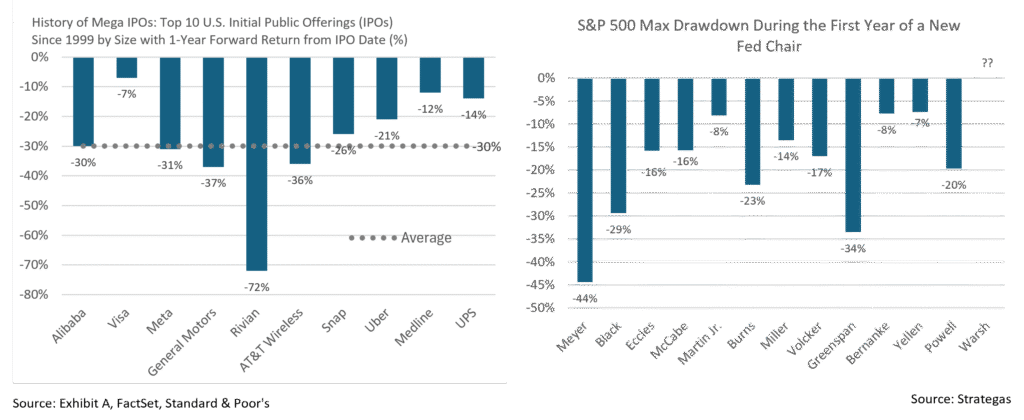
- Some market commentators attributed the Magnificent 7’s June weakness to traders reducing exposure to the group to raise dry powder for the SpaceX IPO. It’s possible, but the clamor around the debut of the stock early in June was undeniable, with a first trading-day return of nearly 20%. Evaluating a company that is unprofitable is difficult, and recent valuations have the company trading at over 100x sales. Regardless of your view on the prospects of the future earnings’ power, history says investors might be given a better entry point at some point over the first year of trading.
- The Fed’s approach to monetary policy under newly appointed Chair Kevin Warsh is another factor worth watching as we enter the second half of 2026. His first press conference as Fed Chair in mid-June was viewed as hawkish as he made it clear that price stability was paramount and that inflation would not be tolerated. He also significantly shortened the FOMC statement and removed much of the forward guidance. As we’ve noted often, markets hate uncertainty, and volatility stems from the unknown, so it would not be entirely surprising to see above-average drawdowns (avg -19.6%) during the first year of a new Fed Chair. Not a prediction, but something we are certainly being mindful of.
Sources: Bloomberg, FactSet
From the Trading Desk
Municipal Markets
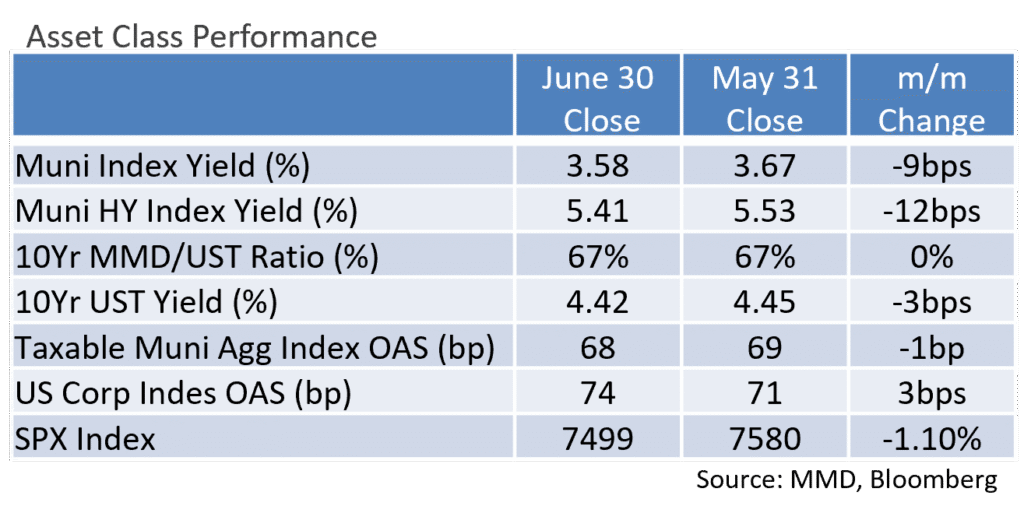
- During the month of June, municipals largely tuned out the Treasury market noise as yields and ratios ground lower despite robust supply and technicals that seemed less than ideal to start the month. Positive investor sentiment in the municipal market continued, and they consistently directed capital to the asset class despite geopolitical headlines persisting.
- Municipal yields moved in a barbell fashion, with the 2 ends of the curve outperforming the belly as the front and back ends of the curve experienced strong downward moves in yield. The 1-year maturity moved meaningfully lower, with the respective yield lower by 10bps. Maturities in the 3- to 12-year spots saw yields marginally lower by 3bps across the board, while the 20- to 30-year maturities registered lower yields by 14bps to 16bps.
- With the exception of the 2nd week of June, when municipals underperformed, ratios consistently moved lower as municipals provided an attractive haven during the UST market volatility. All points on the curve saw tighter ratios, with the barbell ends of the curve registering the most meaningful moves. Notably, the 2-year saw its ratio move lower by 4.36% while the 7- and 10-year spots richened by 1.4- and 1.06%, respectively. The 20- and 30-year ratios both closed the month lower by 2.66%
- On an absolute basis, the 2- and 3-year spots closed the month sub 60%, 5- and 7-year hovered in the 61-63% range, while the 10-year maturity settled at approximately 66%. At the long end of the range, the 25- and 30-year spots closed at approximately 76% and 84%, respectively.
- According to JP Morgan, June closed the month with gross long-term issuance topping $59.5B, marking the highest June on record and surpassing the previous titleholder of June 2025.
- Municipal funds subscriptions continued to show strength and helped absorb the record-setting supply. Monthly inflows topped $6.4B for the month, pushing the YTD inflows to the second highest on record.
Corporate Markets
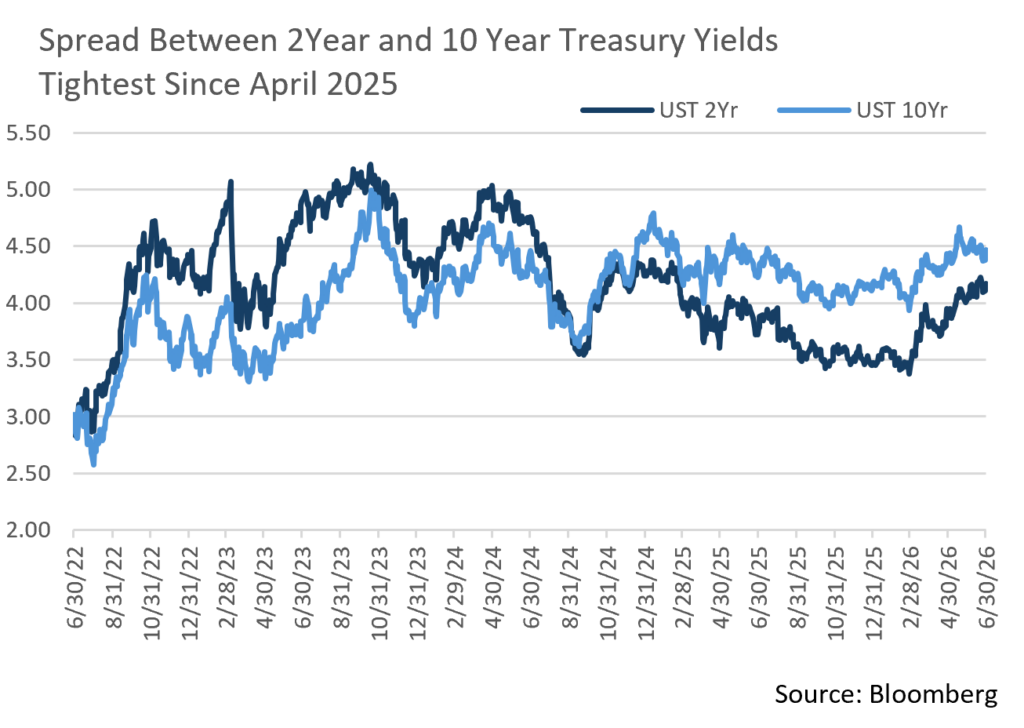
- The UST Curve took on a bear flattening trend over the course of the month, with short rates climbing materially higher. The two-year UST benchmark bond rose 17bps to close the month of June at 4.18%. Coincidentally, the three-year UST bond closed at the same rate. Further out on the maturity spectrum, the ten-year benchmark rate closed at 4.47%, just 3bps higher than where it began the month. The rise in short-term rates has compressed the spread between shorter and longer bonds, with the 2-10 year spread at just 29bps, which is the narrowest it has been since April 2025. The market has priced in the potential for one rate hike by the Federal Reserve by year-end and until that sentiment abates, the bear flattener trend may continue.
- Fund flows reported by Lipper each week continue to be very strong. Over the course of the month, short and intermediate investment-grade bond funds recorded $19.46B of inflows. The prior month had $38.2B of inflows, which was the highest since January, but the demand for investment grade continues to be very strong.
- Issuers continue to take advantage of the appetite for high-quality bonds. June’s $175B of new debt set a new June record, at 60% more than June 2025 issuance and higher than the record setting pace of June 2020. Two tech issuers accounted for a large amount of last month’s issuance, but the sector has accounted for a very large amount of year-to-date issuance to fund projects tied to the AI spending spree. The first half of 2026 has tied the first half of the record-setting yearly volume of 2020. Issuance will continue to persist as long as investors remain eager for bonds.
- The Bloomberg US Corporate Bond Index OAS began the month at 72bps and remained range-bound throughout the month, closing at 74bps. This is slightly lower than the YTD average of 78bps. We continue to feel that breakouts or abnormalities in credit spreads for long periods of time remain unlikely in the near term.
Sources: Bloomberg, Bond Buyer, Barclays, JP Morgan, and Lipper Inc.
Financial Planning Perspectives
Qualified Charitable Distributions
There are several ways to pursue charitable giving objectives and optimize your tax benefit in the process. These include gifting appreciated securities and creating donor-advised funds (DAFs), charitable remainder trusts (CRTs), charitable gift annuities (CGAs), or foundations. Your Appleton Wealth Manager can help you evaluate how best to accomplish your goals in an efficient, tax-advantaged manner. One of the easiest methods involves Qualified Charitable Distributions, or QCDs. Here are some of the principal benefits, as well as common mistakes, associated with QCDs.
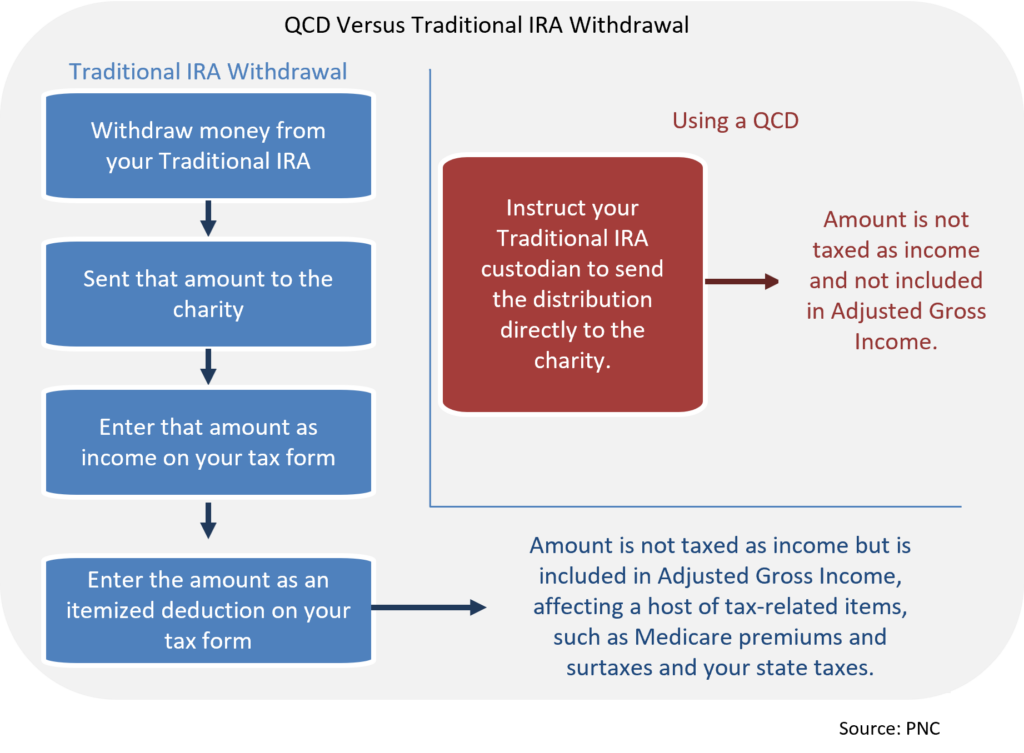
Distributions made from a Traditional IRA or Traditional Inherited IRA are typically taxed as ordinary income. This can become burdensome for those with large Required Minimum Distributions (RMDs). Qualified Charitable Distributions offer the ability to transfer RMDs directly to a qualified charity on a nontaxable basis, provided the following conditions are met.
- You must be age 70½ or older.
- A maximum of $111,000 per year is allowable in 2026 (indexed for inflation going forward).
- The donation must come directly from your IRA to the charity. You cannot withdraw funds from the IRA, deposit them into a checking account, and then make the donation.
- The organization receiving must be an IRS-recognized 501(c)(3) public charity.
- Private grant-making foundations, DAFs, and CGAs do not count as qualified charities.
- You can also use up to $55,000 of QCD to make a once-in-a-lifetime donation to a charitable gift annuity from your IRA.
- You cannot receive anything in return for making the donation, not even a T-shirt or tote bag.
- A donation classified as a QCD cannot also be classified as a charitable deduction on your 1040.
Some common mistakes concerning Qualified Charitable Distributions ought to be noted.
- First dollars out rule
- You cannot take your full RMD and then decide to make a QCD after the fact. If the goal is to offset the income from an RMD, the RMD must be done in conjunction with the QCD.
- Timing of donations made by check
- To qualify for nontaxable status, QCDs must be cashed within the applicable tax year. It does not matter if a check was written during the tax year; it must also be cashed during that tax year.
- Deductible Contributions
- IRA owners may be allowed to make deductible contributions to an IRA, but if you make a deductible contribution the same year as a QCD, your QCD will be taxable, dollar for dollar.
Sources: https://www.schwab.com/learn/story/reducing-rmds-with-qcds, https://www.pnc.com/insights/wealth-management/retirement-and-investment-planning/qualified-charitable-distributions.html
This commentary reflects the opinions of Appleton Partners based on information that we believe to be reliable. It is intended for informational purposes only, and not to suggest any specific performance or results, nor should it be considered investment, financial, tax or other professional advice. It is not an offer or solicitation. Views regarding the economy, securities markets or other specialized areas, like all predictors of future events, cannot be guaranteed to be accurate and may result in economic loss to the investor. While the Adviser believes the outside data sources cited to be credible, it has not independently verified the correctness of any of their inputs or calculations and, therefore, does not warranty the accuracy of any third-party sources or information. Specific securities identified and described may or may not be held in portfolios managed by the Adviser and do not represent all of the securities purchased, sold, or recommended for advisory clients. The reader should not assume that investments in the securities identified and discussed are, were or will be profitable. Any securities identified were selected for illustrative purposes only, as a vehicle for demonstrating investment analysis and decision making. Investment process, strategies, philosophies, allocations, performance composition, target characteristics and other parameters are current as of the date indicated and are subject to change without prior notice. Registration with the SEC should not be construed as an endorsement or an indicator of investment skill, acumen, or experience. Investments in securities are not insured, protected or guaranteed and may result in loss of income and/or principal.