


Insights & Observations
Economic, Public Policy, and Fed Developments
- May was a volatile month for Treasuries, with the 10Yr peaking at 4.68% and the 30Yr hitting its highest level since 2007, at 5.30%, before receding by month-end. Yields soared globally after a Japanese wholesale inflation report came in significantly hotter than expected, +2.3% on the month vs. +0.8%, on surging oil and commodity prices. Japan is the largest foreign holder of U.S. Treasuries, and the prospect of potential higher domestic yields changed the breakeven for holding overseas bonds, pressuring sovereign yields worldwide. America is more removed from the immediate effects of war in Iran than most developed countries, as we are much less dependent on the Strait of Hormuz for oil, but this is a perfect example of how market linkages can “import” overseas risk and occasionally catch participants off guard. Rates subsequently retraced, but the Treasury curve closed May higher as the War continues to pressure yields at home and abroad.
- May could prove an inflection point for inflation data. Two notable developments occurred. First, an April Producer Price Inflation report came in well over consensus, +1.4% vs. +0.5% headline, and +0.6% ex-food, energy, and trade vs. +0.3%. What was especially notable here was less the impact energy costs had on the headline, than the fact energy prices appear to already be flowing into service categories such as transportation and warehousing (where prices rose 5% over the month). This was quite a bit faster than markets had anticipated, and the risk is that producer services prices could begin to fuel consumer core services inflation.
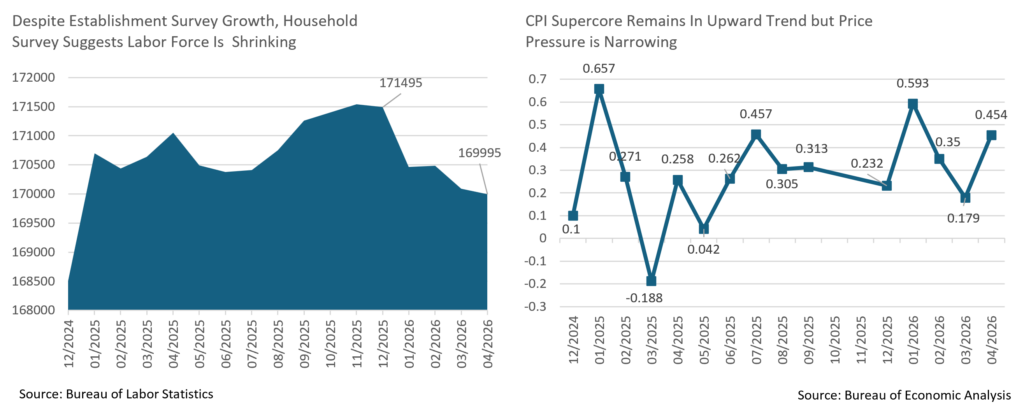
- Of course, there’s no guarantee they will, and that was the interesting thing about April’s CPI inflation report; housing inflation was overstated by the catch-up from the shutdown-impacted October 2025 period, and “supercore” core services ex-housing re-established a long-running upwards trendline… but it also narrowed considerably. Prices were otherwise generally little changed on the month, with most of the increase coming from computer and software, likely due to data center demand. The PCE inflation report later showed a similar pattern. Retail sales are slowing after tax season but both retail sales and personal consumption appear to be growing in real terms. This suggests that retailers are losing pricing power to pass along higher costs and that consumers are still spending but becoming more price sensitive. If so, higher input prices may lead to tighter margins rather than higher consumer inflation, which would be boon for rates.
- After alternating months of job expansion and contraction, we got our second straight labor upside surprise at the start of May, with 115k new jobs nearly doubling market expectations for 65k. The internals of the report were slightly better as well, with growth less concentrated in healthcare than in months past. Average hourly earnings was a little lower than expected, but at +0.2% for the month and +3.6% for the year it has still been above its pre-pandemic average, suggesting demand may not be red-hot, but is far from tepid. One concerning note is that the broader Household survey has been in contraction for several months now; this showed strong growth all last year and was one of the reasons we were more optimistic about labor conditions than most. However, in 2026 it’s given up about half of its gains from 2025. Expectations are for 85k new jobs in May with an unchanged unemployment rate; we would like to see the growth trend in the Household survey reverse as well.
Sources: Bureau of Labor Statistics, Bureau of Economic Analysis, U.S. Census Bureau
Equity News and Notes
A Look At The Markets
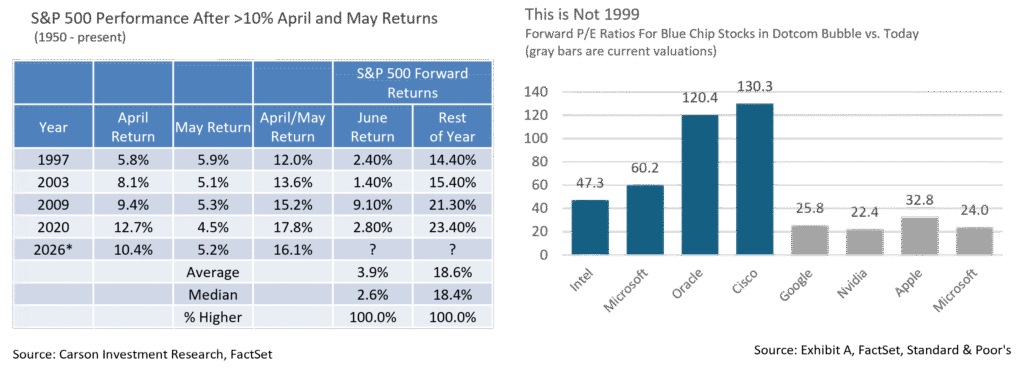
- U.S. equities extended their rally in May with indices finishing at record highs after building on April’s strong gains. The S&P 500 rose +5.2%, alongside solid advances in the Dow (+2.8%) and a stronger move in the Nasdaq (+8.4%), reflecting continued leadership by growth and technology shares. The month was characterized by bullish momentum, as investors repeatedly bought dips and pushed equities to new highs despite intermittent volatility tied to macro and geopolitical developments. The S&P 500 ended May riding a 9-week winning streak, a feat only accomplished 4 other times since 1985, and soared +16.1% in April and May, second only to 2020 for that 2-month span dating back to 1950. The Technology sector was the leading performer (+15.9%), which exceeded the next closest sector, Consumer Discretionary (+2.6%). Energy was the laggard for the second straight month, declining -6.1% as WTI fell -16.9%
- Once again, May brought strong enthusiasm around artificial intelligence, which drove outsized performance in semiconductors (SOX +22.1%), memory (DRAM +60.7%), and select technology platforms. Strong earnings and forward guidance from chipmakers and hardware providers reinforced confidence that the AI investment cycle remains in its early stages. Despite the parabolic price moves, we see questions surrounding eventual monetization, return on investment, power usage, and token costs for end-users. Our investment decisions are carefully considering these factors in the face of strong sector momentum.
- Macro conditions were more mixed, periodically tempering risk appetite. Global bond yields rose across the curve with the Japanese 30Yr breaching 4% for the first time in history, the UK 30Yr hitting a 28-year high, and the US 10Yr peaking at 4.66%, a 16-month high. Though yields stabilized toward month-end, higher yields often prove to be headwinds for equities. First, fixed income securities become more attractive relative to equities given that the total return of a bond is strongly correlated to the yield at purchase (the higher the better). Second, higher yields hurt equity valuations as the present value of an equity security’s future cash flows is reduced as discount rates rise. If we see progress towards a deal with Iran oil prices should decline, easing inflation pressure, a development that would reduce pressure on bond yields.
- With gains heavily concentrated in a narrow group of large-cap and AI-linked names, broader participation lagged with the equal-weighted S&P (RSP +2.7%) trailing the S&P 500 by 2.5% in May. For the 6-week stretch ending May 15th, the S&P 500 beat the RSP by over 8%, the most for any 6-week period in at least 35 years. Given narrow leadership and outperformance from Technology, many are making comparisons to the market melt-up of the late 90’s that led to the Tech Bubble. We would not deny that there are pockets of froth developing but see some major differences between now and 1999.
- In the five years leading up to the Tech Bubble, price was completely detached from fundamentals as earnings grew +67% while the S&P 500’s total return was +220%, signaling a dramatic increase in valuations. By contrast, over the past 5 years earnings have grown 79% vs. an S&P 500 total return of 85%, revealing only a slight multiple expansion. Furthermore, the valuation of the S&P 500 was roughly 24x forward P/E at the dot-com peak, with Tech shares trading closer to 50x. Today, the market is closer to 21x with Tech at a much more nominal premium of 25x.
- Another tell is the behavior of the equal-weighted S&P (RSP) in 1999, which fell -15% as the cap-weighted SPX rallied to new highs. As of the end this May, the RSP reached its own all-time high to complement the S&P 500’s fresh record. We intend to use market strength to rebalance portfolios and reinvest in what we see as superior risk-adjusted opportunities, but do not currently see a valid comparison to 1999.
Sources: Bloomberg, FactSet
From the Trading Desk
Municipal Markets
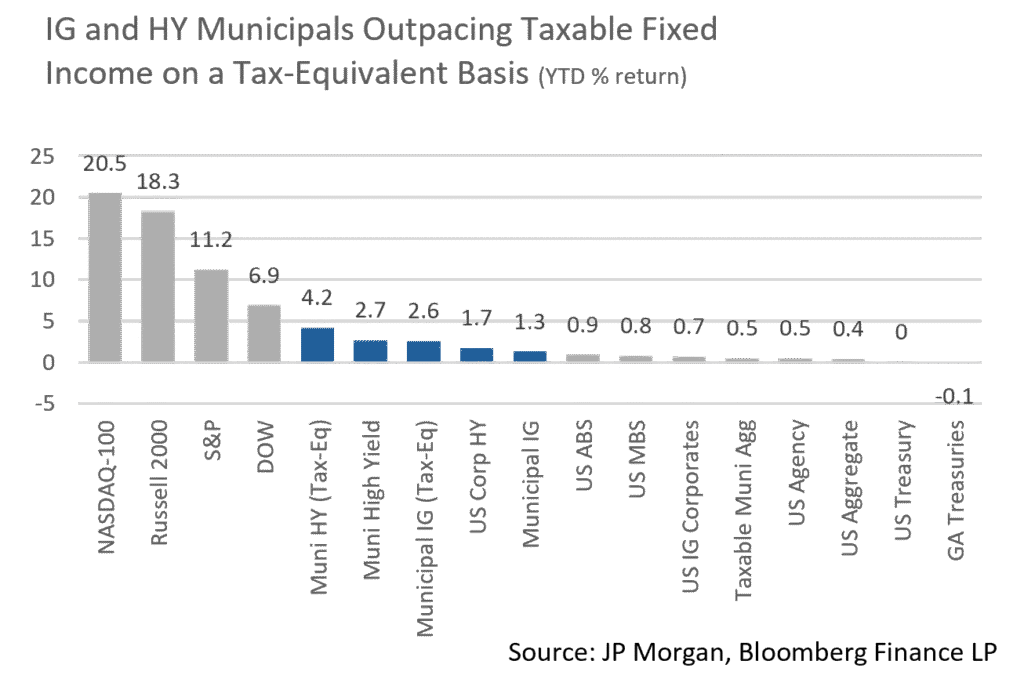
- Despite volatility driven by geopolitical headlines, investors continued to view the municipal market favorably. Capital was aggressively committed despite at times diverging yield trajectories intra-month.
- Municipal yields offered a mixed picture as the front end rallied, while the belly of the curve moved slightly higher and the longer end settled lower, creating a serpentine effect on the curve move. The 1-year AAA maturity saw the most meaningful yield move of 14bps, while maturities in the 3 to 15-year range saw yields flat to slightly up (2 – 4bps), 20 and 25-year maturities registered yields declines of 3bps, while the 30-year maturity rose in yield by 1bp.
- From a ratio perspective, the zig-zag curve move pressured ratios in the front end of the curve but less so out further. On a net basis for the month ratios exhibited a tapering tightening effect. The 2 and 3-year maturities richened by 2.5-3.35%, while 5 and 7-year ratios tightened by 1.35% and 0.70%, respectively. Further out, 10 and 20-year ratio changes were more muted with levels tighter by only 0.5% to 0.85%, and the long end ratio was very marginally cheaper by 0.04%. The month closed with 3-yr ratios of 61%, 5-yrs at 63%, while the 10-year maturity settled at 67%. On the long end of the curve, the 25- and 30-yr spots closed at 79% and 87%, respectively.
- According to JP Morgan, May saw gross long-term issuance topping $50.4 billion, marking the 7th highest month on record and the largest May. In the face of strong issuance, municipal fund demand remained robust and helped push valuations higher. Barclays estimates that May fund subscriptions totaled $7 billion with a focus on ETFs and long-term/national funds, bringing the YTD fund intake to $40 billion.
- While waiting for summer technicals to emerge, the market is poised to contend with sustained heavy issuance in June with estimates of +$10 billion net positive supply. This could prove an opportune moment to put capital to work while yields continue to be attractive and supply plentiful.
Corporate Markets
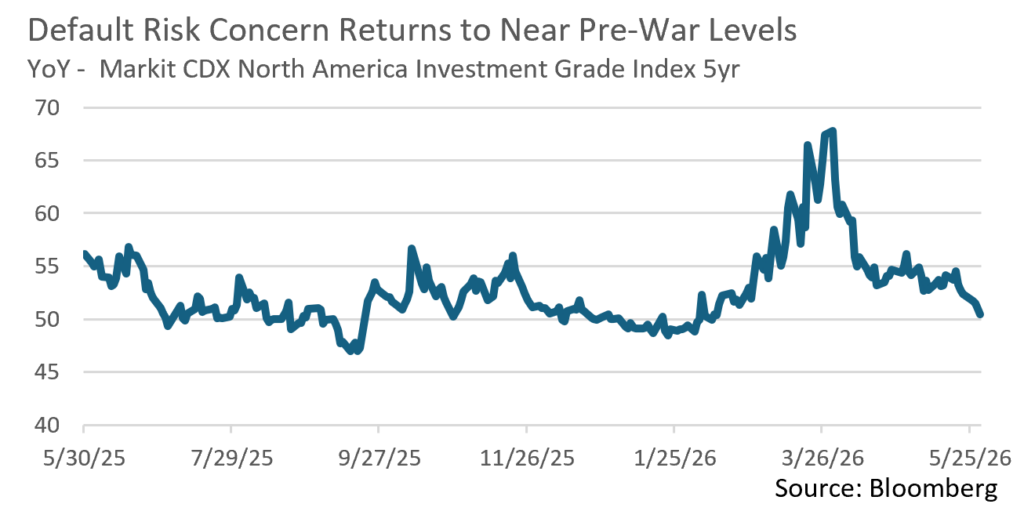
- Credit concerns in the Investment Grade space began to rise after the US/Iran conflict began in late February. This followed a rather benign period since the “Liberation Day” blip back in the spring of 2025. This sentiment is generally tracked via the CDX IG index which implies a “cost” of insuring against the probability of defaults across a wide range of investment grade companies. Prior to the start of the conflict, the CDX IG index was close to 50bps but climbed to a YTD high 68bps in late March. This was followed by a sharp decline in April and a further drop back towards pre-war levels of 50bps by month-end. Risk appetite has rebounded and investor demand for bonds remains robust.
- The overall tone of Investment Grade credit was on solid footing in May. In fact, IG credit spreads have been on a tightening trajectory since the beginning of April. It took 53 days for credit spreads to rise from the YTD low of 71 OAS on the Bloomberg US IG Index to the YTD high of 93 OAS on March 16th. While we haven’t retraced the full extent of the Q1 widening, it took 74 days to get back down to an OAS of 72bps. A large part of that move came in May as war tensions eased a bit and economic growth largely held up. We expect to see a stabilization of credit spreads in this range despite historically low spreads, especially if investor risk sentiment remains favorable.
- According to Lipper, May started off with a massive $6.88 billion flowing into Short and Intermediate Investment Grade funds. Positive flows brought the full month’s total to $17.63 billion, helping to fuel spread compression and soaking up some of the $163.9 billion of new issuance. While May issuance was just shy of expectations, it was still a very busy month for the syndicate. Compressed spreads and low concessions have made it a very opportunistic time for issuers to come to market. We anticipate that the new issuance engine will continue to run at a rapid pace with June expected to bring $130 billion, and the $1.85 trillion expected in 2026 is well within reach.
Sources: Bloomberg, Bond Buyer, Barclays, JP Morgan, and Lipper Inc.
Financial Planning Perspectives
The Semi-Liquid Alternatives Space Faces A Stress Test
The last few years have seen an unprecedented “democratization” of private markets. Wealth management firms and alternative asset managers have aggressively expanded their product suites to offer high-net-worth investors access to private equity, real estate, and credit through “evergreen” or “semi-liquid” fund structures. Today, this asset class represents nearly $300 billion of managed assets across over 300 funds. Pitched as a bridge between the high returns of traditional institutional private markets and the convenience of liquid investments, the growth of these vehicles has taken off with 67 fund launches in 2025 alone.
However, this explosive growth has assumed that periodic liquidity, such as quarterly redemption windows, can be comfortably offered alongside inherently illiquid underlying assets. While these structures are technically sound under normal market conditions, they are now encountering a significant stress test.
Beginning in late 2025 and proliferating in Q1’26, a sizeable number of investors began seeking exits from various semi-liquid private credit vehicles. It appears concerns around AI and the heavy exposure to software businesses within private credit portfolios may have been a primary catalyst, as well as the reflexivity of publicly traded lenders trading at meaningful discounts to their asset values. Many of the major private credit managers have been forced to enforce redemption caps (typically 5% of fund shares per quarter) as redemption requests have increased substantially recently.

To date, redemption pressure has not led to full blown panic, but it does open the door for skepticism. Are the credit concerns of semi-liquid investors valid? Will the need for semi-liquid funds to generate liquidity lead to asset value mark-downs? One encouraging data point to consider is the liquidity crunch that Blackstone’s BREIT, one of the largest semi-liquid real estate funds, encountered in late 2022. As interest policy began to become more hawkish, BREIT experienced a surge in redemption requests that exceeded its structural limits. By standing firm on redemption caps, selectively selling assets, and bringing in a strategic investor ($4.5 billion investment from the University of California’s endowment) BREIT management was able to stabilize the fund which recently recorded its first net inflows since 2022.
At Appleton Wealth Management, we believe clients deserve a clear-eyed view of what they own and how it is likely to behave under stress. Our investment team is committed to offering clients access to private market investments, and we will continue evaluating options that allow us to do so prudently.
Sources: https://xainvestments.com/knowledge-bank/insights/?url=commentary-20260519, https://caia.org/blog/2026/04/20/private-credit-redemptions-defaults-and-wrappers-oh-my
This commentary reflects the opinions of Appleton Partners based on information that we believe to be reliable. It is intended for informational purposes only, and not to suggest any specific performance or results, nor should it be considered investment, financial, tax or other professional advice. It is not an offer or solicitation. Views regarding the economy, securities markets or other specialized areas, like all predictors of future events, cannot be guaranteed to be accurate and may result in economic loss to the investor. While the Adviser believes the outside data sources cited to be credible, it has not independently verified the correctness of any of their inputs or calculations and, therefore, does not warranty the accuracy of any third-party sources or information. Specific securities identified and described may or may not be held in portfolios managed by the Adviser and do not represent all of the securities purchased, sold, or recommended for advisory clients. The reader should not assume that investments in the securities identified and discussed are, were or will be profitable. Any securities identified were selected for illustrative purposes only, as a vehicle for demonstrating investment analysis and decision making. Investment process, strategies, philosophies, allocations, performance composition, target characteristics and other parameters are current as of the date indicated and are subject to change without prior notice. Registration with the SEC should not be construed as an endorsement or an indicator of investment skill, acumen, or experience. Investments in securities are not insured, protected or guaranteed and may result in loss of income and/or principal.