Insights and Observations
Economic, Public Policy, and Fed Developments
- The economic highlight of December was the Federal Reserve bowing to market expectations by updating their “dot plot” to show three rate hikes in 2022, up from an even split at the prior meeting between no hikes and one. In some ways this was unsurprising; in the post-Great Recession era, disagreements between market expectations and the Fed dot plot have been resolved in favor of the market.
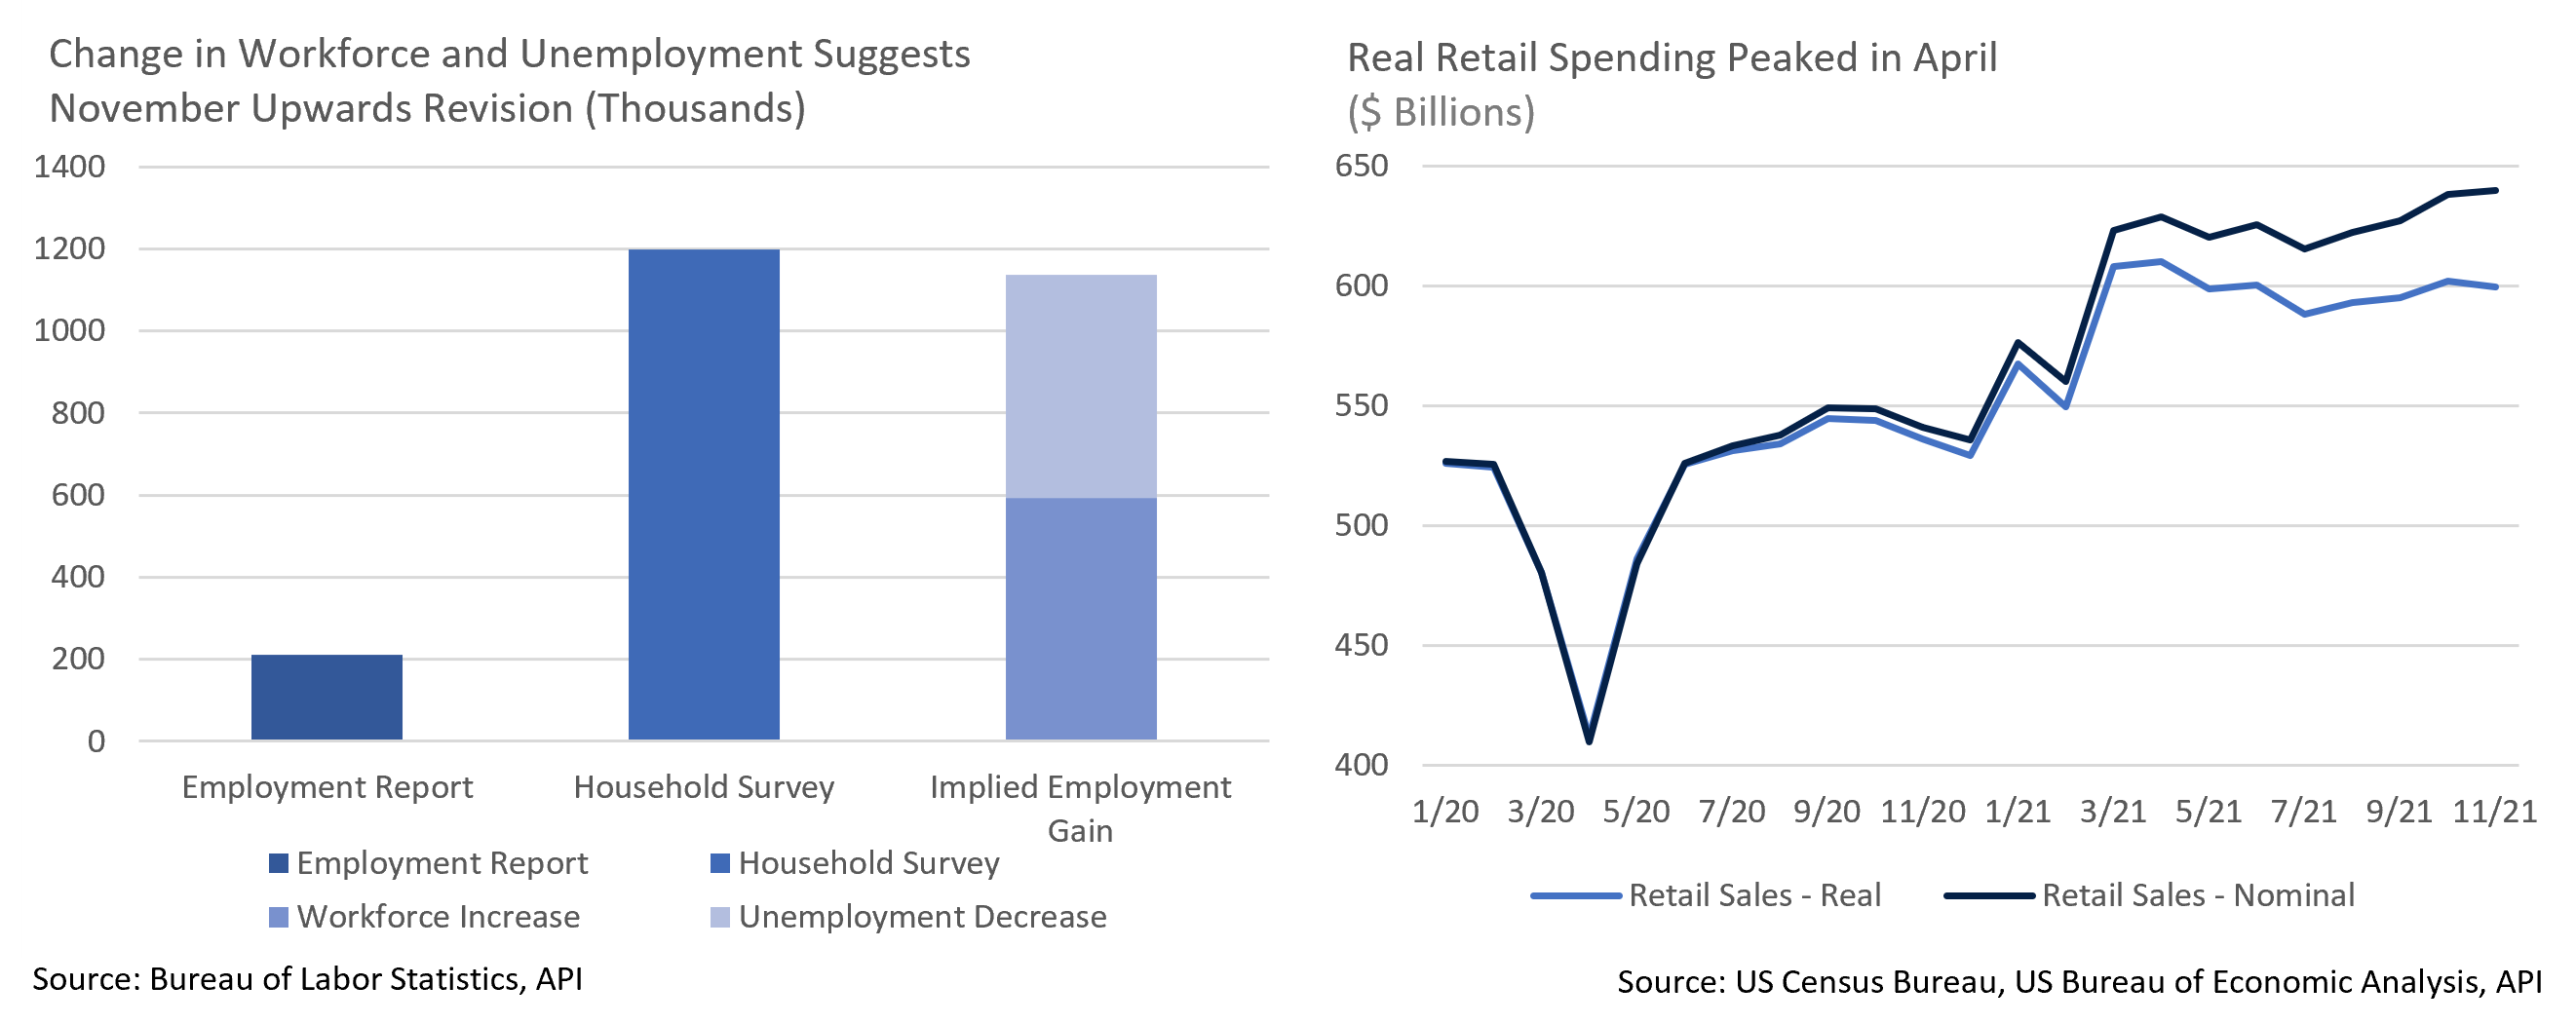
- However, market expectations are still evolving. A particular source of uncertainty lies with the labor market. November’s BLS report of only 210k new jobs has been taken as evidence of a tight labor market. The unofficial “household survey” flagged much higher job growth of 1.2M, whereas the BLS report included a 594k increase in the workforce (those currently employed or unemployed but actively looking) and a 542k decrease in the unemployed (no job but actively looking). This report aligns more with the “household survey” than the “headline” BLS numbers. A sizable upwards revision to November’s report and a strong December jobs number could shake the consensus view that tight labor conditions will drive inflation via wage increase, a dynamic we have yet to see materialize.
- There is encouraging evidence of easing supply bottlenecks as auto production has begun to recover. The Motor Vehicles and Parts industrial production index rose from 85.1 in September to 95.7 in November, the highest reading since January and first back-to-back increase of the year. This suggests chip shortages that have plagued production are starting to abate. Meanwhile, while the headline December ISM Manufacturing report missed, the details were better, with employment indices improving, and prices paid and delivery time indices hitting near term lows, though the survey period was largely pre-omicron wave.
- While retail spending has been strong, in inflation-adjusted terms it has been flat to slightly negative for some time. A further upward revision to October’s already strong reading from 1.7% to 1.8%, and personal spending outstripping personal income by 0.2% in November’s report, offers additional evidence of an unusually front-loaded holiday shopping season. These give us reason to believe strong spending should moderate in coming months, potentially helping to take the edge off inflation readings.
- For now, inflation remains high – both CPI and PPI surprised to the upside in November’s release. It is likely too early to estimate how the latest variant wave will impact future inflation readings, but for now we will be paying close attention to whether the annualized month-over-month trendlines show deceleration or remain elevated, and how core inflation components not highly sensitive to the pandemic, such as shelter costs, are behaving in assessing the 2022 inflation outlook.
- Omicron remains a significant source of short-term uncertainty. The variant is far more contagious than previous iterations, with the US setting a new daily record of more than a million new cases on the 4th. While it appears to be less severe, this is not yet entirely clear. Hospitalizations have not risen as aggressively, though they typically lag new cases and with widespread vaccination and prior infections, breakthrough infections are a much larger proportion of current cases than in waves past and tend to be milder. In any event, we certainly hope the human impact remains low.

Equity News and Notes
A Look at the Markets
- Decembers are typically calm for the stock market, but this past month turned out to be the year’s most volatile as only one trading day produced less than a +/- 0.5% move prior to Christmas. Despite this volatility, the S&P rallied 4.5% for the month, capping off a +11% quarter. The index is now on a 7-quarter winning streak, an accomplishment only matched 6 other times since WWII.
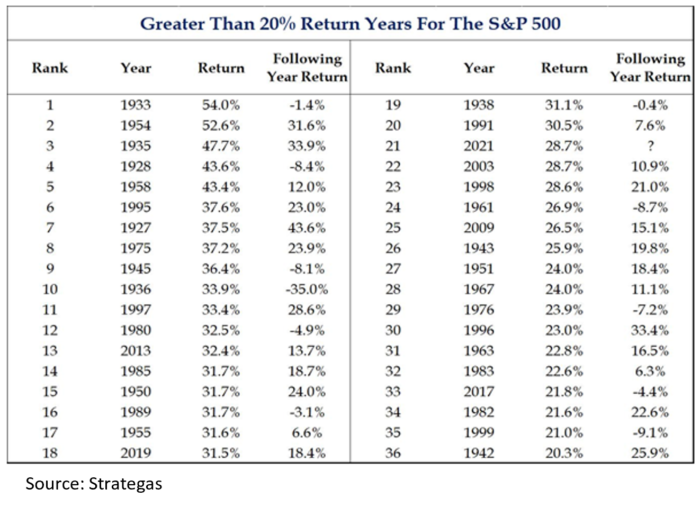
- The S&P 500 finished the year with a robust total return of +27.8%. How have equities historically fared after producing +20% years? Quite well, as the S&P 500 has returned +11.3% on average in such situations, with nearly 70% positive years. Reversion to the mean is a powerful investment maxim, yet history tells us momentum tends to be on the bulls’ side.
- Dip buying in 2021 proved challenging as declines were few, shallow, and short in duration. The S&P 500 experienced a maximum drawdown of -5.2%, the fourth shallowest pullback since 1980. In addition, the index was positive an above average 57% of all trading days.
- Equity market skeptics have pointed to narrow breadth and the perceived outsized influence of large, mega cap tech names. However, the equal-weighted S&P 500 finished the year with a return of +29.4%, in-line with its market-cap weighted counterpart. Remarkably, all 11 sectors finished the year with double digit returns, a first in the index’s history.
- Along with hopes that the recent omicron wave eases, several other factors could drive stock prices higher in 2022. Global central banks remain historically accommodative in absolute terms and financial conditions, including credit spreads, remain easy. Real interest rates are decisively negative which should give the “TINA” trade legs. Global equity fund inflows of over $1 trillion in 2021 should cool off but stay firmly positive in the coming year. Corporate profits are expected to grow 8-9% in 2022 as consumer demand remains robust and profit margins remain elevated. With corporate balance sheets fortified with cash, we expect to see above average buybacks, dividend increases, M&A activity, and capital expenditures. Evidence also suggests that supply chain constraints may have peaked which should begin to alleviate some inflation pressures.
- As always, there are also meaningful risks heading into the new year. The economy will have to deal with reduced monetary and fiscal policy support. Persistent inflation pressures, sustained COVID headwinds, and elevated valuations are all concerns, along with a more hawkish Fed.
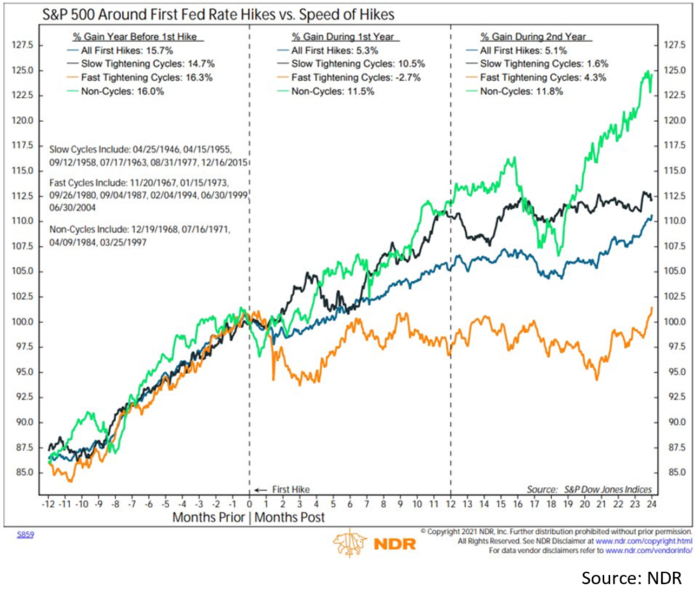
- The Fed has signaled that tapering of asset purchases will likely end in the Spring. Key questions will be how they begin shrinking a nearly $9 trillion balance sheet and when rate liftoff begins. The Fed dots point to 3 hikes in 2022, 3 more in ‘23, and 2 more in ’24, and while forecasting must be taken with a grain of salt, market expectations have aligned for the most part. Fed futures trading suggests rate hikes in March, June, and December. Of importance, the markets appear to have priced in these moves when viewed through the yield curve and an ongoing correction in higher valuation, rate sensitive stocks. But as the chart below shows, Fed hiking cycles do not have to mean the end for equity bull markets. In our view the overriding risk comes from a potential disconnect between the Fed and financial markets. If we were to get more than 3 hikes (not our base case) or a potentially faster hiking cycle, we could see turbulence.
From the Trading Desk
Municipal Markets
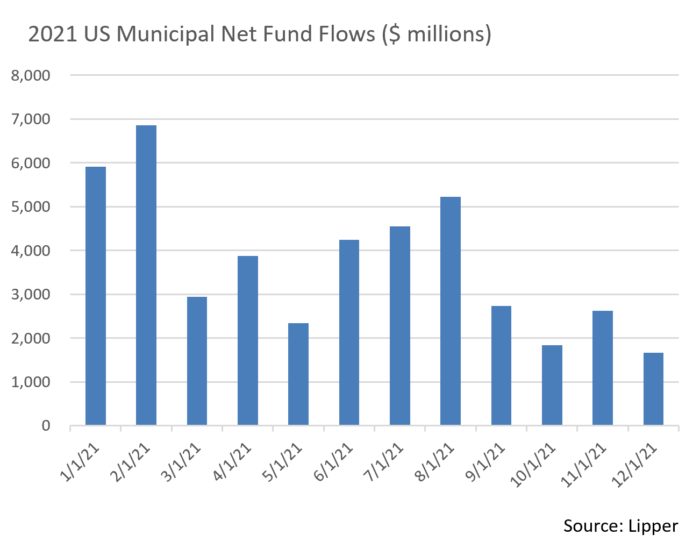
- Over the course of 2021 retail demand for municipals did not relent as evidenced by mutual fund inflows of $101.8 billion. By comparison, total inflows for 2020, a year disrupted by initial pandemic volatility, was about $40 billion. Looking back to 2019, we experienced total inflows of about $94 billion. This year’s relentless demand has been highly supportive of the tax-exempt asset class, constraining municipal yields even in the face of recent UST weakness.
- On the supply side, December issuance was $38.2 billion according to The Bond Buyer, a level above the $34.8 billion brought to market during the same month of 2020. On an annual basis, issuers brought $475 billion of new supply for 2021, slightly below last year’s record issuance of $484 billion. Bond supply remains tight in both the primary and secondary markets.
- The year closed with 10-year AAA muni/UST ratios at just over 68%, roughly in line with the 52-week average, but below longer-term norms. The significant demand noted above is the primary cause of the lower ratio data this year. As emphasized for some time, we see greater relative value in the intermediate portions of the curve with the spread between 2-10s at 0.79% vs. only 0.46% between 10-30s. While the market is currently pricing in 3 Fed rate hikes this year, the short end of the muni curve is remaining stubbornly low.
Corporate Bond Markets
- The last month of 2021 was a roller coaster ride for investment grade credit spreads with buyers reluctant to take on additional credit risk as the year concluded. Market skittishness was influenced by growing anticipation of Federal Reserve policy guidance as the December meeting approached. All ended well though, as the market grew more comfortable with the Fed’s tapering plans and rate expectations and investment grade credit caught a bid with spreads ending the month 8 bps tighter.
- If we widen the lens further, the Bloomberg Barclays IG Corporate Bond Index began 2021 at an OAS of 96 and closed just 4bps tighter at 92 OAS despite trading in a narrower 10 – 15bps range for most of the year. We anticipate slight spread widening in 2022 that is likely to be orderly and range bound.
- Issuers took full advantage of benign market conditions in 2021 with investment grade supply of $1.41 trillion the second largest year on record, trailing only 2020’s mammoth $1.75 trillion. An unexpected rush of new supply during the first two weeks of the month led to a record $61 billion in December issuance, unusual for a typically sluggish month. Primary issuance market conditions continue to be favorable and the appetite for investment grade credit should carry over into 2022. The market has embraced new supply and we expect to see a similar size calendar this year.
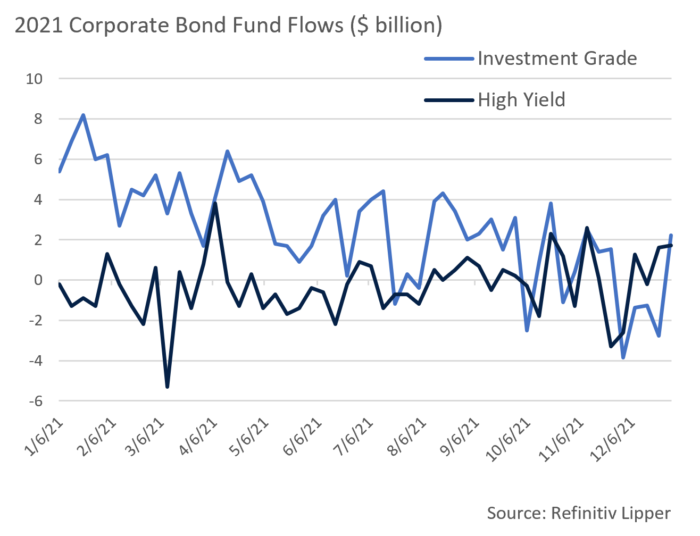
- Retail investor sentiment, as measured by investment grade corporate fund flows was mixed to close out the year. In the four weeks preceding the last week in December, funds incurred just over $9 billion of net outflows. This was presumably spurred by the uncertainty around the omicron variant and future Fed policy, which drove modest spread volatility in the first few weeks of the month. This weakness marked the largest stretch of outflows of the year. However, the trend may be short lived as the last week of the month saw $2.22 billion of inflows. Over the course of the year, 44 positive flow weeks far outnumbered the 8 negative ones. The ebb and flow of retail bond funds can be volatile but overall investor appetite for investment grade credit remains solid and should remain that way as we move further into 2022.
Financial Planning Perspectives
Tax Planning & Retirement Account Benefits
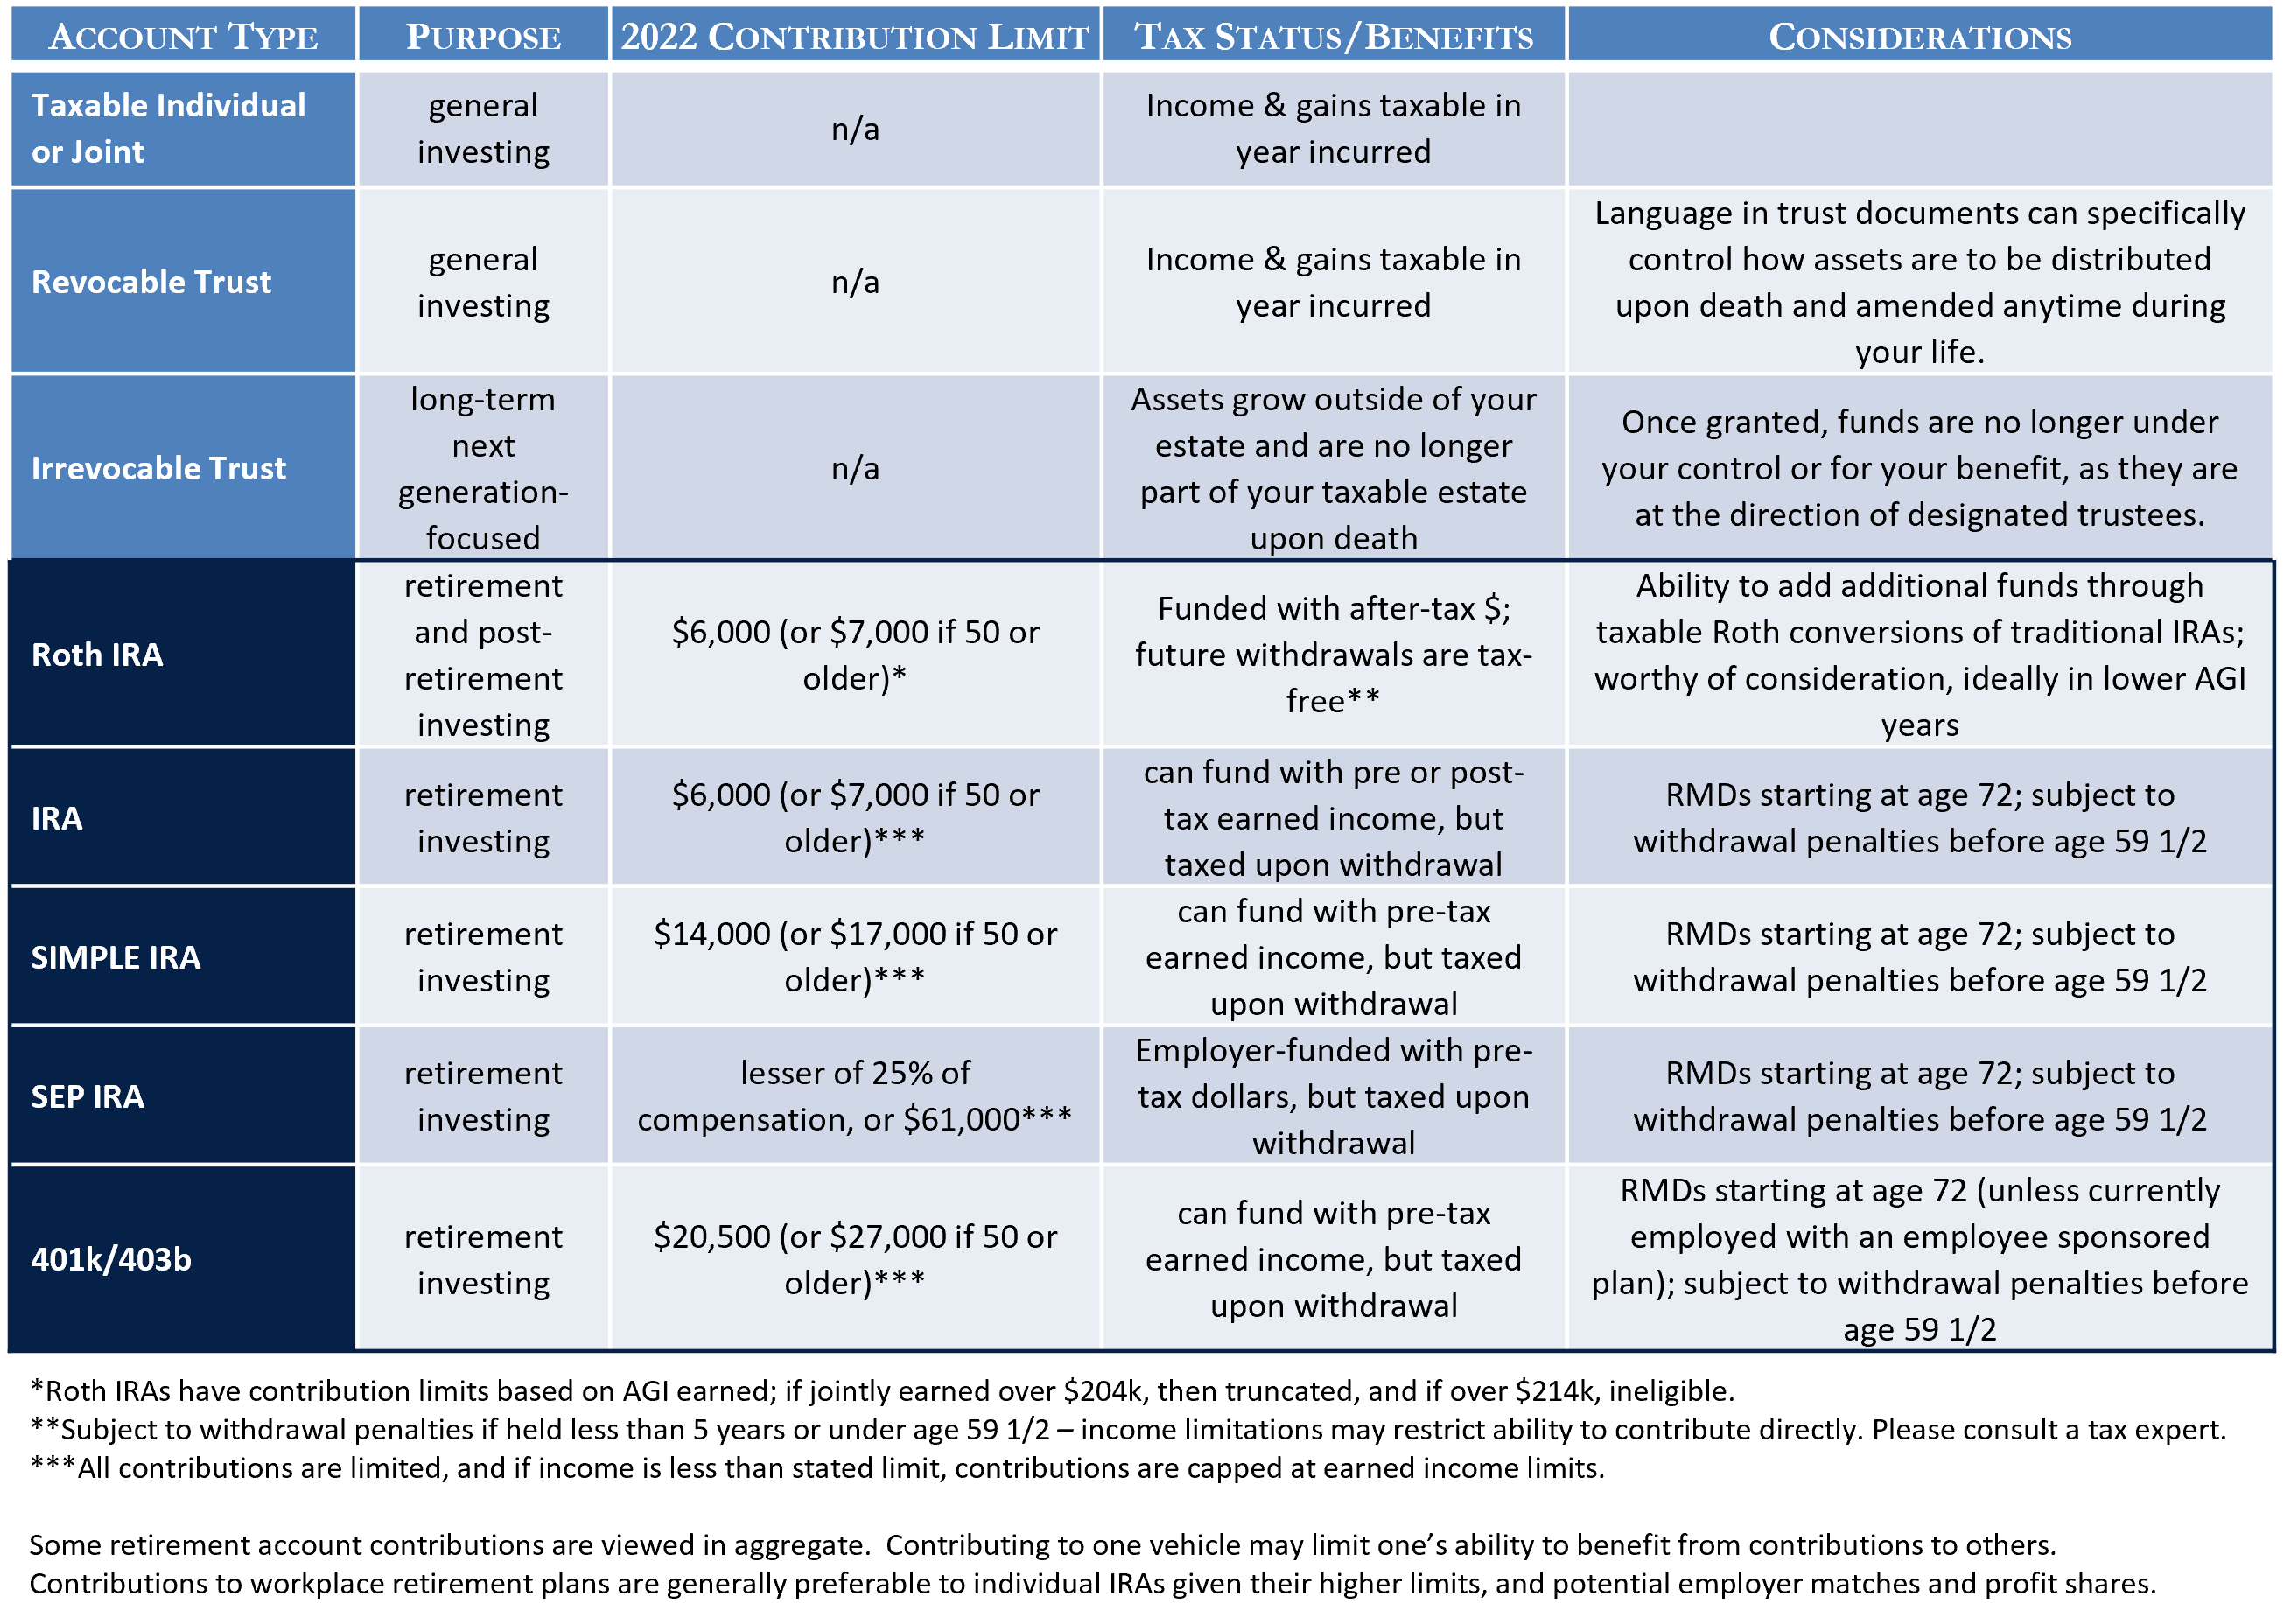
While the Build Back Better bill appears to be stalled if not on ice, and tax laws have not materialized to the extent anticipated, a few 2022 limitation changes are noteworthy. It is never too early or too late to begin investing in a retirement account, although the tax and related advantages of doing so may not be optimized without a full understanding of one’s options. A baseline explanation follows, and we also invite you to speak to your portfolio manager or a tax professional when considering what vehicles are right for you.
Charitable Giving
- When paired with the appropriate estate planning and retirement planning strategies, charitable and personal giving can also create valuable tax benefits.
- A reminder that one can make qualified charitable contributions of their required minimum distributions to 501c3 charities.
- Consider establishing a donor advised fund to front load planned charitable giving to potentially garner a significant taxable income offset.
- Federal gift tax exemption thresholds for annual giving have increased to $16,000 per individual to any other individual in 2022.
For questions concerning our financial planning or wealth management services, please contact
Jim O’Neil, Managing Director, 617-338-0700 x775, [email protected]


