


Insights & Observations
Economic, Public Policy, and Fed Developments
- In some ways the April PCE inflation report, released in late May, was the inverse of February’s; it met the consensus +0.2% mark, but by the barest possible margin. The reported +0.249% was only 0.001% shy of an upside surprise. Still, it technically met expectations, and under the surface, categories continued to trend in the right direction. Services inflation continues to slow and has fallen back to roughly the (encouraging) rate of the second half of last year before the early 2024 blip. If the market was wrong about February, then a positive response to April feels like a restoration of balance.
- This follows earlier improvement in CPI inflation, where headline and core at +0.3% beat by a tenth and were in line, respectively. Improvement was driven by the further slowdown in shelter costs we have been looking for, as well as a drop in the Fed’s preferred services ex-housing “supercore” (which is still too hot but after spiking in the start of the year is now in a downtrend). Core inflation’s annual +3.6% increase now represents the lowest in 3 years.
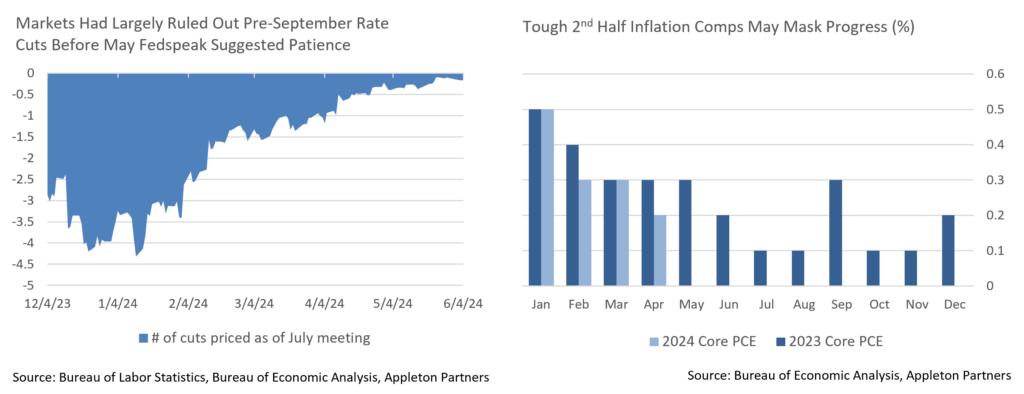
- That said, progress may be slower from here. The second half of 2023 was a period of benign inflation driven by falling energy prices and supply chain normalization. With low readings dropping out of the trailing year over the summer and fall, improvement will be slow (which the Fed expects; the last “dot plot” foresaw +2.6% core PCE inflation at year-end, only slightly below the current +2.8%). For the remainder of the year, annual rates may be less useful in measuring changes in inflation than 3-month annualized rates as they better compensate for base effects.
- There was an interesting dynamic between weaker than expected retail sales and personal spending, and higher than expected consumer confidence, in April as well. While markets were quick to hypothesize slowing growth, there is a possible alternative explanation. March spending was abnormally strong, boosted by an extremely early Easter holiday and a large Amazon spring sale. Some pullback in spending makes sense; we suggest waiting for May data due out in June before passing judgement.
- Still, a large amount of economic data published in May does suggest a decelerating economy. Notably, the Fed’s “Beige Book” survey reports “slight to moderate” growth in most districts, with Boston and San Francisco reporting flat growth, while the ISM Manufacturing data released on 6/1 showed an unexpected contraction. A larger than anticipated drop in the prices paid component did cause a Treasury rally, however. We’d reiterate slowing is generally good – stripping out net trade and inventory components, strong Q1 growth (that the second revisions tempered only slightly) represents three straight quarters of above trendline demand, and for the Fed to achieve their targeted “soft landing,” growth will likely have to slow slightly from its currently elevated rate.
- Fed speakers garnered a lot of attention in mid-May during an otherwise quiet macro period. Several speakers suggested they would want several more good inflation releases before cutting the Fed Funds Rate, and Neel Kashkari, one of the most dovish members of the FOMC, mentioned at month-end that the Fed hadn’t “entirely ruled out” a rate hike. Context matters here. The market hasn’t priced in more than a 50% chance of a hike before September (by when we’ll have had three more CPI and two more PCE reports) in nearly two months, and Kashkari’s comments are literally true of a data dependent Fed and were probably given more weight by the market than intended.
Equity News and Notes
A Look At The Markets
- Stocks rebounded in May with the S&P 500 and Nasdaq enjoying 5-week winning streaks before declining over the final week. The S&P 500 gained 4.8%, its strongest May performance since way back in 2009, raising YTD total return to +11.3%. The Nasdaq rose 6.9% while the DJIA returned a more modest +2.3%. The Energy sector was the sole decliner, falling 1% as WTI crude closed back below $80/barrel, down 6% on the month. Technology led, advancing nearly 10% on sustained strength from the mega caps.
- Market breadth narrowed once again as just 4 stocks (NVDA, AAPL, MSFT, and GOOG) accounted for more than half of the S&P 500’s gain. The equally weighted S&P 500 trailed its market-cap weighted counterpart by 2.3%, the widest monthly gap since January. Notably, weakness in breadth came amidst a decline in interest rates, a curious wrinkle in the relationship as stock participation has generally risen when rates drop. This is likely a reflection of a market that is currently highly reliant on a narrow group of mega cap names.
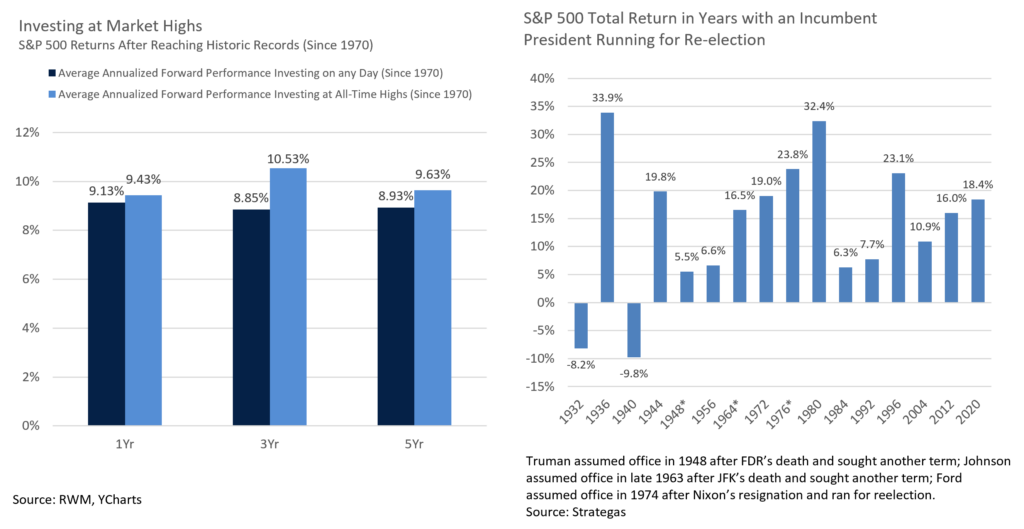
- May’s rebound enabled the S&P 500 to recoup all of April’s losses and set a fresh high on 5/21. With the index at all-time highs, many are hesitant to invest given valuation concerns, or are hoping for a pullback. However, data spanning the past 50 years suggests that all-time highs often reflect positive market momentum that can lead to strong forward returns.
- A rallying stock market has also introduced a collapse in volatility. On the same day as the S&P 500 reached its all-time high, the VIX, often referred to as Wall Street’s fear gauge, closed at 11.9. This is the index’s lowest close since November 2019 and compares to an average reading since 1990 of 19.5. And it’s not just stocks evidencing complacency. The MOVE index, which tracks Treasury market volatility, recently closed at its lowest level since early 2022 when rates began to rise in earnest. Credit spreads also remain tight, yet another indication of placid market conditions, an environment that warrants attention to quality and risk management in portfolio construction.
- With the election only 5 months away, many investors are focusing on the potential for increased stock market volatility. Election years tend to be more volatile during Q2 and Q3, although in elections with an incumbent running for reelection, history favors staying invested. Since 1944, the S&P 500 has posted an average return of nearly +16% in years with that scenario in place and has never been negative. This likely speaks to the incumbent’s administration pulling out all stops to support the economy and increase the likelihood of reelection. We cannot predict the market’s path over the remainder of the year but believe the current administration will follow historical precedent.
From the Trading Desk
Municipal Markets
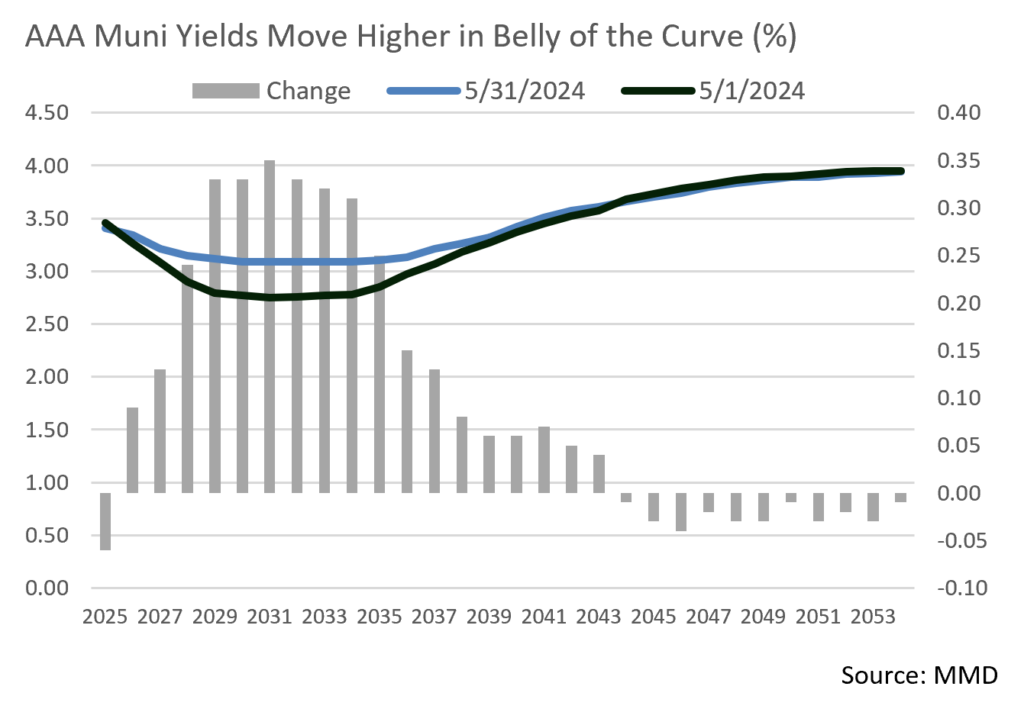
- Municipal yields moved higher over the month with the largest increases in the 5-to-11-year portion of the curve. Yields in the belly of the curve increased by over 30bps, a step towards normalization of what has been an atypical, prolonged inversion. Upward yield pressure largely reflects a surge in new supply and, according to Bloomberg, May’s issuance of $48.9B exceeds the same month of 2023 by 57%. Furthermore, with less than half of 2024 in the books, tax-exempt issuance has already reached 51% of 2023’s full year total.
- May’s yield movement and municipal underperformance vs. USTs drove the AAA 10-year Muni/UST ratio to a more attractive 69.1% at month’s end, the highest it has been since last November. Shorter maturity ratios also showed improved relative value with 2-year and 5-year ratios reaching 68.8% and 69.6%.
- Investor demand has been robust in the high-quality new issuance market due to attractive nominal and tax-equivalent yields, and many offerings have been significantly oversubscribed. On that note, JP Morgan recently released analysis of new issue pricing relative to secondary market yield levels and the results are compelling. Their analysis focused on 5% coupons, AA-rated, non-AMT, 10-year and 30-year bonds over the past 3.5 years. The study found that in the 10-year portion of the curve there has been a consistent incremental spread pick-up of about 13bps when buying new issues relative to similar bonds bought through secondary market trading. At Appleton, we are active in the intermediate parts of the curve and emphasize buying in the primary market due to what is often more attractive relative value, a trading focus supported by JP Morgan’s research.
Corporate and Treasury Markets
- Investment Grade Credit returns were largely positive in May. The Bloomberg US Corporate Bond Index return of +1.87% marked the best monthly return since 2023’s year-end rally and raised YTD total return to -0.54%. The longer portion of the index fared better (+2.82%) than intermediate maturities (+1.41%), although intermediate duration total return moved back into positive territory (+31 bps) on the year. Long duration remains in the red although the YTD index total return narrowed to -3.90%.
- On a sector basis, Utilities were an outperformer relative to Industrials and Financials as yields receded marginally. Lower quality bond returns were strong in May as credit appetite and a quest for yield remained intact. This dynamic enabled investors with credit exposure to realize positive excess returns.
- Investment Grade credit spreads have been confined to a very narrow range for some time as the QTD wide of 93 bps in mid-April only modestly exceeds a month-end low of 85 bps. Over the course of the year, 20bps of Investment Grade spread compression has produced +1.34% of excess returns, alpha generation from credit we haven’t seen in quite some time as USTs have been the predominant driver of both positive and negative returns.
- High Yield demand remains intact as well despite a slowing economy with spreads moving steadily downward on the month to 308bps on the Bloomberg US Corporate High Yield Bond Index. Credit spread stability appears to be firm and we do not anticipate a significant change over the near term.
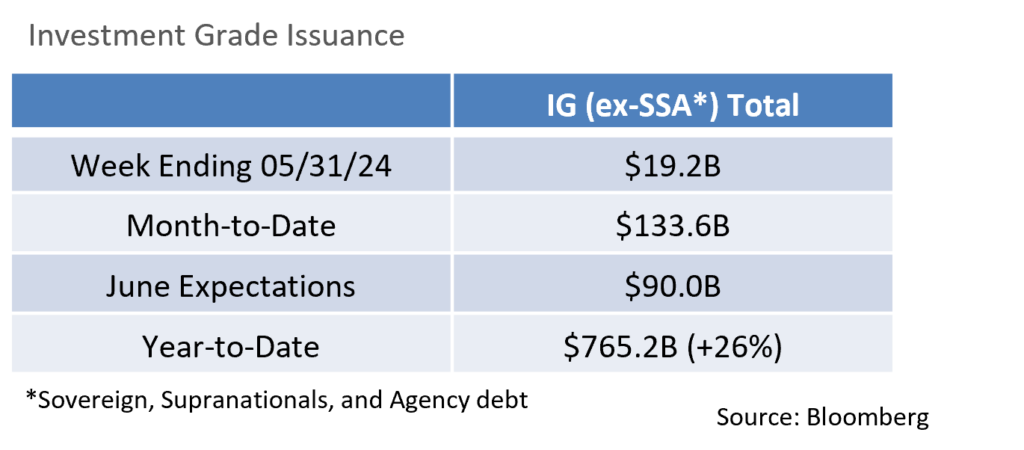
- The Investment Grade primary market began May with projections of $125B of new debt coming to market and those expectations were exceeded with $133.6B ultimately issued. New deals had no problem finding buyers despite some market volatility, and concessions and order books were healthy. Bond redemptions were estimated at close to $100B, which translates into monthly net supply of roughly $33B, a figure investors had no trouble embracing. Supply levels, which are up 26% YoY, are expected to dwindle in the coming months as the seasonality of the summer and the election come into focus, a dynamic that should further support relatively tight credit spreads.
Financial Planning Perspectives
Wealth Transfer to Women
We highlighted Women’s History Month in March 2023 by focusing on an enormous wealth transfer expected to take place over the next decade that is likely to have significant implications for women, a demographic that often introduces distinctly different needs than male investors. This April’s financial planning brief returned to the subject of inheritance and why financial planning will become increasingly important as assets move from one generation to another.
Revisiting what we called attention to last year, “by 2030, American women are expected to control much of the $30 trillion in financial assets that baby boomers will possess—a potential wealth transfer of such magnitude that it approaches the annual GDP of the United States.”1 The accompanying chart from the Great Wealth Transfer Survey produced by Ellevest breaks out each generation and how women of different age groupings are likely to handle a “financial windfall,” whether acquired through an inheritance, the sale of a business or home, or other development.

Source: https://www.ellevest.com/magazine/category/great-wealth-transfer-survey
Investing such funds is clearly a priority across age groups with other elements of personal financial management also drawing attention. One can readily see commonalities across generations, arguably led by the need for wealth planning and financial advice.
As we’ve long advocated, a significant change in financial circumstances often increases the importance of developing a personal financial plan. Furthermore, women tend to live longer than men, and thus have a different time horizon and distinct financial concerns such as greater healthcare costs, not having enough assets to last throughout retirement, or loss of a spouse.2
Against this backdrop, advisory gaps are evident. A recent study illustrated this reality as “just 38% of women say they have a financial advisor who can help them navigate a financial windfall. And only about half of women know where to go with a financial windfall vs. 72% of men.”3
Lack of access to wealth management services and/or an insufficient comfort level with the subject matter can introduce considerable stresses and risks regardless of one’s gender. What is striking though is the extent to which women report feeling uncertain about how best to handle inheritance or other sudden asset accumulation, although we question whether many men overstate their confidence in such matters. Above all, each client’s objectives differ, which is why Appleton takes a personalized approach to financial planning and investment strategy. Please let us know how we can help your family, friends, or colleagues.
At Appleton, we take great pride in the wealth management and financial planning services provided to our clients. Is there someone you care about who might benefit from working with us, but you’re unsure how to make the introduction? If so, please let us know. We are happy to help.
Please contact your Portfolio Manager or reach out to Jim O’Neil, Managing Director.
617-338-0700 x775 | [email protected] | www.appletonpartners.com
This commentary reflects the opinions of Appleton Partners based on information that we believe to be reliable. It is intended for informational purposes only, and not to suggest any specific performance or results, nor should it be considered investment, financial, tax or other professional advice. It is not an offer or solicitation. Views regarding the economy, securities markets or other specialized areas, like all predictors of future events, cannot be guaranteed to be accurate and may result in economic loss to the investor. While the Adviser believes the outside data sources cited to be credible, it has not independently verified the correctness of any of their inputs or calculations and, therefore, does not warranty the accuracy of any third-party sources or information. Specific securities identified and described may or may not be held in portfolios managed by the Adviser and do not represent all of the securities purchased, sold, or recommended for advisory clients. The reader should not assume that investments in the securities identified and discussed are, were or will be profitable. Any securities identified were selected for illustrative purposes only, as a vehicle for demonstrating investment analysis and decision making. Investment process, strategies, philosophies, allocations, performance composition, target characteristics and other parameters are current as of the date indicated and are subject to change without prior notice. Registration with the SEC should not be construed as an endorsement or an indicator of investment skill acumen or experience. Investments in securities are not insured, protected or guaranteed and may result in loss of income and/or principal.