


Insights and Observations
Economic, Public Policy, and Fed Developments
- The most surprising part of the failure of Silicon Valley Bank (SVB), the largest since 2008, was that it failed for very old-fashioned reasons. Banks make money by borrowing customer deposits and either loaning the proceeds out or investing in interest-bearing assets, capturing the margin between interest earned and paid. In SVB’s case, an affluent venture capital clientele largely did not need to borrow, so they invested an unusual amount of their balance sheet in long-term Treasuries. When rates rose and a VC funding slowdown prompted deposit withdrawals, they were forced to sell assets at large losses to raise capital, spooking depositors. This produced an old-fashioned bank run, more reminiscent of 1931 than 2008.
- This context is important in understanding the market reaction. While the saying goes the Fed always hikes until something breaks, this wasn’t a break in any conventional sense. SVB failed due to poor risk management and a loss of confidence, not a deterioration in loan credit quality due to a faltering economy.
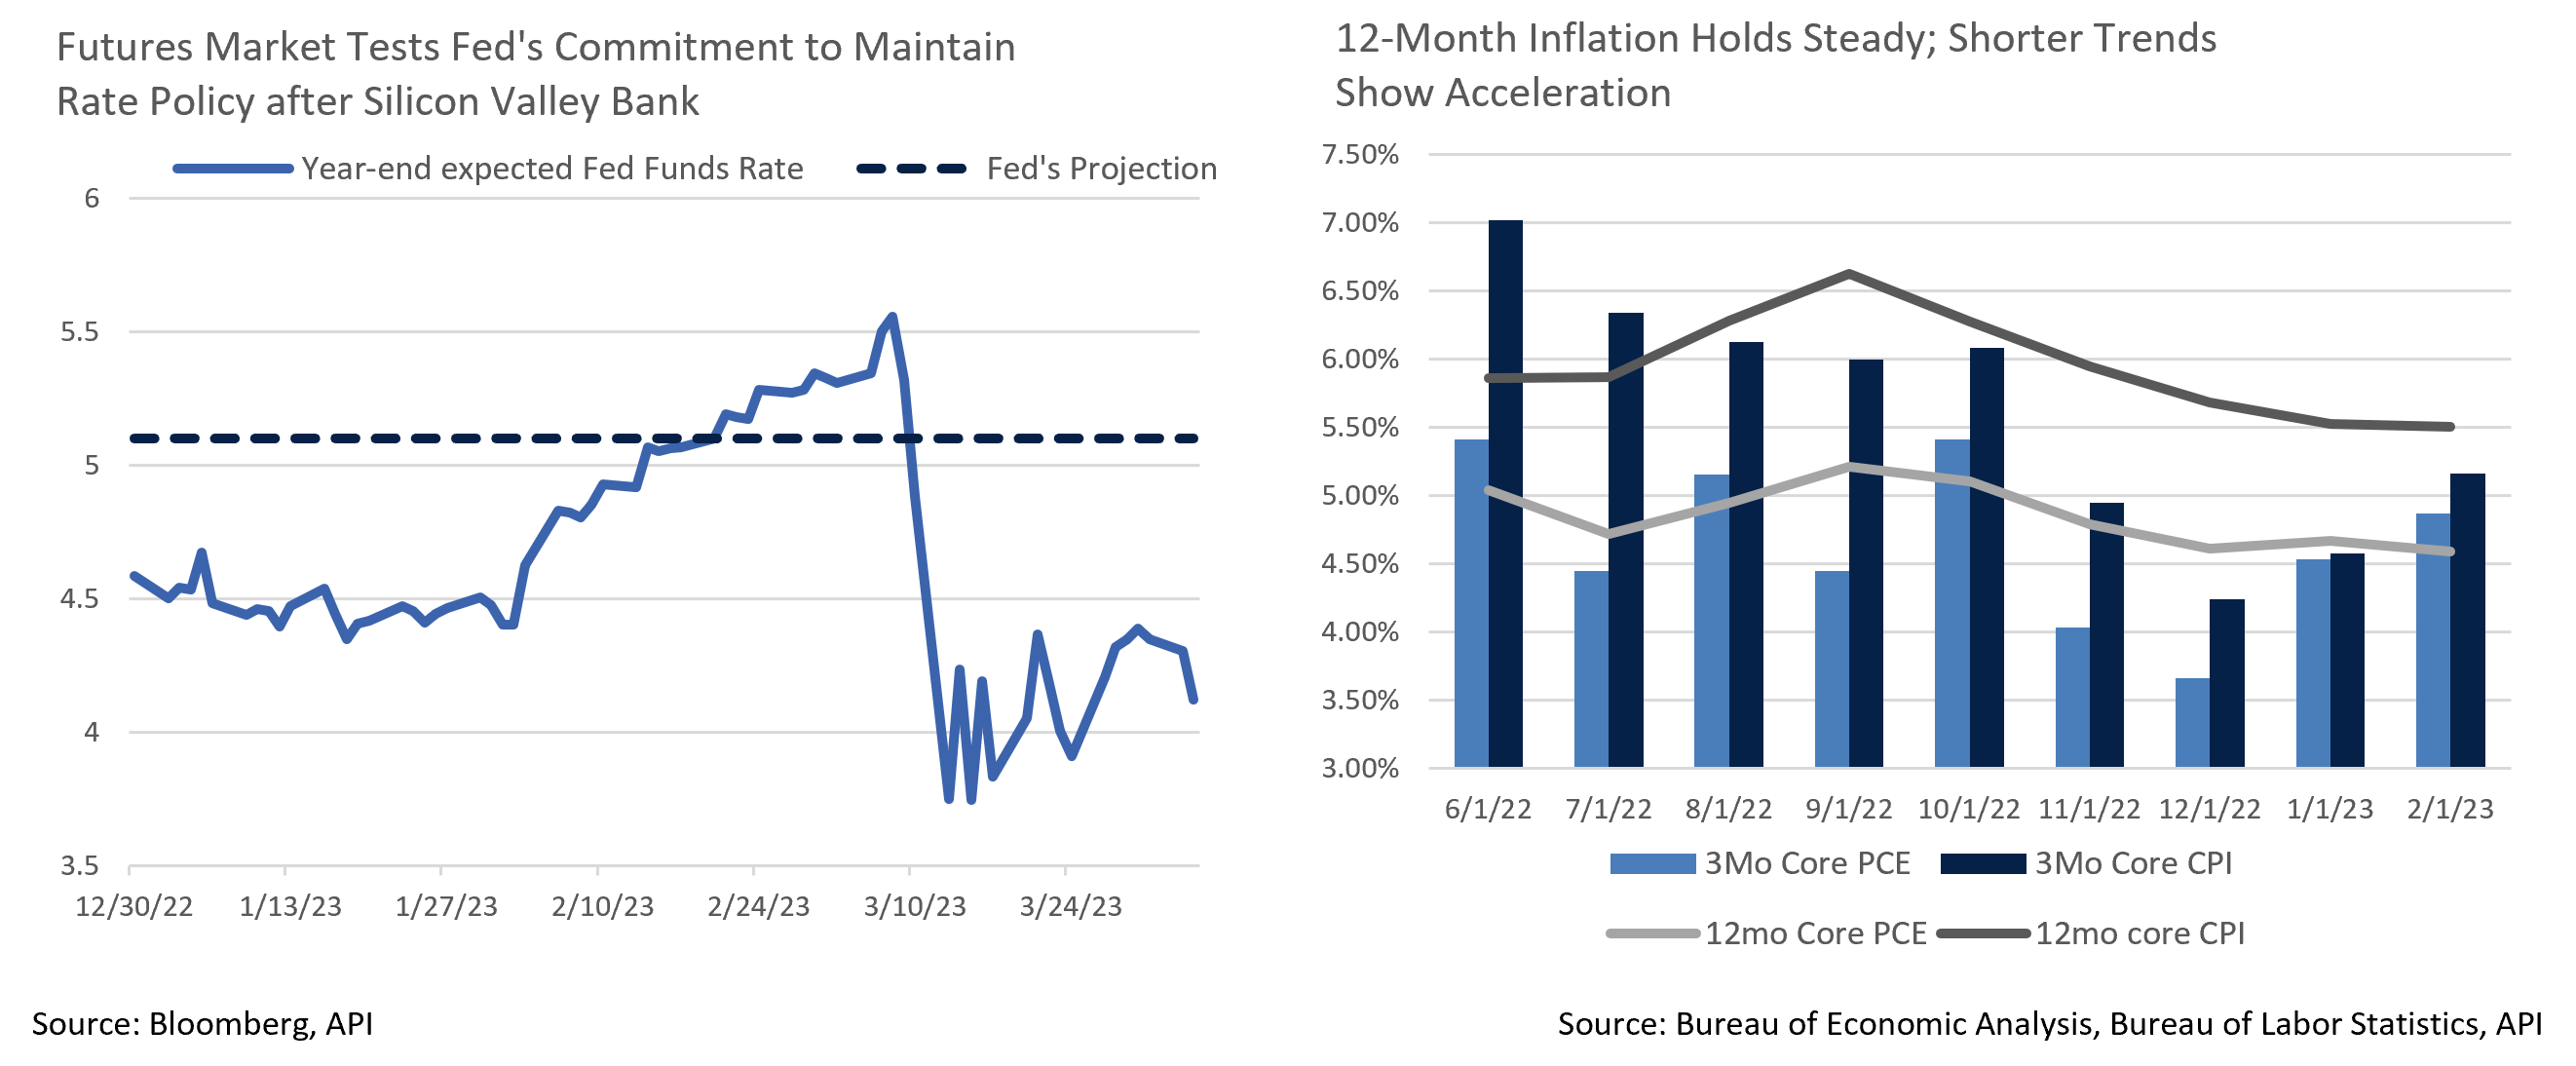
- In fact, despite lingering concerns, the economic outlook remains remarkably robust – the February jobs report comfortably exceeded expectations, 311k vs 225k, making this the 11th consecutive month of above-consensus job growth. Real personal spending fell a modest -0.1%, although with prior month revisions from +1.1% to +1.5%, nominal spending was actually higher than forecast. Businesses are still hiring, and consumers are still spending; the Atlanta Fed’s GDPNow estimate now stands at +1.7%, a deceleration from Q4 but still solid. Of course, the downside of this strength is that 4.6% core PCE and an accelerating trend in core CPI still leaves inflation too hot for the Fed’s comfort.
- By late February market expectations had risen to a peak Fed Funds Rate as high as 5.7%, but after the SVB collapse these fell sharply to just below 5%. At least for now, a decline in the expected peak rate makes sense. Bank turmoil will tighten credit conditions in much the same manner as additional hikes, by reducing banks’ ability to lend and customers’ desire to borrow. The Fed’s projection for a 5.1% year-end Fed Funds rate was unchanged in March; we do expect the Fed to achieve this target, though a rapid return to calmer financial markets could bring one or more additional hikes into play.
- More puzzling is the sudden drop in year-end rate expectations, with cuts now priced in as early as July. This directly contradicts the Fed’s commitment to hold rates at their terminal level for some time, and suggests futures traders are positioning for an imminent recession (in stark contrast with equities). We feel the Fed will push back against fresh expectations for a pivot and emphasize that every other disagreement between the Fed and the markets in the current hiking cycle has been resolved in the Fed’s favor.
- Another very real risk pushed to the backburner is the debt ceiling. With the Biden Administration demanding a clean bill and Speaker McCarthy seeking general spending concessions but not committing to specific policy proposals, negotiations will almost certainly go to the 11th hour. We believe both parties ultimately intend to raise the ceiling, although McCarthy’s razor thin control of the House, where any one member of his divided coalition can force a no-confidence vote, increases the odds that procedural delays trigger an unwanted crisis.
Equity News and Notes
A Look at the Markets
- US equities were mostly higher in March as the S&P 500 rebounded 3.5% to bring its YTD total return to +7.5%. The gain gives the index back-to-back >7% quarterly advances following three straight quarters of 2022 losses. The Nasdaq surged +6.7% to lift the tech-heavy index to +17% for Q1, its best quarter since Q2 2020. The DJIA, 2022’s leader, continues to lag with a +1.9% gain in March, raising Q1 performance to a modest +0.9%.
- March’s gains came despite a simmering banking crisis that saw the shutdown of Silicon Valley Bank (SVB) and Signature Bank along with acute deposit concerns and selling pressure at other regional banks. The Fed, Treasury, and FDIC all stepped in to quell contagion fears and their assertive measures appear to have worked for now, although we are hesitant to sound the “all-clear”. Financial sector earnings demand close attention as the industry’s profitability is likely to be diminished.
- A notable development this past month came through a shift in expectations around the future path of interest rates. While February saw a significant increase in the Fed’s projected terminal rate, March reversed much of that move. As an outgrowth of banking turmoil, the Fed acknowledged that financial conditions are likely to tighten, a dynamic equivalent to one or more rate hikes. The NFCI index chart below shows that conditions are now nearly as tight as they have been over recent years other than during the height of the pandemic. The Fed has already raised 4.75% over nine straight meetings, a historic pace, and assessing “long and variable” monetary policy lags may soon be appropriate. The collective impact of major drawdowns in crypto, SPACs and other speculative pockets of the market, coupled with the 2nd and 3rd largest bank failures in US history, is likely to give the Fed reason to at least consider a pause in the hiking cycle, although we do not foresee significant 2H 2023 cuts unless economic conditions unexpectedly deteriorate. The CME odds for a 25bps hike at the next meeting in early May currently sit at 40%.
- A shift in Fed expectations and a subsequent drop in interest rates led to a rotation into large-cap tech and quality growth names. Technology and Communication Services each gained over +10% in March. The only other sectors to outperform the overall market were Utilities and Consumer Staples, two historically defensive sectors. At face value this may seem like an anomaly; we feel it highlights investors’ view that large-cap tech names offer defensive characteristics given their large, quality balance sheets and higher margins. The NYSE FANG+ Index, which includes names such as Apple, Microsoft, Nvidia, Meta, and Alphabet, has advanced more than +39% over the past three months. In a reversal of 2022, Large Growth has outpaced Large Value by 13.5%, one of the widest margins to start a year in history. This level of outperformance is unlikely to be sustainable although we continue to favor high quality growth as a defensive proxy.
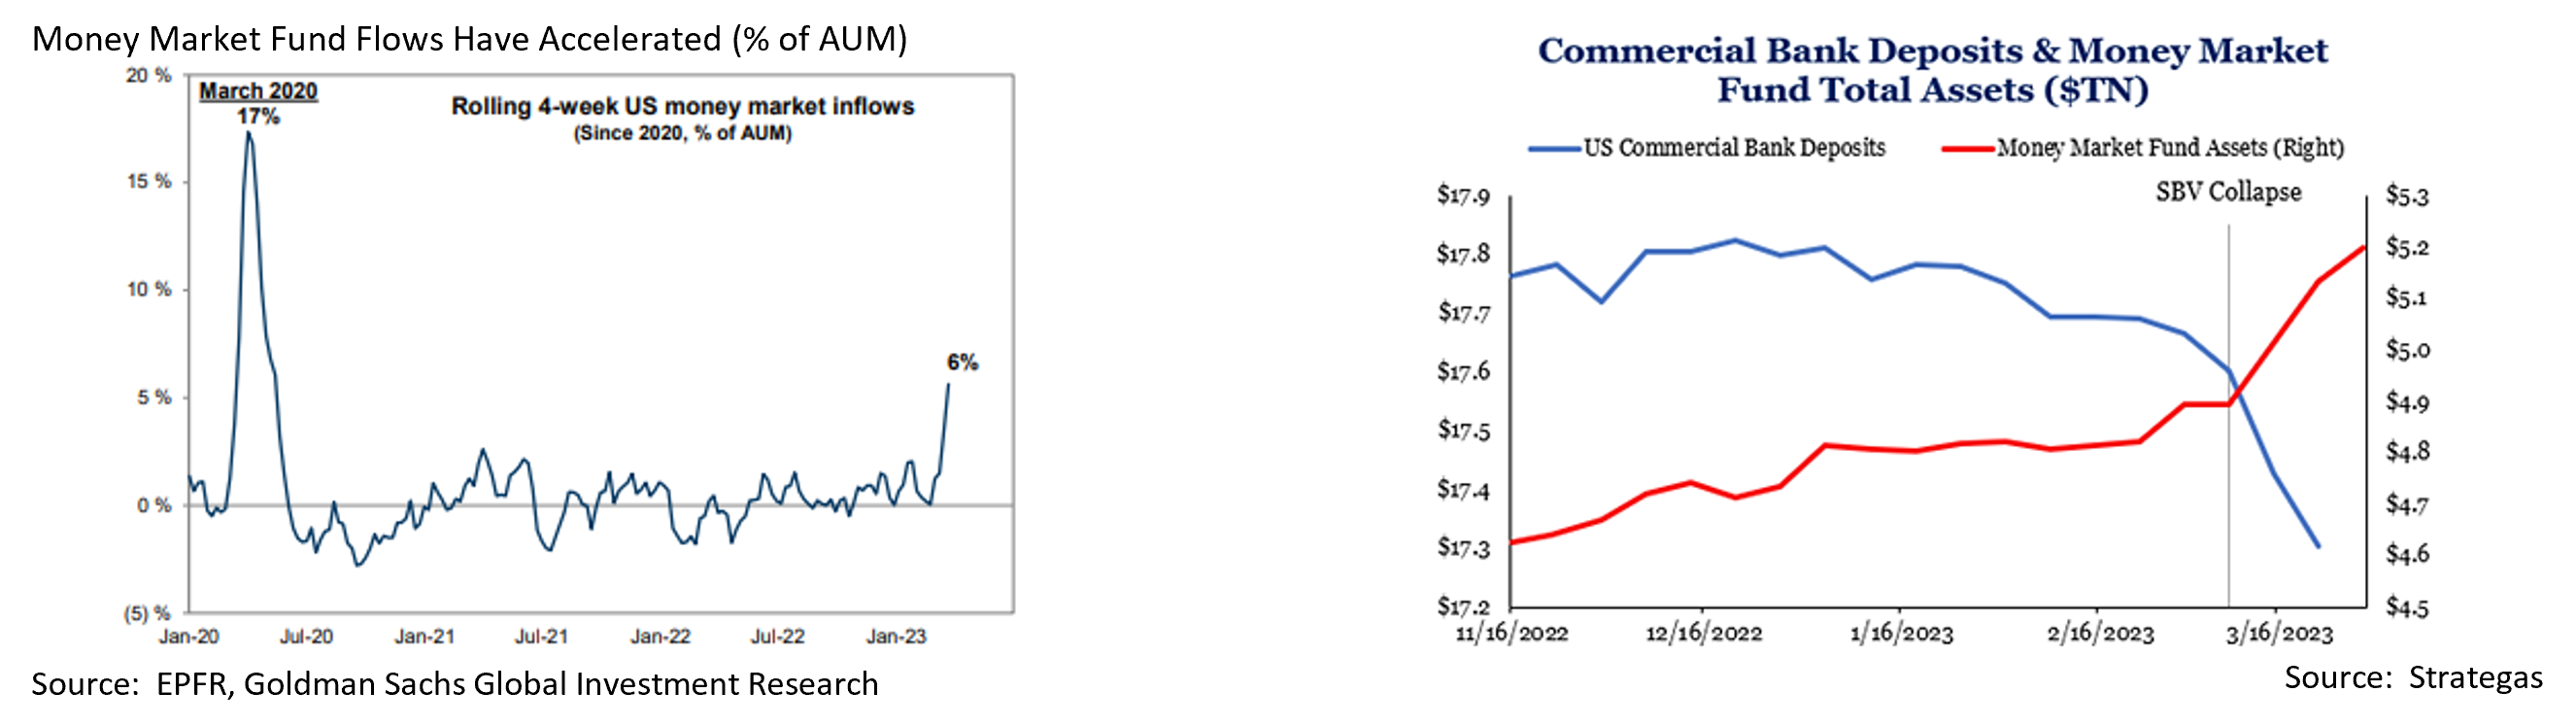
- Accelerated inflows have ballooned money market fund assets to a record $5.2 trillion. Several factors are at play, including a move out of bank deposits as investors look to get under the $250K FDIC insurance limit, and a flight to safety given the level of uncertainty surrounding banks, inflation, and the economy. While this is currently a headwind for risk assets, it also offers potential benefit once rates begin to decline and that money seeks a new home.
- Over the past weekend, OPEC+ surprised the markets by announcing an oil production cut of ~1.2 million barrels per day (bpd). This cut, combined with the 2 million bpd cut announced in October and the 500K bpd cut announced by Russia in February takes roughly 3% of global oil production offline. The price of WTI crude surged 6% following the news, trading to over $80/barrel. Some have argued that the cuts will put upward pressure on inflation and increase the odds of further tightening from the Fed while simultaneously slowing economic growth. We wouldn’t argue with those calls directionally but think the impact of these recent moves will be relatively muted unless oil starts to approach $100/barrel.
From the Trading Desk
Municipal Markets
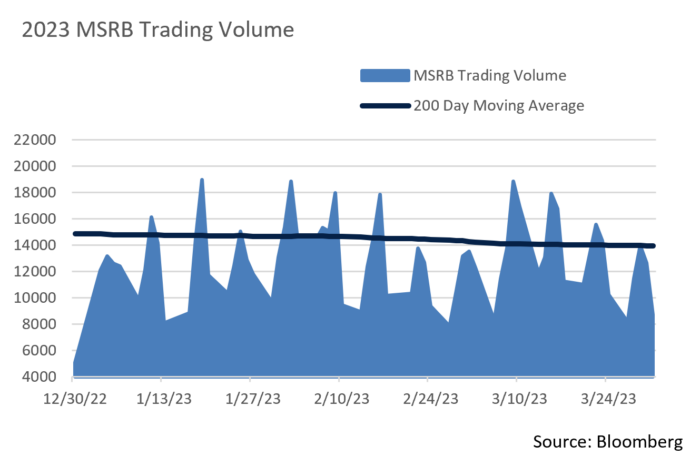
- We entered March with an expectation that it could be a challenging month given seasonal tax related selling and limited maturities; a performance boosting flight to quality was not anticipated. Nonetheless, the municipal market posted its strongest March returns since 2008, in large part due to banking turmoil and UST yields moving lower.
- Despite yields being well off October 2022’s peak, Q1 new issuance has been modest, trailing last year’s pace by 30% according to B of A and Refinitiv data. Limited supply creates challenges getting cash invested, but it has been a tailwind for returns. Localities have sold about $69 billion of long-term debt in 2023, down 23% from the same period a year ago. B of A is now projecting $400 billion of new supply for all of 2023, well off their prior $500 billion estimate.
- Muni/UST ratios remain relatively rich with the 10-year ratio ending Q1 at just over 65% and 2-year ratio at only 59%. We expect this dynamic to continue as long as the new offering calendar remains muted and demand is sustained. The most attractive part of the curve in our view now lies in a relatively tight 10 to 12-year maturity range.
- Many bid lists at the end of the month were comprised of bonds maturing between 2029 – 2033 with calls in 2026 – 2028, structures that we feel lack compelling relative value. Many such bid lists have not traded at all lately, and we instead are looking more actively at non-callable maturities in a 2029-2033 range.
- The spread between the yield dealers offer and traders bid, the bid/ask spread, has widened. Therefore, trading conditions have become challenging and price discovery is often coming from the new issue calendar rather than secondary markets. New issue deals are being bid aggressively, a sign of healthy demand.
Corporate Bond Markets
- March was one of the more volatile months in many years. The month opened with expectations that the Federal Reserve’s path of rate increases would persist and, accordingly, short term UST yields were poised to move higher. The 2Yr UST yield of 5.07% at the beginning of the month was the highest since June 2016. Those levels quickly disappeared on news that Silicon Valley Bank (SVB) was under severe duress. A flight to quality sent yields lower and they have not looked back. 2-year issues ended March at 4.02%, and investors who bet on higher yields rushed to cover, a “risk-off” environment eerily reminiscent of the 2008 financial crisis.
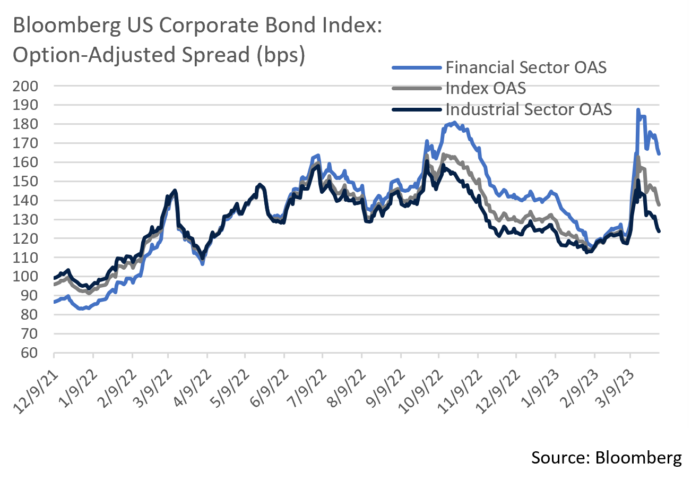
- Nonetheless, outside of directly impacted sectors such as regional banking, IG Credit has remained firm. After reaching post-pandemic highs (OAS of 169 bps) in October of 2022, the market has largely rallied. But it’s been a bumpy road; March opened with the Bloomberg Barclays US Credit Index at an OAS of 119 bps, a level that spiked to 154 bps in the days following SVB’s failure, before closing at 138 bps after the Federal government moved to defuse depositor and bank liquidity fears.
- Much of recent spread volatility was attributed to the Banking sector. The OAS within the sector began March at 127 bps and climbed as high as 187 bps before receding to 164 bps. We have long emphasized US Global Systemically Important Banks (GSIBs) instead of regional banks in bond selection, as our research team takes comfort from GSIB requirements that far exceed regional bank peers, including higher capital buffers, Total Loss-Absorbing Capacity (TLAC), resolvability, and more intensive supervisory/regulatory expectations. This longstanding credit stance has proven to be beneficial of late.
- Yields and spreads were not alone in feeling the reverberations of uncertainty. IG primary market issuers brought $100 billion of new debt in March, a figure that fell about 30% short of expectations. Immediately following news of SVB’s woes, a highly atypical zero issuance week ensued. Primary market conditions at other times were choppy, but those who were able to navigate uncertainty were rewarded as new issue concessions were low and deals were heavily oversubscribed. Secondary market performance was also generally solid. In short, we view IG Credit conditions favorably outside of the most heavily impacted pockets of the market and are looking for bond supply that meets our credit and relative value criteria.
Financial Planning Perspectives
Making The Most Of Secure Act 2.0
In January’s Financial Planning Perspective, we highlighted significant features of the newly minted Secure Act 2.0 aimed at retirees and those nearing retirement. Along with those provisions, individuals further from retirement can also significantly benefit from this legislation. We now turn to how SECURE Act 2.0 can help the younger generation save for retirement, regardless of how far away that date may be.
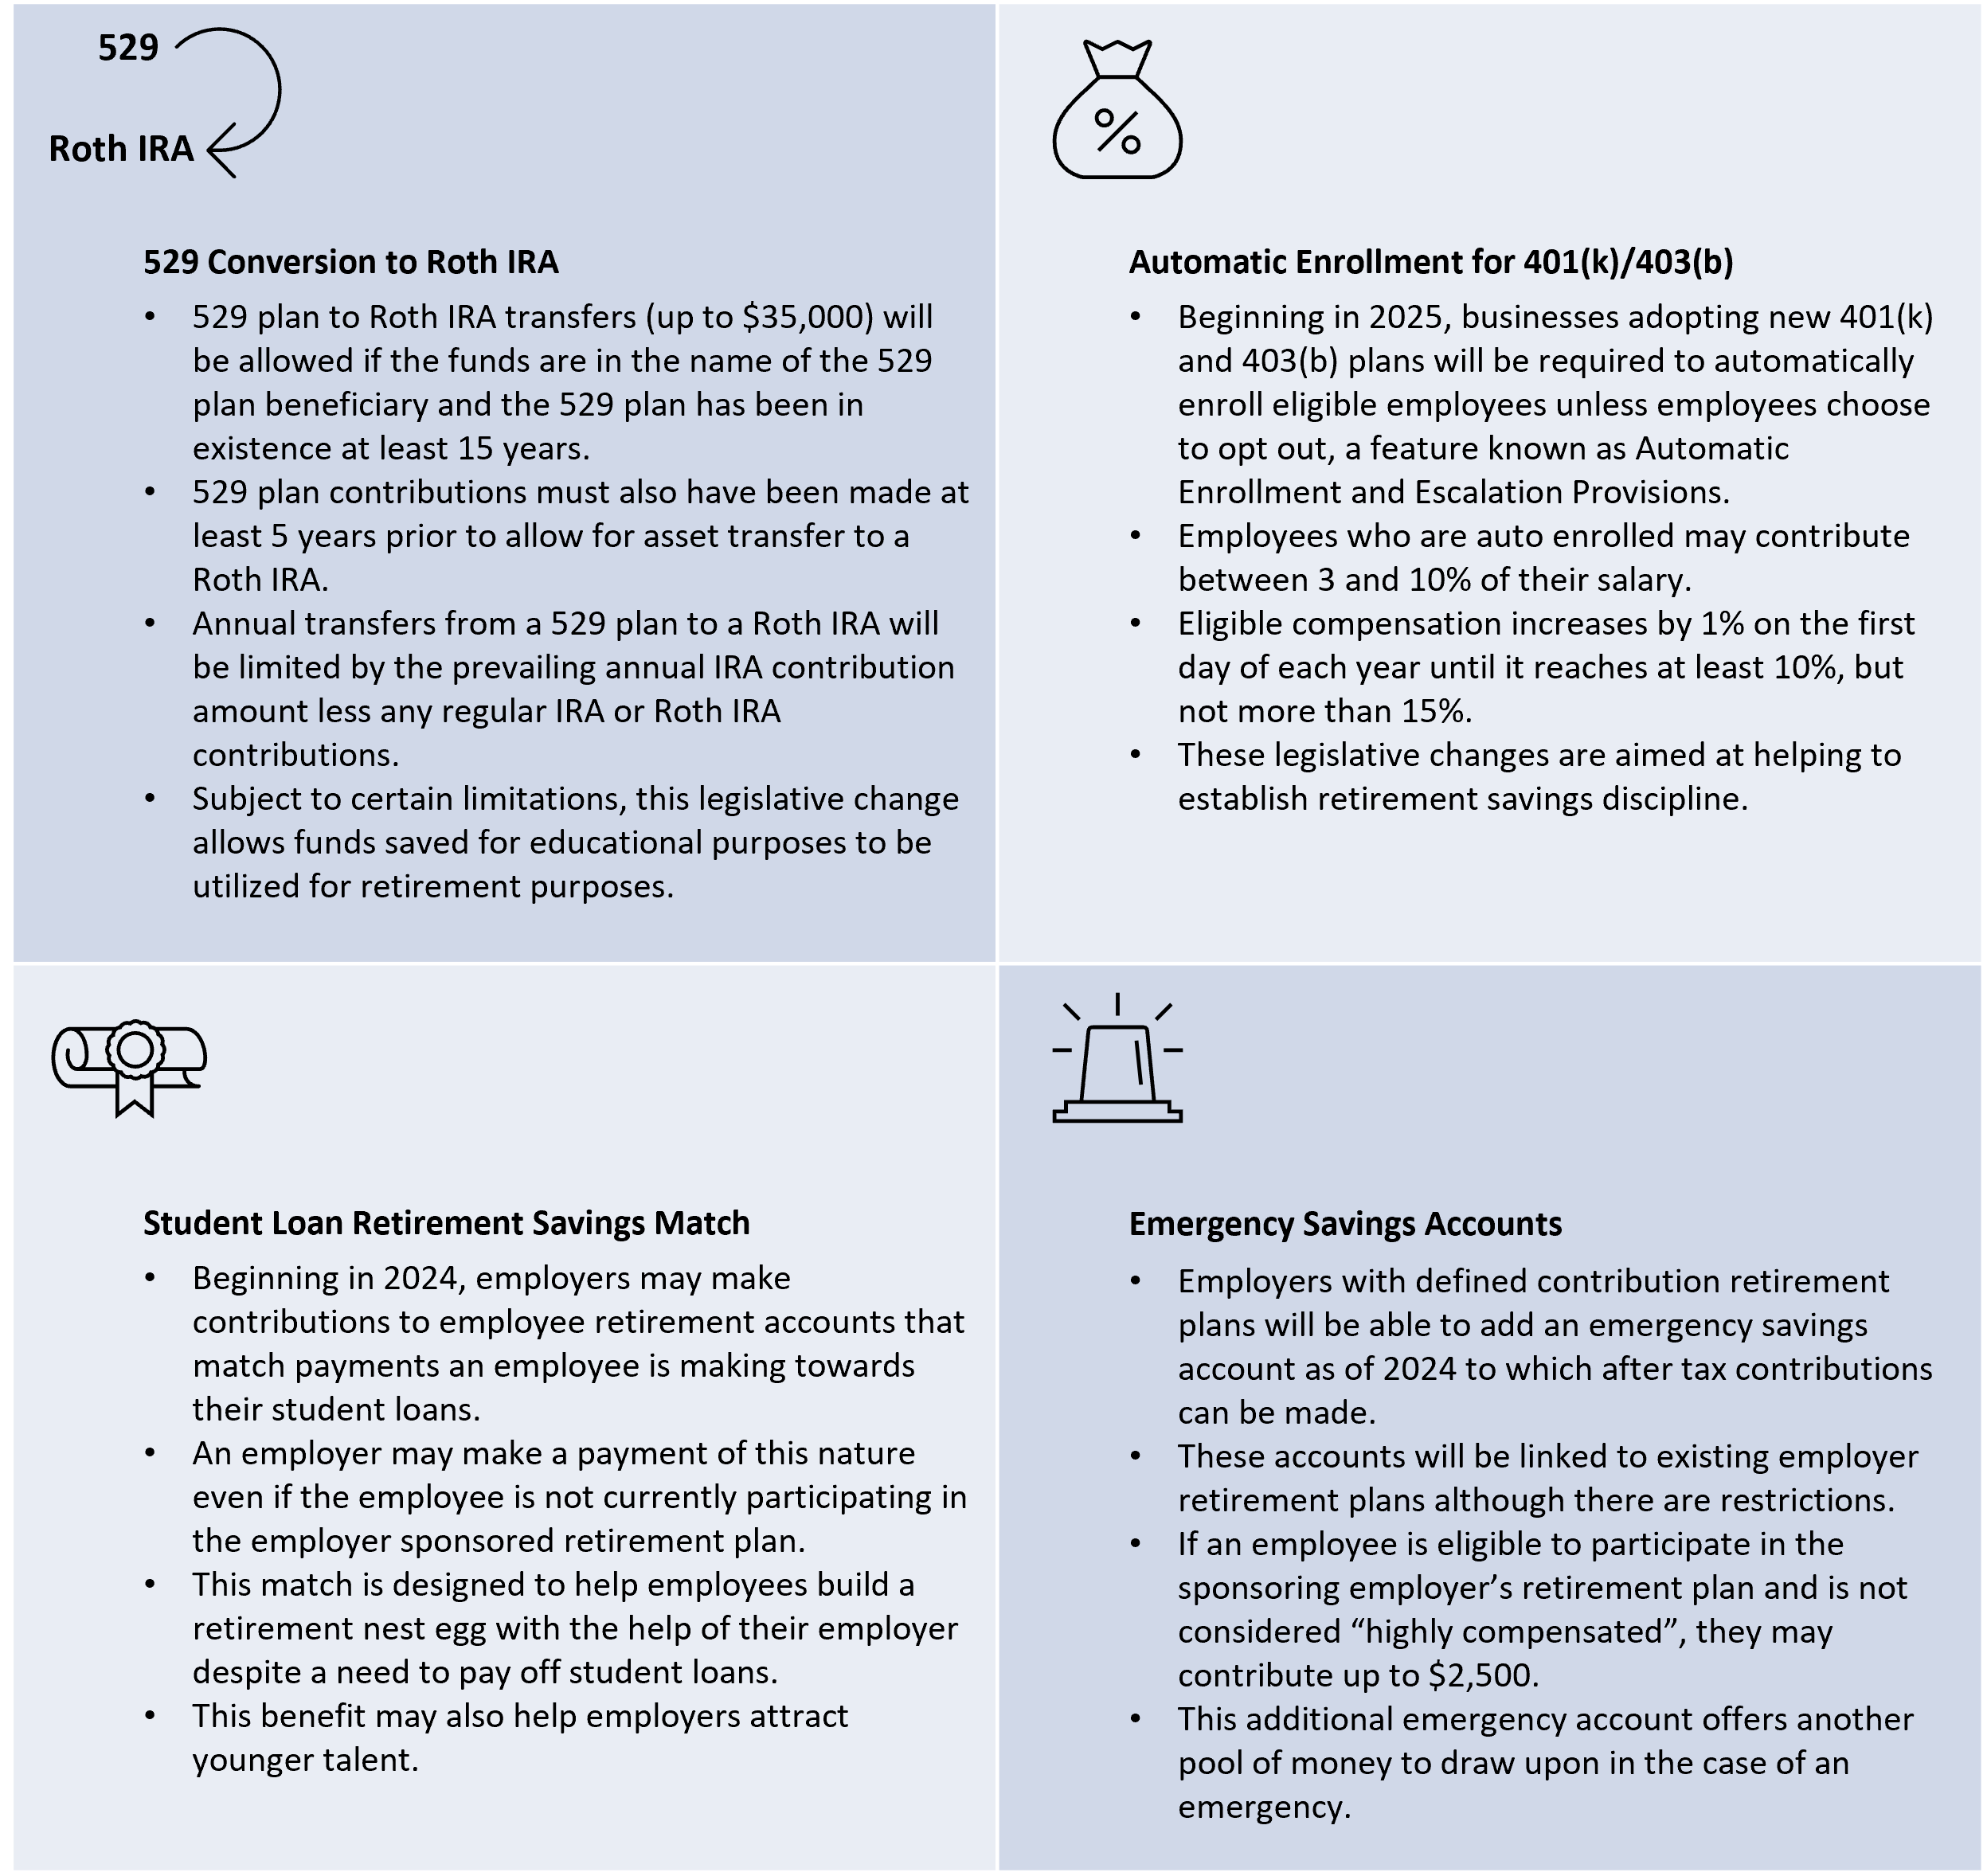
Please speak with your Portfolio Manager about how you or your family members might benefit from these and other SECURE Act 2.0 provisions.