


Insights and Observations
Economic, Public Policy, and Fed Developments
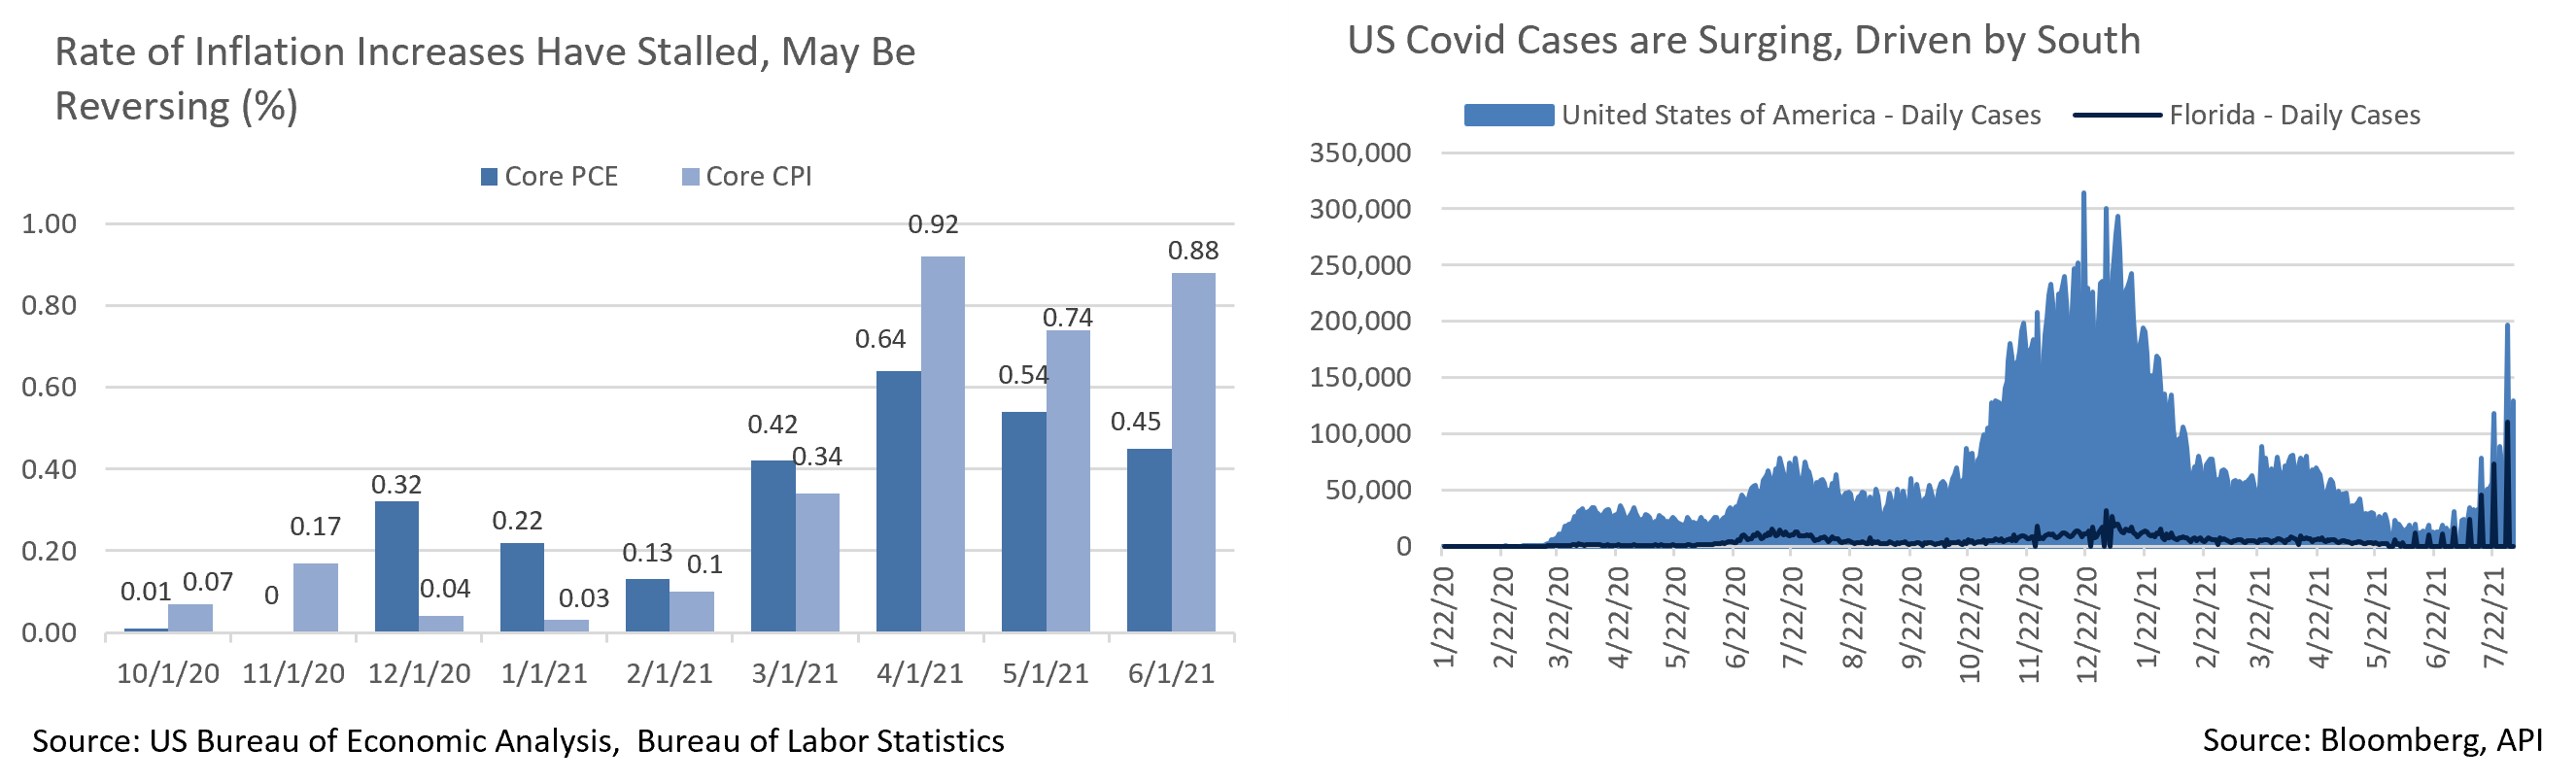
- The inflation narrative was the dominant market driver over the first half of 2021, and as we enter August, data appears to support the Fed’s belief that inflation will be transitory. Despite the market’s focus on upside surprises, the rate of increase in monthly readings has stalled out and, particularly the Fed’s preferred Core PCE, may be forming a downtrend. While it will be some time before year-over-year readings begin to recede due to earlier near-zero readings dropping out, inflation appears to have peaked.
- Additional support for a waning of inflationary pressure came from this week’s Manufacturing PMI Survey. While the headline number was encouraging and suggested moderation to a still strong but more sustainable level, the prices paid and delivery time sub-indices showed signs of moderating inflation. While these are still extremely high levels by historical norms, the data suggests that manufacturers are seeing pricing pressures ease and delivery times fall on manufacturing inputs.
- Durable Goods orders and retail spending also showed signs of moderation. June’s Durable Goods orders came in under consensus, +0.8% vs +2.2%. While prior period upward revisions partially offset the miss, the absolute level of orders were still low and most of the strength was concentrated in transportation equipment, which should help with backlogs. Ex-transportation, orders have now fallen for three straight months. Meanwhile, while retail sales beat, +0.6% vs -0.3%, prior period downwards revisions coupled with a +0.9% price increase component suggest purchasing is starting to slow off high levels. Michigan Consumer Sentiment sub-indices also offer evidence that consumers are starting to pull back on big-ticket purchases, with notable declines in the Large Household Vehicles, Homes, and Vehicle categories.
- Despite some initial resistance, the “Infrastructure Investment and Jobs Act” moved out of Senate committee comfortably, with 17 Republicans joining Democrats in a 67-32 vote to open debate, a sign that it may have enough support to pass. The bipartisan bill is now expected to total $1.2 trillion, including $550 billion in new spending over five years. The House still intends to pass the bill in lockstep with a larger “human infrastructure” bill that leaves Speaker Pelosi with a very narrow pathway to hold her slight majority caucus together. It remains unclear if the House “human infrastructure” bill has the votes to pass the Senate, even via budget reconciliation.
- Q2 GDP came in below expectations, +6.5% vs. consensus forecast of +8.4%. Below the surface, growth looked a bit stronger. A drawdown in inventories was responsible for a 1.1% detraction in headline GDP, as well-publicized supply chain issues weighed on growth. GDP would have still missed even if supply chains had been able to keep pace with demand, though by a lot less. As inventories are replenished some of Q2’s expected GDP growth will likely move into Q3.
- The Fed’s July meeting came and went with little event. The meeting was most notable in that it represented another opportunity for the Fed to adjust messaging and move up their taper timeline, although they instead held course. The most interesting news came out of the press conference, where Chairman Powell indicated there was “little support” at the Fed for tapering MBS purchases before Treasuries despite speculation they might move there first to cool a hot housing market.
- Unfortunately, the Covid-19 pandemic has been anything but uneventful recently, as cases have been surging, particularly in the South where vaccination rates are much lower. Although Florida’s “reopen at all costs” approach initially seemed to spare the state the worst of feared outcomes, cases began rising rapidly during July. The final week had Florida, a state with 6.5% of the country’s population, responsible for 25% of the nation’s new cases. Louisiana, South Carolina, and Mississippi show similar trends, though from lower bases. A return of widespread economic shutdowns still seems unlikely, although we are concerned about the human and economic costs a growing Covid wave could bring.

Equity News and Notes
A Look at the Markets
- Stocks trended up in July as the major domestic large-cap averages touched all-time highs in the final week of the month. The S&P 500 hit a 6-month win streak, its longest such run since 2018, gaining 2.4% to bring the YTD total return to +18.0%. Small caps were the exception, as the Russell 2000 finished down -3.6%, bringing an impressive 9-month win streak to an end.
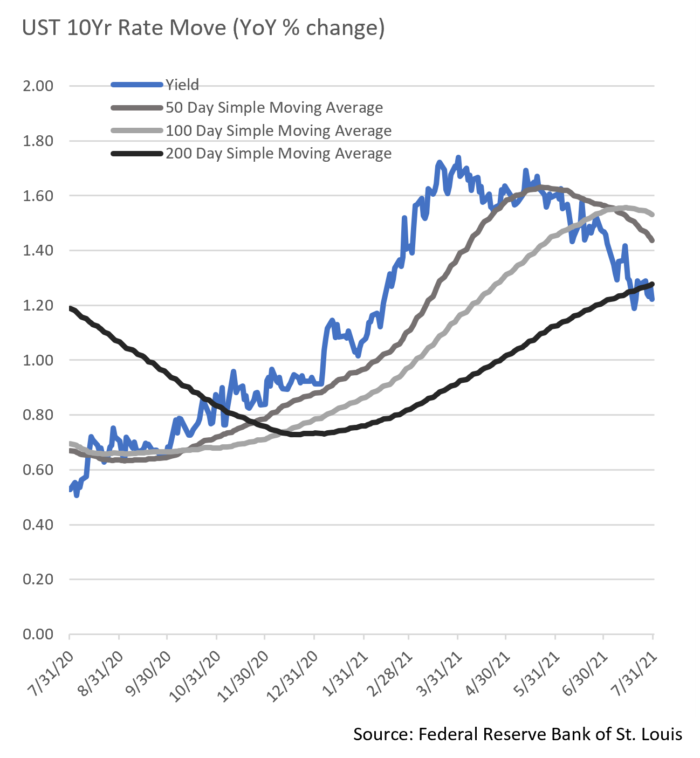
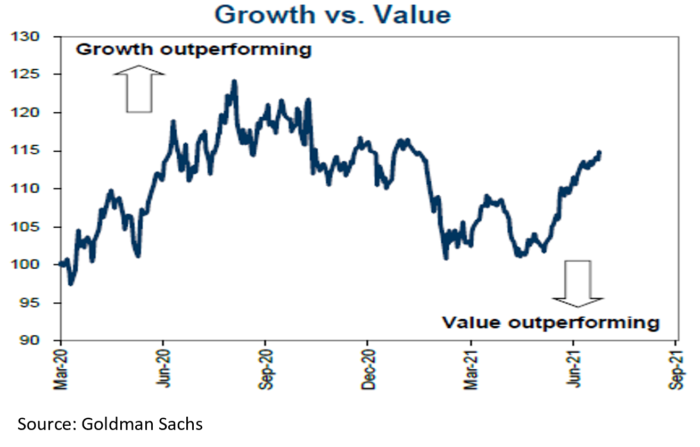 Interest rate moves continue to drive sector and style rotations. Bond yields declined further in July with the flagship 10Yr UST falling by 23 bps to 1.22%. The drop in yields can be attributed to a combination of factors, including peaking economic growth, Delta variant concerns, at least a temporary easing of inflation expectations, and foreign demand for bond income. Defensive, bond-proxy sectors (Utilities & REITs) outperformed, while the Russell 1000 Growth outpaced the Russell 1000 Value by 2.5%. As noted above, more economically sensitive asset classes such as small caps lagged.
- The so-called dog days of August are hardly quiet on the Q2 earnings front and, so far, results have been remarkable. Of the ~60% of S&P 500 companies reporting to date, 88% have beaten earnings expectations and 88% outpaced on revenues, both highs dating back to at least 2008. Q2’s blended earnings growth rate of +85% is up considerably from an already bullish +63% anticipated on June 30.
- Earnings were expected to be strong compared to a year ago, but we are impressed by the margin of the beats. Typically, Wall Street analysts lower their expectations heading into earnings season, yet estimates have been on the rise coming out of the pandemic, making this season’s results even more surprising. However, 2022 earnings growth estimates have dropped below +10% for the first time. Has the recent strength borrowed from the future, or is it simply too early for analysts to raise 2022 estimates given so many lingering uncertainties? If it is largely the latter, we see considerable potential for upside surprises.
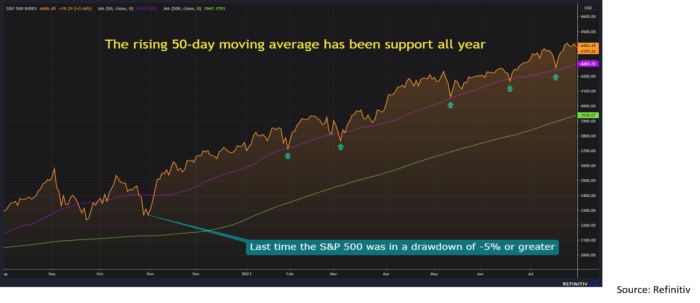
- It has been challenging finding compelling stock entry points given the lack of pullbacks. Last month, we mentioned that the S&P 500 has experienced a maximum drawdown of -4% this year, well off the longer-term average of -14%. The S&P 500 has now gone 184 trading days without a -5% pullback, nearly double the long-term average of 94 days. Despite larger drawdowns in certain pockets of the market, the overall average has found considerable support all year at the 50-day moving average. This condition will not last forever, but it does speak to underlying demand for stocks given healthy economic recovery, massive fiscal and monetary support, and very low interest rates.
From the Trading Desk
Municipal Markets
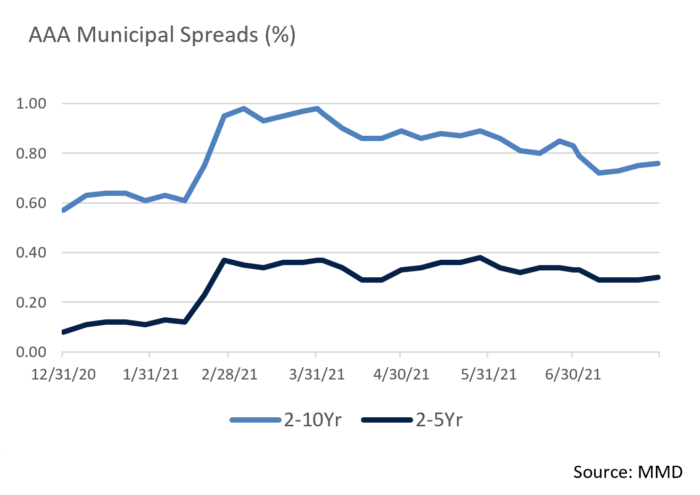
- The MMD curve flattened over the month with the 2-10Yr AAA spread declining from 83 bps to 76 bps, yet it remains significantly steeper than where we stood at year-end 2020 (57 bps). We continue to find value in the 5 to 9-year portion of the curve.
- During the month of July, taxable municipal issuance as a percentage of total issuance increased, suggesting there is still a desire for taxable advanced refundings. Year-to-date, taxable municipals as a percentage of the total is about 25%. Should US Treasury rates remain low, we expect to see continued issuance in that area of the market, leading to buying opportunities for those looking for taxable income.
- Peter DeGroot of JP Morgan recently looked at couponing in bonds over the first half of the year and noted that secondary trading of 5% coupons declined from 60% to 49% since the Tax Cuts and Jobs Act was enacted. The proportion of 4s and 3s increased marginally, although 2% coupons increased the most, rising from 3.6% in the first half of 2018 to 13.1%. We surmise that low yield levels and relatively higher dollar prices will cause this trend to persist. Couponing is an important element of bond structure, and we evaluate various structures in both the primary and secondary market to uncover value.
- Despite modest yields the song remains the same in terms of retail demand for municipals. Net municipal mutual fund flows reached $69.5 billion on a YTD basis as August began, with long-term funds garnering $42.45 billion. Broad credit strength, ongoing policy support, and potential high-income tax increases have all fueled a sustained desire for tax-advantaged income.
Corporate Bond Markets
- Investment Grade credit spreads continue to march along the path of least resistance as market technical factors and credit fundamentals remain positive. High grade spread volatility remains muted, although the OAS on the Bloomberg Barclays Corporate Bond Index bounced off a YTD low of 80 bps at the end of June to close the month at a still tight 87 bps. That is just 11 bps wider than where we began 2021. The modest tick up in credit spreads in March driven by inflation fears has since abated due largely to a dampening of growth expectations relative to prior projections. Nonetheless, if credit spreads are to widen materially in the months ahead, we anticipate it would be a function of sustained inflation rather than weakening credit quality, as balance sheet fundamentals and market liquidity remain strong.
- The flattening UST yield curve theme of Q2 has spilled over into Q3. 10Yr UST yields had dropped 27 bps to 1.47% over the course of Q2, a bull flattening trend that accelerated another 25 bps in July with the 10Yr closing at 1.22%. That marked a low not seen since February and a yield level well below the 200-day average of 1.28%. This move has reemphasized the extent to which the timing and magnitude of post-pandemic economic growth remains in question, particularly with the emergence of the Delta variant. The fixed income markets are grappling with renewed uncertainty yet remain backstopped by formidable Federal Reserve and US Treasury support.
Financial Planning Perspectives
Differentiating Risk Tolerance and Risk Capacity
With US equity markets at or close to all-time highs, reassessing investment risk, reviewing short and long-term financial goals, and evaluating asset allocation needs may be warranted. Coming off an extremely tumultuous year and a half, we recommend taking a personal look at your ability and willingness to take on risk. Though they can be quite different, both attributes contribute to one’s ability to successfully establish and maintain a sound long-term financial plan.
As wealth managers, one of our most important responsibilities lies in ensuring that each client’s asset allocation strategy and investments are designed to suit their needs and circumstances. Financial plans must align with personal investment psychology as well as income and capital growth objectives. In doing so, the following risk factors ought to be considered.
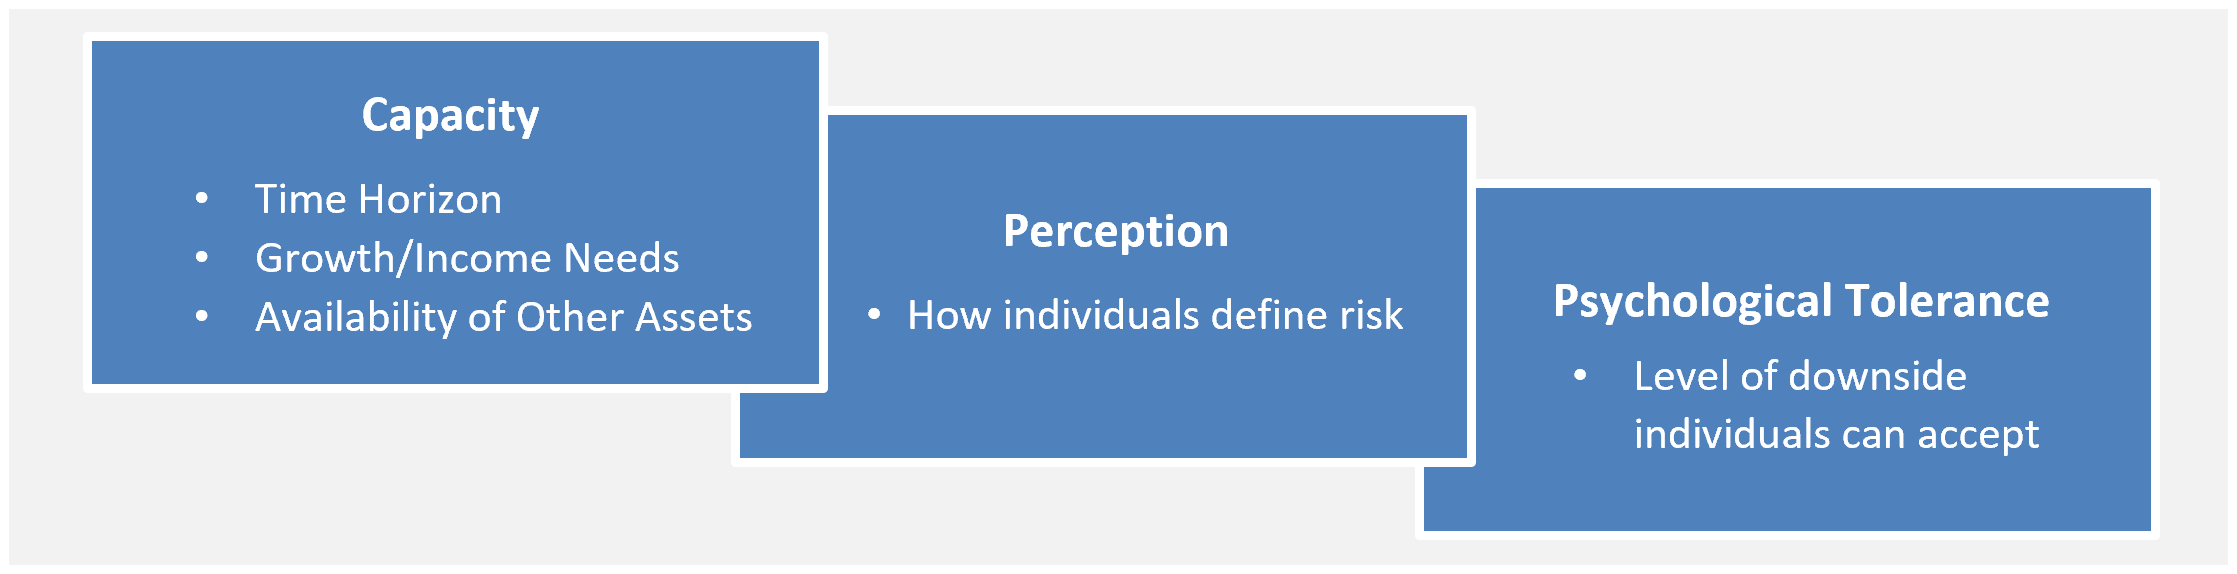
A potentially misunderstood reality is that there can be a significant difference between one’s capacity to take on risk and their emotional tolerance. The former is based on financial ability or means, while the latter is a desire or comfort level. Helping clients understand and account for this distinction is an important element of our wealth management process.
Stocks, bonds, and other investments are a means to an end and each asset class and related investment exposure introduces growth, income, and risk elements. Tailoring asset allocation strategy around outcomes is designed to best position clients to attain their goals. Doing so cannot be done in a vacuum as emotions, particularly fear, are powerful. Failing to account for this in developing plans can lead to ill-timed decisions that adversely impact long term results.
As part of our risk assessment, several important questions need to be considered:
- Can you separate your financial capacity to take on risk from your emotional ability to assume it?
- Do your financial and emotional risk capacities align?
- How best can both elements be accounted for when establishing investment goals and objectives?
Appleton’s initial planning process and subsequent reassessments emphasize these factors as we attempt to ensure portfolios are built for the long-term. We welcome an opportunity to discuss these matters with clients.
Appleton’s Upcoming Financial Planning Webinar
“What’s Driving Your Portfolio? Equity Analysis Concepts and Appleton’s Investment Process”
August 18th @ 4:00PM
Please feel free to pass this invitation along to family or friends whom you feel might benefit from participating.
For questions concerning our financial planning or wealth management services, please contact
Jim O’Neil, Managing Director, 617-338-0700 x775, [email protected]