


Insights and Observations
Economic, Public Policy, and Fed Developments
- For several months we have written about the tension between high inflation and robust consumer demand seemingly undeterred by higher prices. Inflation setting a new cyclical high in May, after what was widely believed to be an April peak, seemed to suggest demand was winning. However, several data points released in late June imply consumers may have reached their limit, and demand has begun to falter.
- First, retail sales came in unexpectedly weak in May, showing a modest nominal contraction even after prior period downward revisions. This series has been extremely volatile in recent quarters, so interpreting any one month can be problematic although there is growing anecdotal evidence of consumer weakness. Target cut its earnings outlooks in June and began running discounts on home goods and electronics, citing inventory mismatches as consumers moved away from home goods that had been popular during the pandemic. Both Walmart and Macy’s began running sales on casual apparel, as well, with Macy’s describing a reversal of the “nesting” phase of the pandemic.
- Even with such evidence of weaker demand, the final Q1 GDP release managed to surprise the markets. The headline revision was modest, -1.5% to -1.6%, but this masked a sharp drop in personal consumption from +3.1% to +1.8%. This decline was offset by a larger-than-estimated increase in inventories, revised up from detraction of -1.09% to -0.35%, likely due to the factors Target, Macy’s, and Walmart described. Higher inventories than originally measured in Q1 are also likely to weigh on Q2 GDP, in much the same manner Q4 inventories helped explain Q1 weakness.
- The consumer spending report released right after final Q1 GDP was if anything even more bleak; nominal spending missed, and every month of 2022 was revised lower. In inflation adjusted terms, consumer spending fell in May for the first time this year, -0.4% vs. expectations of -0.3%, and April was revised downwards as well. Real disposable income also fell, and with prior period revisions has now declined three of the last five months.
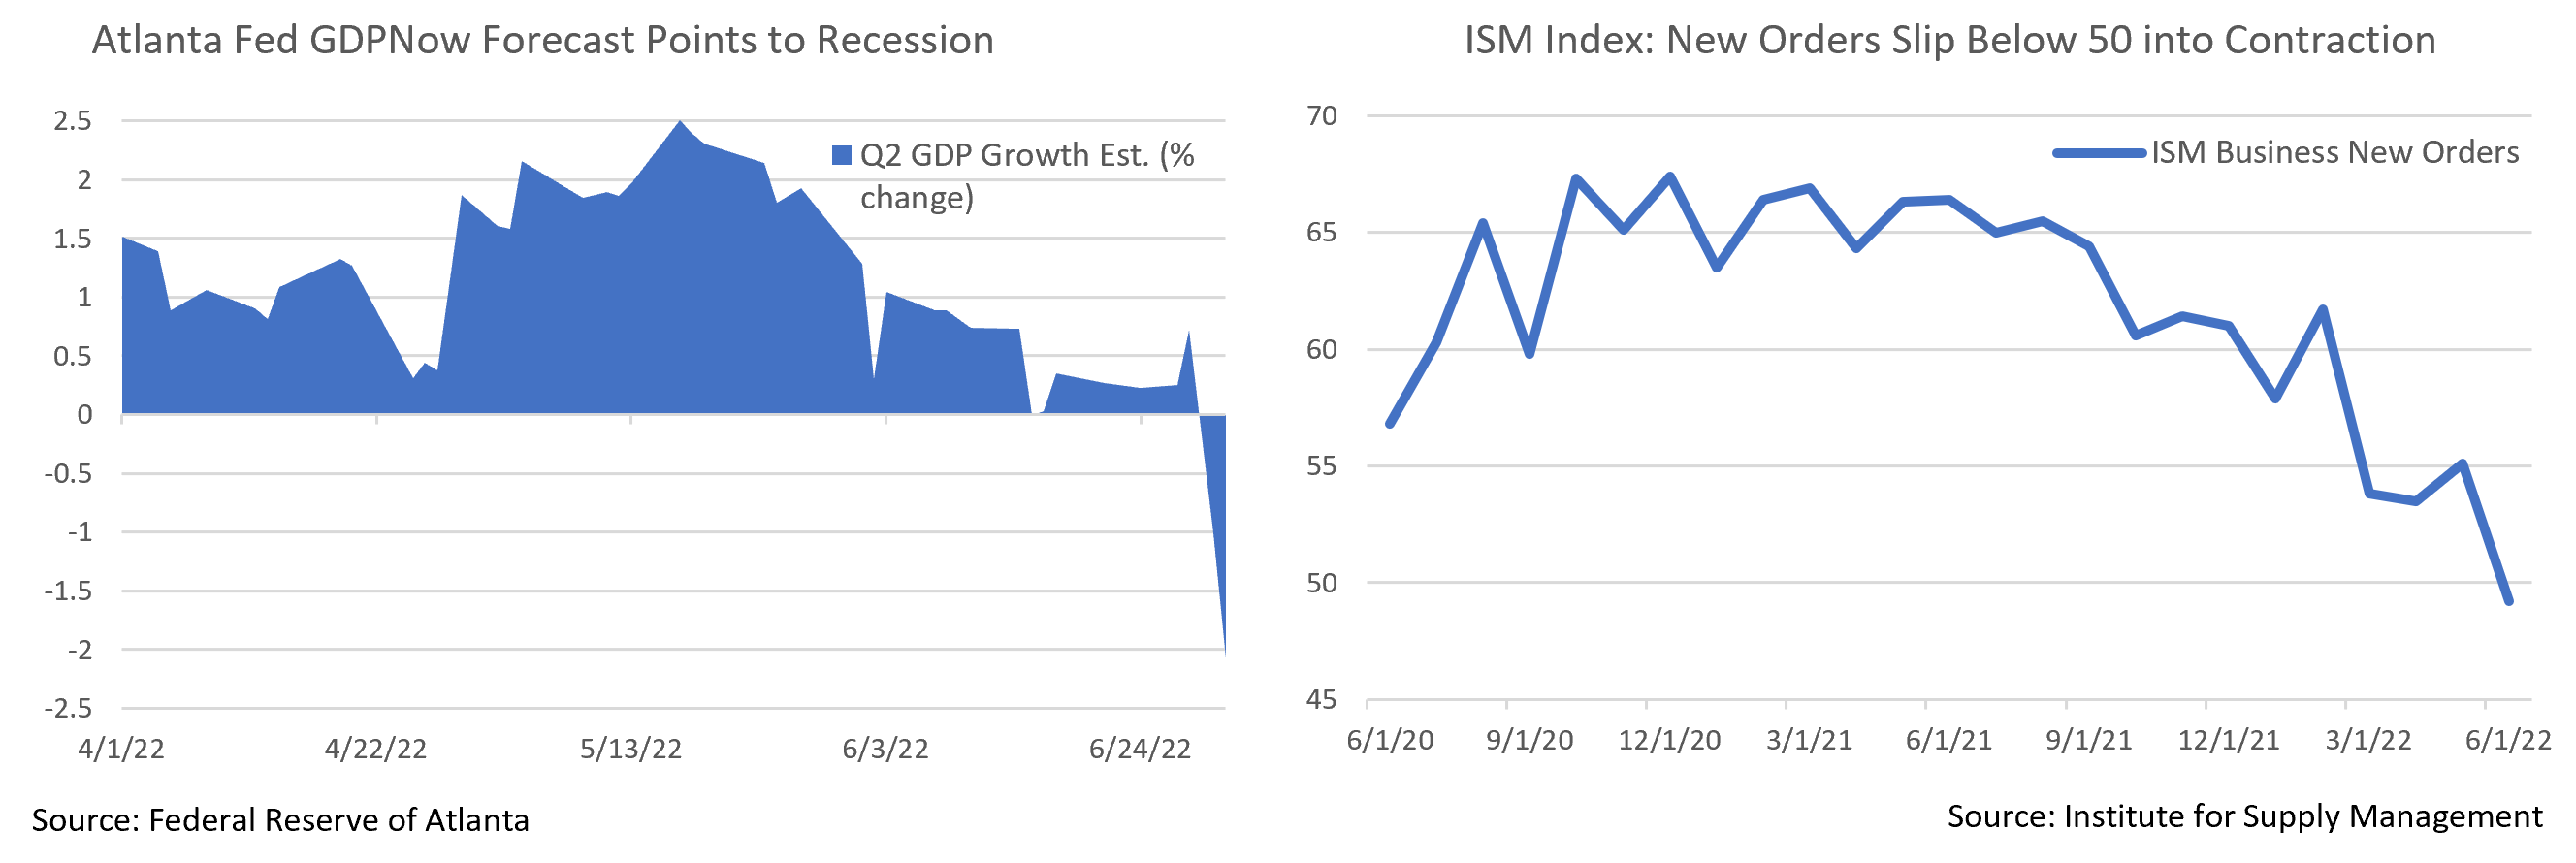
- The combined picture suggests a deceleration in personal spending that we have been expecting for some time, but from a lower base than previous releases had established. The Atlanta Fed’s GDPNow indicator, which had been fairly accurate over the past few years, saw its Q2 GDP estimation fall from +0.3% on June 29th to -2.1% on July 1st in response to these releases. There are a few weeks yet before the official release, but with live indicators now pointing to a Q2 contraction, it is increasingly likely that the US economy is technically already in a recession.
- The market abruptly repriced recession risk in response, with UST yields plummeting across all tenors. Fed Funds futures suggest the market still expects a total of 175 basis points of additional hikes through year-end, but now imply the Fed Funds rate will peak in early 2023 and the Fed may begin cutting by mid-year. This is internally consistent with Fed communications and a growing market consensus that the Fed is prepared to risk a mild recession if that is what it takes to get inflation under control before later adding back liquidity.

From the Trading Desk
Municipal Markets
- Municipal yields ended higher in June along with USTs, with the 5 and 10-year AAA curve rising by 16 and 34 basis points, respectively. Price weakness occurred most notably in mid-June as the 10-year AAA peaked at 2.91%, a time period coinciding with the Fed Funds rate increasing by 75 basis points.
- Municipals look attractive relative to USTs, with the 10-year AAA Muni/UST ratio closing the month at 92% vs. a 10-year average ratio of about 88%. Recession fears continue to give the Treasury market a strong bid.
- The municipal curve has been flattening, as yields in the belly and long end of the curve were slightly lower at month end. Given this year’s overall increase in rates, we are capitalizing on opportunities to book losses, particularly on the longer end, and are redeploying assets emphasizing discipline in managing trading liquidity.
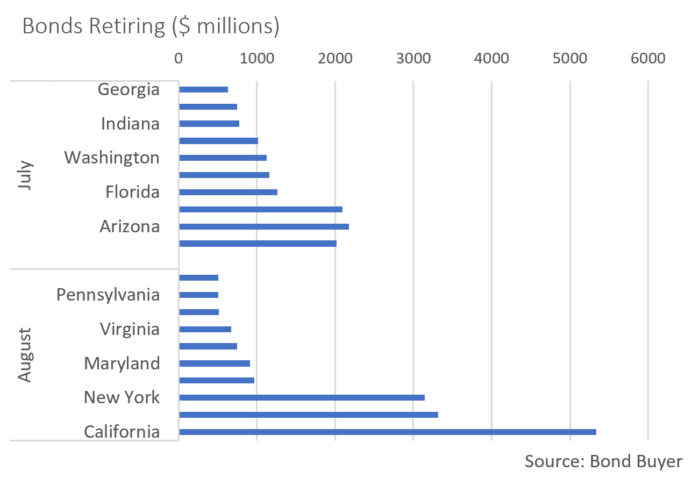
- Despite record YTD net fund outflows of ~$76 billion, we anticipate favorable municipal market technicals. June recorded significant net negative supply as $64 billion matured with only $17 billion issued in the primary market. June through August are historically the strongest months for reinvested cash and 2022 is likely to see $385 billion of principal and interest being returned to bondholders according to Wall Street estimates, an increase from $359 billion in 2021. Over the second half, about $233 billion of supply will be needed to offset debt service rolling off, a level we feel is unlikely to be reached, thereby fortifying net demand.
- Market liquidity remains tight as dealers are not holding high levels of inventory and supply is limited. Given the significant amount of cash that will need to be invested, bids should be strong. We anticipate sellers may be tempted to put more bonds out to bid as prices firm up over the summer months.
Corporate Bond Markets
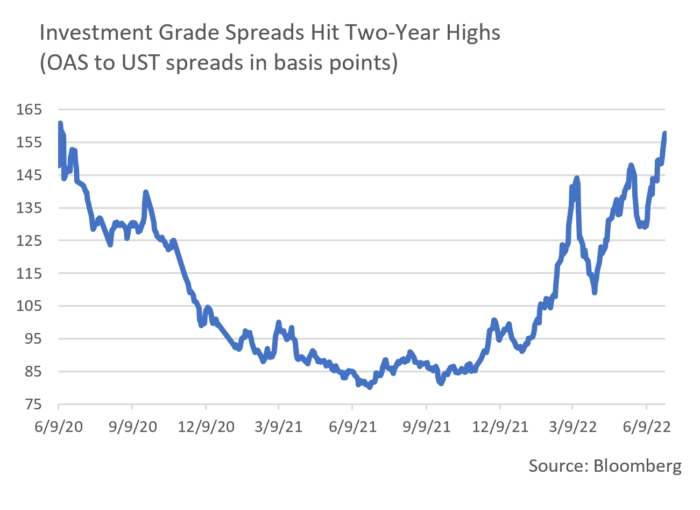
- Investment Grade credit spreads reached YTD highs in June as markets grappled with recession fears. This past month marked the third time this year there has been a four week stretch of spread widening. The OAS on the Bloomberg Barclays Corporate Bond Index closed at 155 basis points, a level not reached since June 2020. Additional spread widening is a risk given inflationary pressures and the possibility of recession, although we see favorable technical factors as a source of support.
- Market technicals remain a much bigger influence on spread direction than credit fundamentals. The new issuance market was slow in June, as only $69 billion came to market vs. expectations of $90 billion. Issuers are waiting in the wings as concessions remain elevated and risk-off sentiment has created an environment conducive to caution. It is rumored that several large deals remain “in the works” or “delayed” but nothing has come to fruition. On a YTD basis, IG supply is down 9% from 2021 ($716 billion vs. $787 billion). July is a very important month for earnings and a time in which blackouts take hold. Our view is that supply will most likely remain muted as issuers cautiously pick their points of entry.
- Weakness in retail fund flows has put further pressure on spreads with $22.74 billion of IG Corporate net outflows recorded in June and $68.3 billion YTD. Investor sentiment remains guarded.
- As part of a monetary tightening regimen, the Federal Reserve ceased reinvesting maturing USTs (up to a cap of $30 billion) and MBS (to $17.5 billion) each month. The pace in each asset class will double beginning in September, pulling demand out of the market. The Fed’s holdings of USTs fell below $3 trillion in June, the lowest level since November 2020. A partial offsetting factor lies in the Treasury slowing its borrowing needs.
- Overall, we see Fed policy normalization as necessary and appropriate, although it could put some pressure on USTs and MBS. Nonetheless, June was marked by a decline in UST yields, as the curve fell by about 12 basis points on weak disposable income and consumption data at month end.
Public Sector Watch
Credit Comments
State & Local Government Outlook Update
- Appleton updated our 2022 sector outlooks in January, assigning a “Positive” outlook to both the State and Local Government sectors. This outlook largely reflected windfall tax revenues, significant federal funding, and prudent budgeting practices. While our short-term outlook remains positive, we are cognizant of challenges that lie ahead given persistently high inflationary pressures and weakened consumer sentiment.
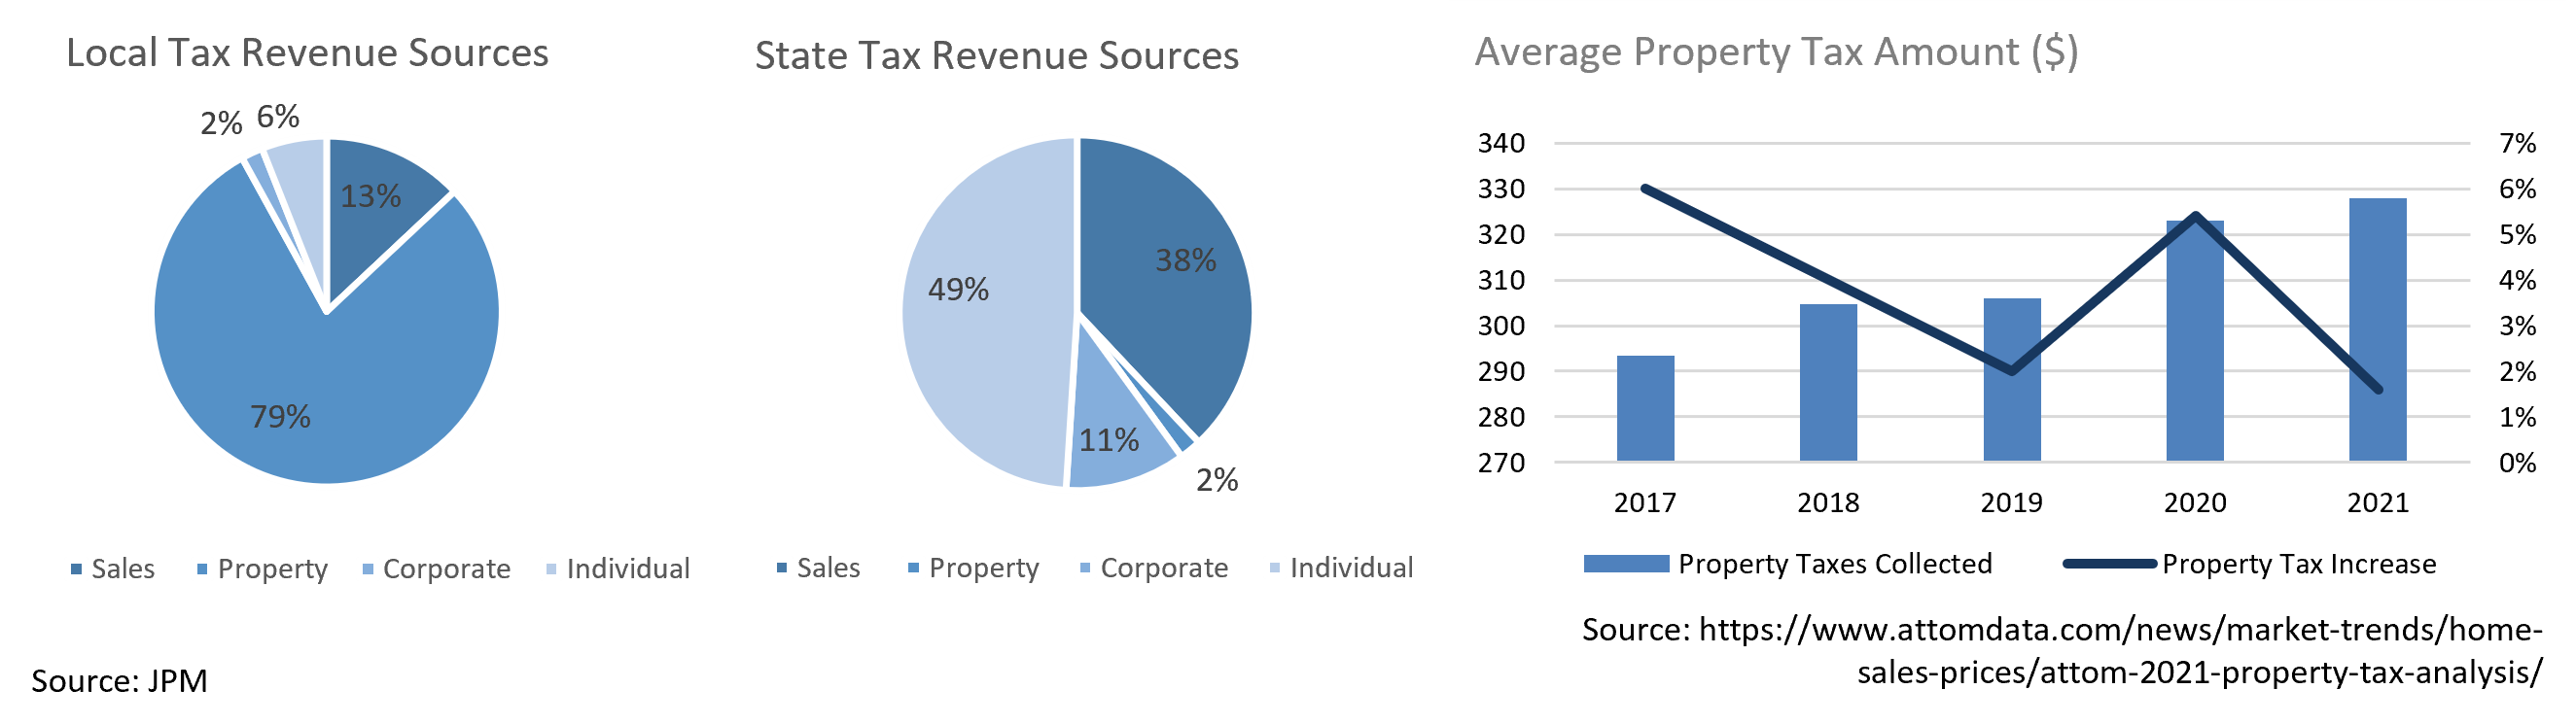
- State and Local Governments rely on a variety of taxes to fund operations including sales, property, individual income, and corporate taxes. These sources are subject to fluctuations relating to economic factors and revenue volatility differs significantly.
- Property taxes incur relatively mild revenue fluctuations and volatility typically arises 18-24 months after economic downturns. Sales, corporate and individual taxes tend to experience greater declines concurrent with downturns but recover at a much more rapid pace. These revenue distinctions are important when assessing state and local bond issues.
State Governments:
- States derive a large portion of revenue from sales and personal income taxes. Such revenues have performed well throughout 2021 and continued to experience sizeable growth at the beginning of 2022. Q1 general sales taxes increased 18.5%, while individual income rose by 18.7%.
- Nonetheless, in April more than half of states saw tax collections fall for the first time since the summer of 2021 and another sixteen reported slower growth compared to the year prior. This suggests consumer spending is slowing and that tax revenue may come in below some states’ projections, a development that could create budget implications.
- Inflation has also impacted states through increased expenses. Current estimates anticipate state general fund spending will exceed $1 trillion in FY22, a 13.6% increase from FY21. This is the largest YoY increase since FY81, and nearly half is the direct result of inflation
- While the long-term economic impact of inflation remains unclear, many states have very healthy reserves to fall back on. State FY22 budgets are projecting average rainy-day fund balances equal to 11.6% of expenditures, a cushion that has reached new highs.
- Formidable reserves are a major factor supporting our positive 2022 outlook. However, the impact of inflation on expenses and the ability of states to adapt and prudently manage their budgets is a significant consideration when evaluating issuer specific credit fundamentals.
Local Governments:
- Local governments are similarly impacted by sales and individual tax returns, although a larger portion of revenue is derived from property taxes.
- As mentioned, property tax revenue volatility typically lags economic downturns by about two years. ATTOM, a provider of real estate records and property data, reported that the average tax on US single-family homes increased by 1.6% in FY21, while home prices were skyrocketing, up 16% YoY. This suggests that tax assessments are lagging rising property values and will likely result in increased 2022 property tax revenue.
- Reserve balance strength is backed by tax revenue growth and pandemic funding which many entities have yet to fully spend, thereby fortifying most local issuers ahead of potentially weaker economic times.
- Varying tax revenue structures influence how economic downturns are likely to affect revenue, as well as the potential timing of such impact. The nature of these distinctions is integral to evaluating an issuers’ ability to handle more difficult times.
- State and Local government management of the budgeting process is also an important variable. While today’s cash influx affords issuers significant reserve flexibility, imprudent financial management would likely change our credit outlook.
Strategy Overview
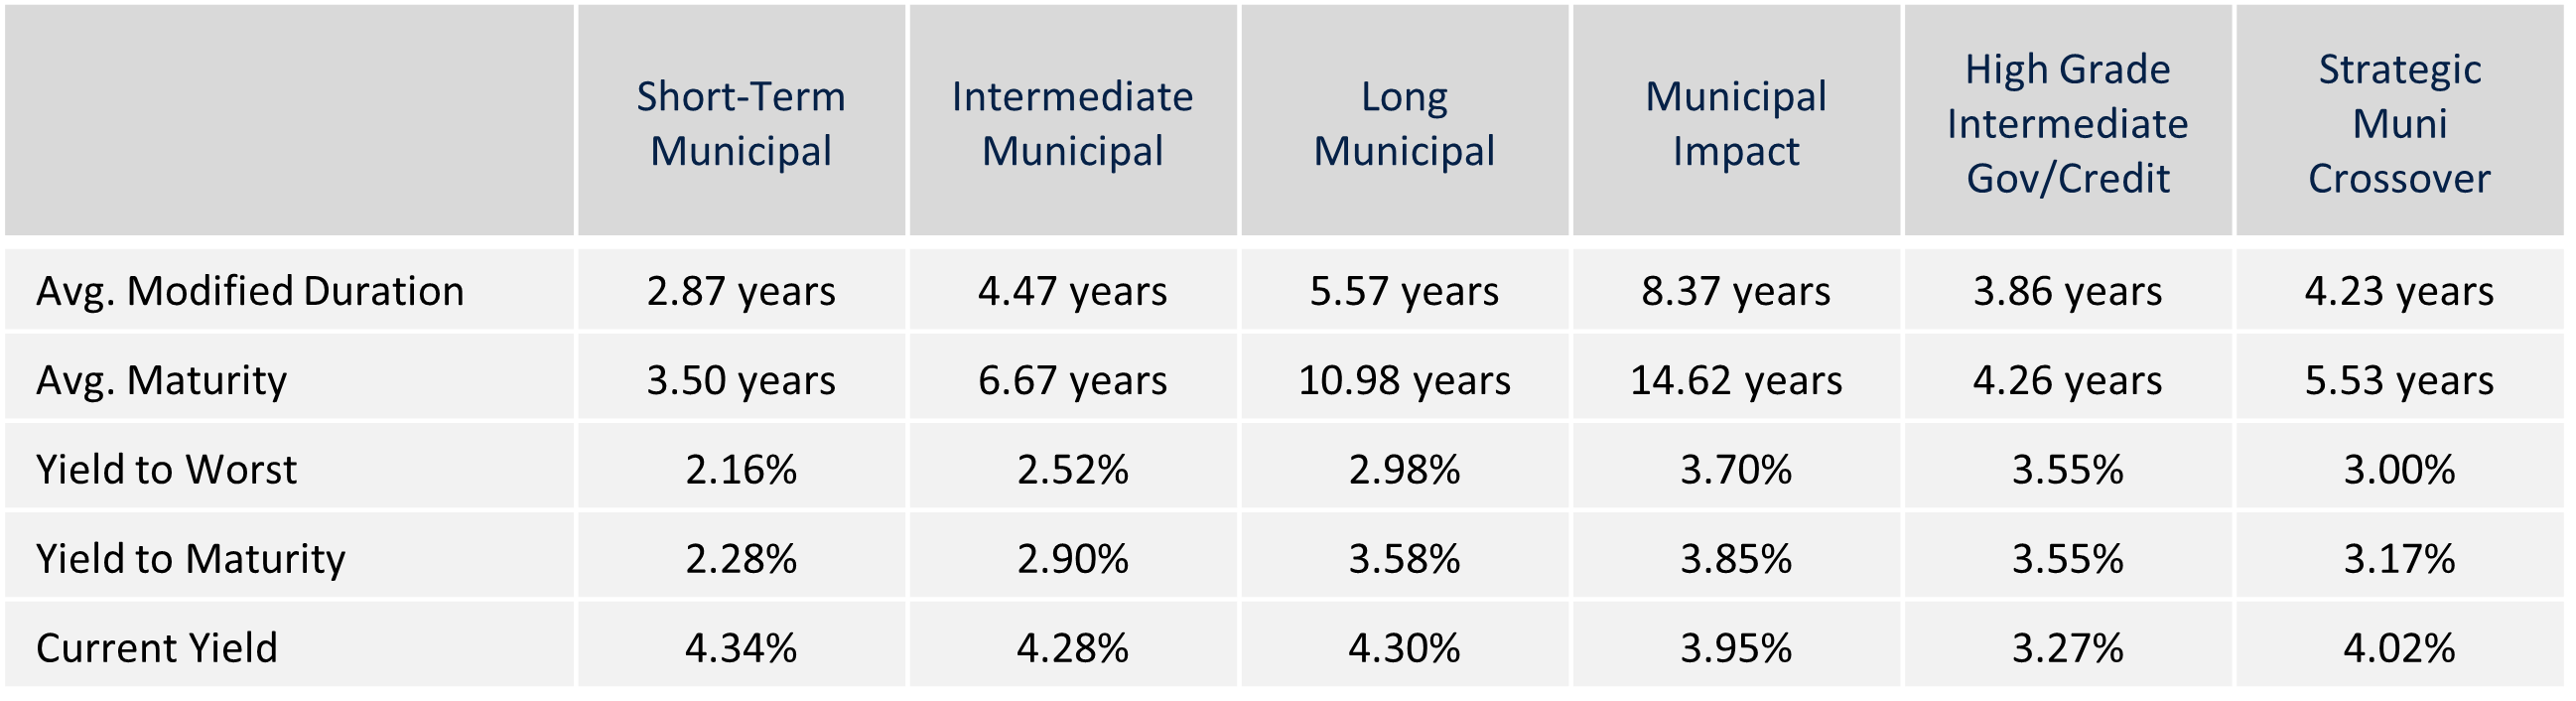
Composite Portfolio Positioning as of 6/30/2022
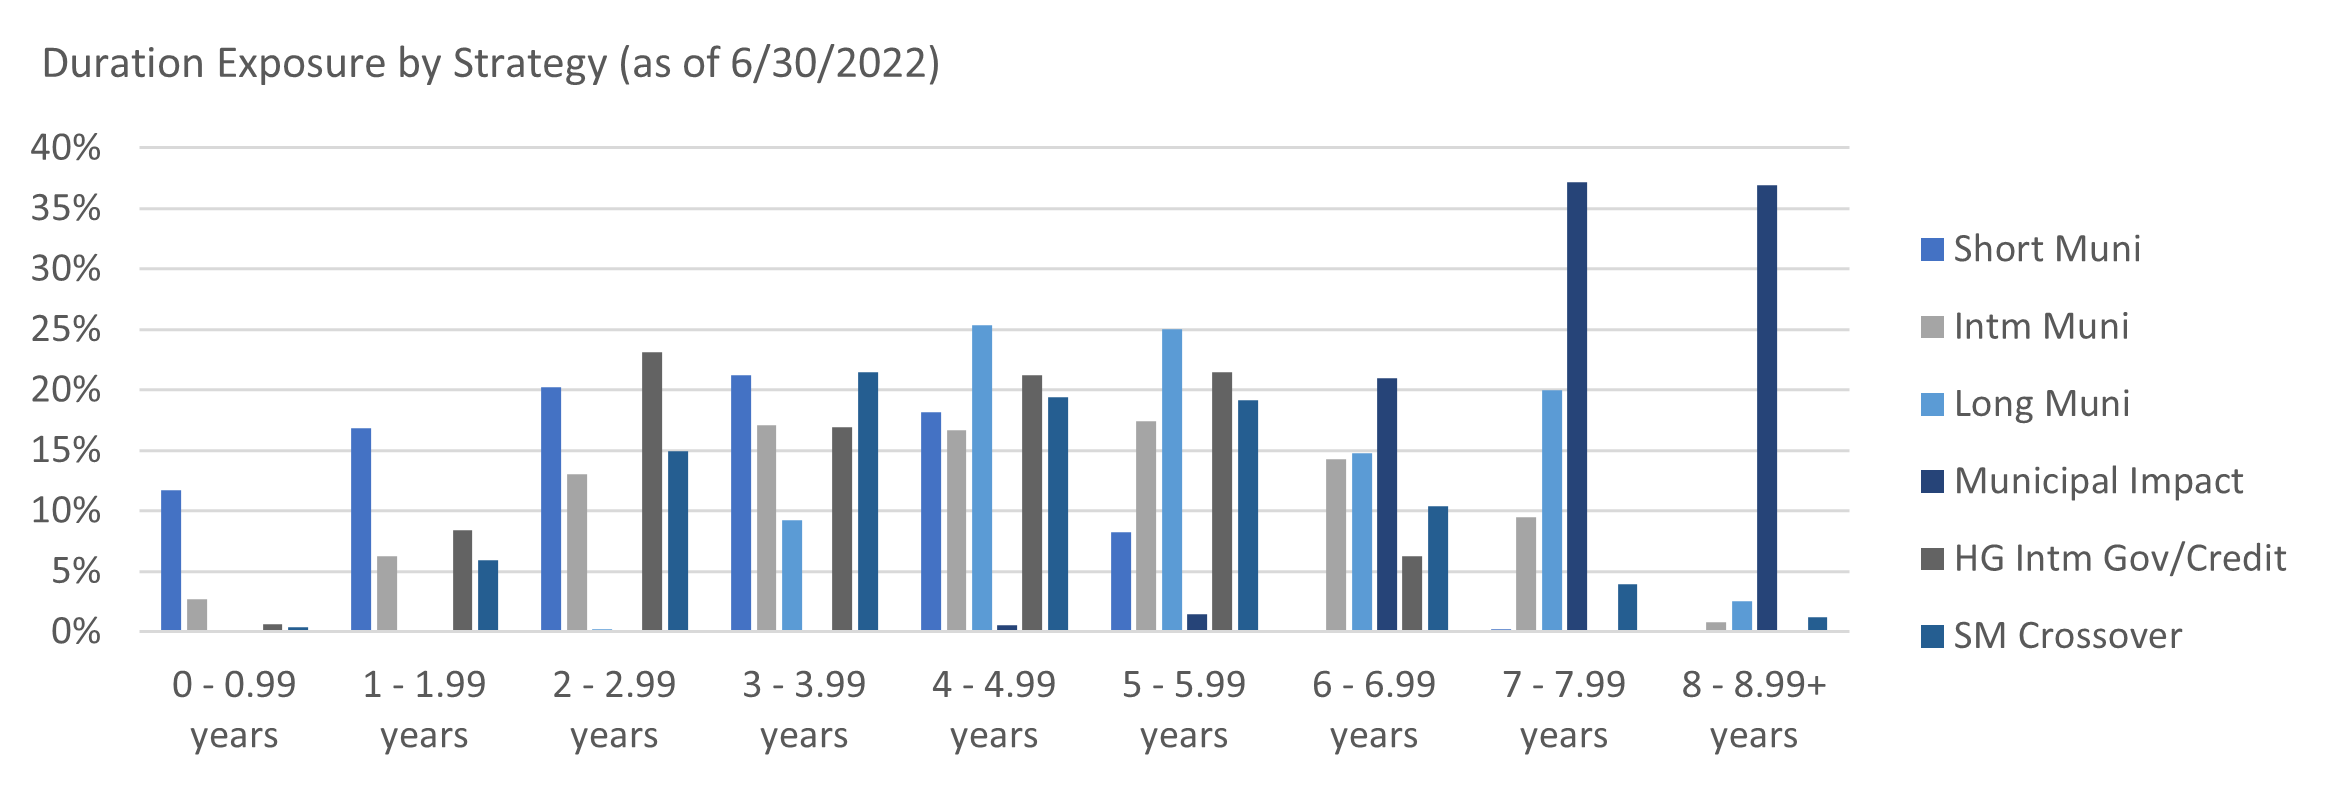
Duration Exposure by Strategy as of 6/30/2022
Our Philosophy and Process
- Our objective is to preserve and grow your clients’ capital in a tax efficient manner.
- Dynamic active management and an emphasis on liquidity affords us the flexibility to react to changes in the credit, interest rate and yield curve environments.
- Dissecting the yield curve to target maturity exposure can help us capture value and capitalize on market inefficiencies as rate cycles change.
- Customized separate accounts are structured to meet your clients’ evolving tax, liquidity, risk tolerance and other unique needs.
- Intense credit research is applied within the liquid, high investment grade universe.
- Extensive fundamental, technical and economic analysis is utilized in making investment decisions.