


Insights & Observations
Economic, Public Policy, and Fed Developments
- April may have indeed been the cruelest month for rate sensitive investors, as a third consecutive strong CPI print sent Treasury yields soaring early in the month. The print wasn’t quite as bad as the market reaction indicated; at full precision, headline CPI at +0.378% and core at +0.359% were within 0.03% and 0.02%, respectively, from rounding to an in-line +0.3%. Still, after two months of higher-than-expected readings, a skittish market was primed for a sharp reaction; rates jumped more than 20bps on the news and remained elevated through month-end.
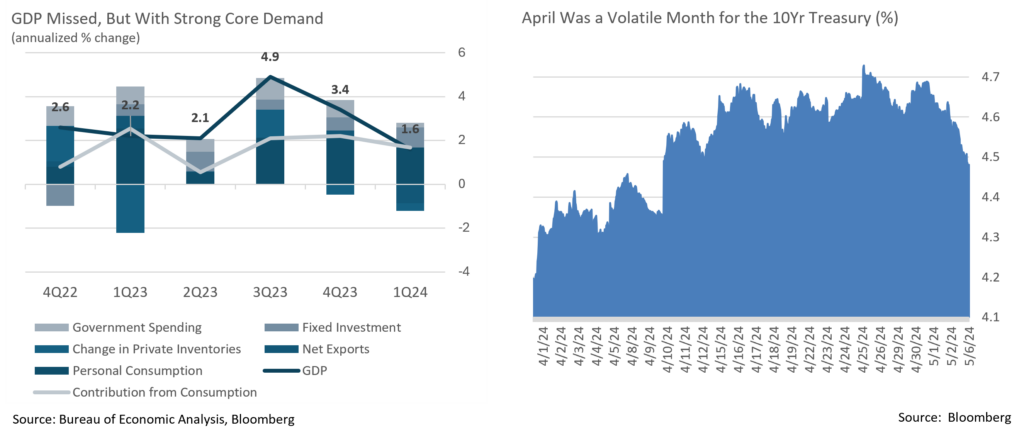
- It ended up being a month for nuanced data releases. The Q1 initial GDP report released later in the month fed investor fears of stagflation. We disagree; while the headline miss was sizeable, with a print of +1.6% vs. a consensus +2.5%, weakness was primarily due to sizable detractions from the net trade deficit (a detraction of 0.86 percentage points) and from a drawdown of inventories (a further -0.35%, and we’d note inventory replenishment should now contribute to Q2 strength). Both final sales to domestic purchasers (+2.8%) and to private domestic purchasers (+3.1%) suggested significantly stronger aggregate demand than the headline number, and do not imply stagnant growth.
- The GDP price index included in the GDP report was a source of confusion, as well, surprising sharply to the upside. It’s important to remember this is a quarterly number and therefore backwards looking, and it wasn’t news to the market that inflation had been hot in the first quarter. The release of the Fed’s preferred PCE deflator (a related measure) the next day provided some validation here, and indicated the upside surprise was due to upwards revisions in January, a month we already know to have been impacted by seasonal issues. Rather than a source of new information, this was further confirmation of what we already knew, but it continued to spook a jittery market.
- Against this backdrop, Fed Chair Jerome Powell pushed back on growing fears that the Fed’s next rate move would be up and not down in his press conference on May 1st. Powell came across unexpectedly dovish, although largely by comparison to a market that had itself become very hawkish; the Fed’s “higher for longer” messaging has been remarkably consistent over the last several months. A slate of hot inflation prints has affirmed the Fed’s decision not to rush into rate cuts, while the April employment report released on May 3rd validated the Fed’s unwillingness to walk back plans for rate cuts before year-end, either. For all the market’s talk of “Fed pivots,” we see the market and not the Fed having repeatedly pivoted in 2024.
- The labor report bookended a volatile rate month by pulling yields a fair ways back towards where they started. The report wasn’t weak, exactly; 175,000 new jobs in a normal month would be a solid report, and the unemployment rate at 3.9% is still low by historical norms. However, it was a sizable miss from expectations for 240k, the first such miss in some time. Coupled with a below expectation (but very normal) wage growth figure and continued slow decline in the JOLTS job openings report, it suggests a tight labor market is making progress towards normalization. Markets greeted the report by recalibrating rate cut expectations back towards the two cuts before year-end that was our base case coming into the year.
From the Trading Desk
Municipal Markets
- Over the course of April 2-year AAA yields moved higher by 25bps and 10-years by 30bps, enhancing an attractive tax-exempt yield environment. Municipals subsequently rallied to begin May after a weaker than expected Nonfarm Payrolls report although yields remain in the high end of this year’s range.
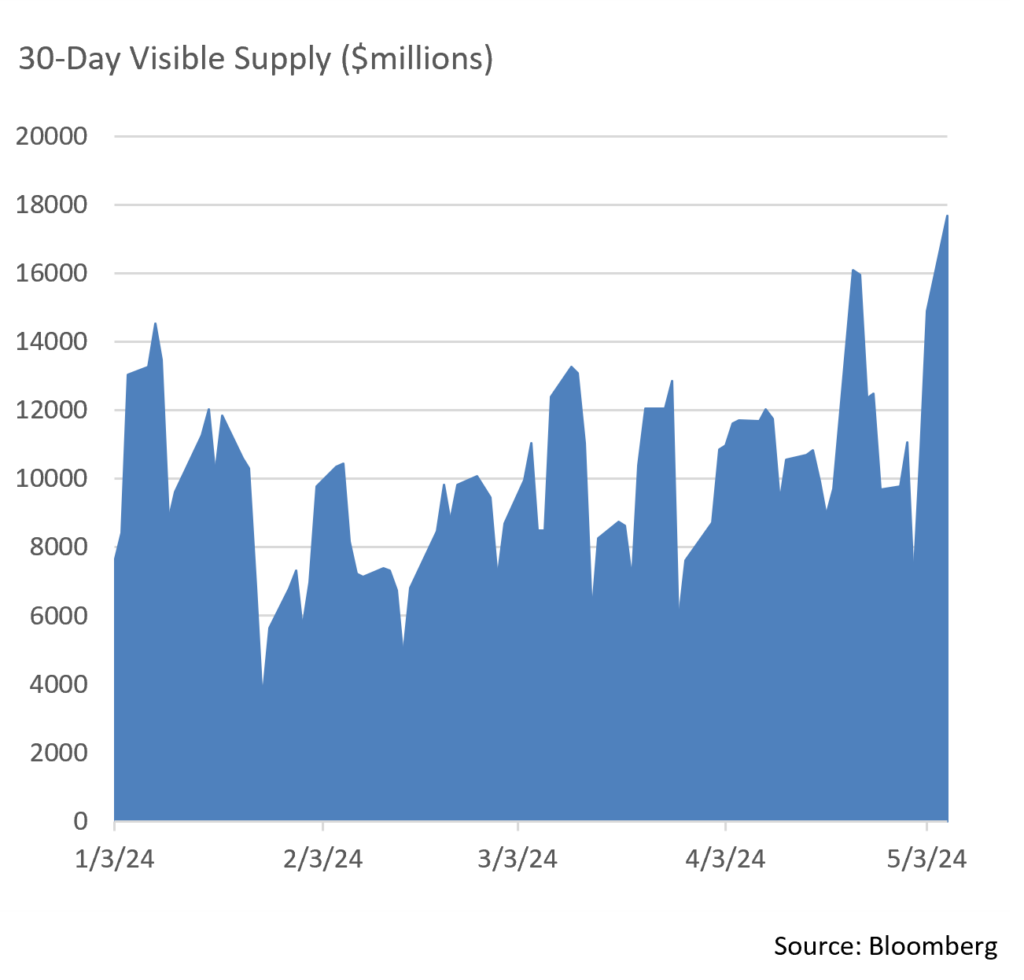
- April issuance totaled $46.35 billion according to Bloomberg, the highest issuance for that month since 2008. Increased new offering volume appears to be continuing as 30-day visible supply has now reached $17.6 billion, a high for the year, and YTD issuance is up about 30%.
- We welcome this new supply, particularly as the market approaches a period of net negative issuance. Seasonality has long impacted net municipal issuance and May through August has historically been a time when bond calls and maturities coming due exceed the availability of new issuance.
- Ratios in the 10-year portion of the curve moved slightly above 60%, a level that has been difficult to break this year. Since the start of the year, the 10-year AAA/UST ratio has crept above 60% just a handful of times. We expect ratios to remain tight, especially given the approaching period of net negative issuance which is very favorable for technicals and could drive municipal yields down.
Corporate Markets
- US Treasury rate volatility was evident in April as market participants navigated mixed economic releases and expectations for a Fed Funds rate cut. The benchmark 10Yr UST began the month at 4.31% before jumping 39bps to a YTD high of 4.70% on April 25th in the aftermath of a +3.7% Core PCE price report. This exceeded expectations of +3.4% and led investors to believe that Fed rate cuts were being pushed further out on the horizon.
- This rate move was eerily similar to an early February spike when non-farm payroll data sharply exceeded anticipated levels. We anticipate continued pockets of volatility in a market fixated on each indication of economic growth, inflation, and Fed policy implications, although from these levels we see considerable market value.
- The Investment Grade credit markets remain resilient with OAS on the Bloomberg US Corporate Bond Index reaching a YoY low of 87bps on April 10th only to back up 6bps by mid-month. As has often been the case of late, spreads soon rallied back towards lows as investor reaction to the Core PCE number was not as magnified as in the Treasury markets. Excess returns in credit were marginally flat to slightly positive on the month, and we feel a significant breakout in IG credits spreads in the near future is unlikely given the desire of investors to lock in yields.
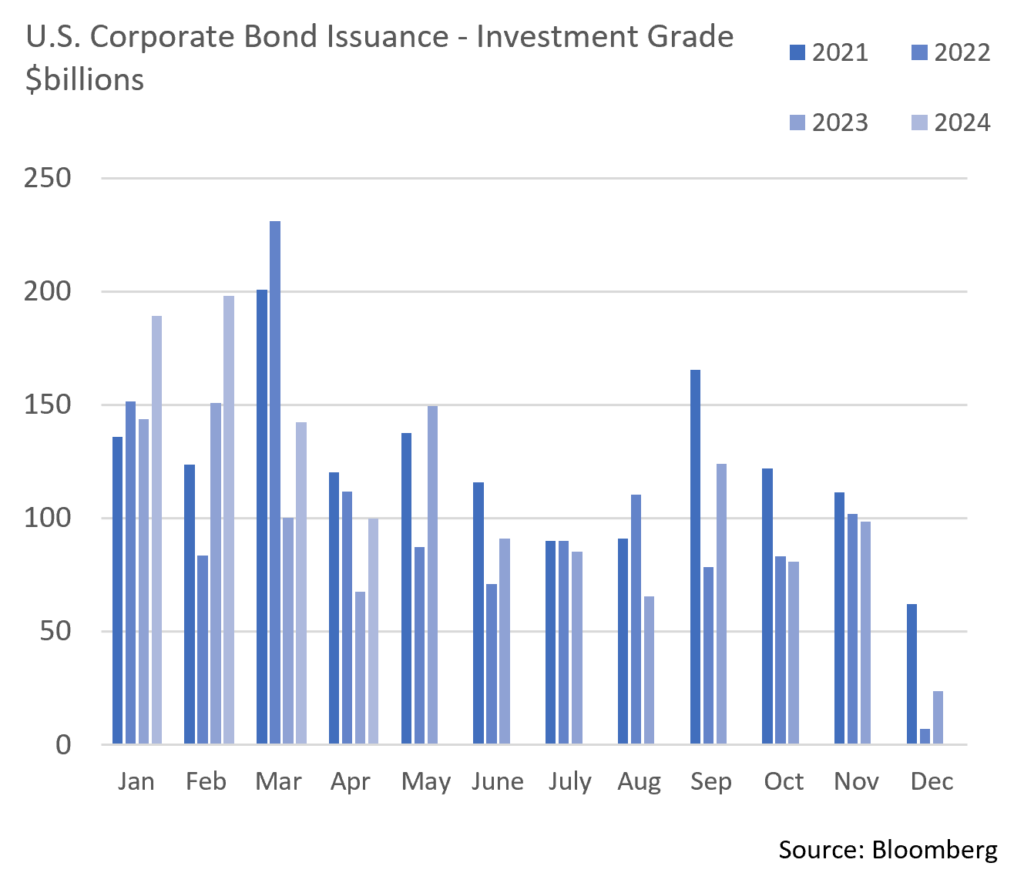
- New issuance remains healthy although there have been intermittent signs of buyer fatigue. A robust volume of new offerings during Q1 spilled over into April before cooling to $102 billion on the month. This included a jumbo-sized deal brought by Boeing, a recently downgraded issuer. In another sign of investor appetite for credit, this high-profile deal was nearly 8x oversubscribed and concessions of 3bps were quite nominal. Spreads also tightened 35 to 40bps across the maturity tranches and the bonds traded very well in the secondary market.
Public Sector Watch
EPA Finalizes PFAS Regulations
- The EPA established the first national limits on harmful PFAS (referred to as “forever chemicals”) in drinking water effective April 10th. This regulation requires every US municipal water system to test for and limit the presence of five PFAS chemicals.
- The two most common PFAS chemicals – PFOA and PFOS – will be limited to four parts per trillion with a goal of zero. Three other PFAS chemicals will have a limit of 10 parts per trillion.
- PFAS chemicals are linked to serious health problems and the EPA anticipates that this action will prevent thousands of deaths and greatly reduce health problems. However, it will also raise compliance costs for municipal and investor-owned water utilities, a financial challenge not to be overlooked.
- Public water systems will have three years to complete initial monitoring for these chemicals and to inform the public of their findings. Subsequently, systems must lower the levels of PFAS to comply with the regulatory standard within five years. Eleven states already maintain some form of PFAS regulation, including much of the Northeast, better positioning utilities in those states to manage the new EPA regulations.
- The EPA estimates that only 6% – 10% of all water utilities will require treatment for PFAS and forecasts the new rule will cost a total of $1.5 billion annually in capital and operating costs over the next 20 years. Other entities such as The American Waterworks Association are projecting treatment expenses upwards of $3 billion annually. Nearly $1 billion in new funding will be available through the Bipartisan Infrastructure Law to help states and territories implement PFAS testing and treatment at public water systems.
- These new PFAS regulation come on the heels of another EPA mandate that would require utilities to replace any lead service lines, which could add further expenses.
- We expect treatment solutions to be financially manageable for most water and sewer systems given the sector’s ample cash balances and relatively low debt burdens. Our main concerns lies with smaller utility systems, those operating in economically disadvantaged markets, and systems with aged infrastructure. Treatment costs will vary significantly depending on size and the state of existing infrastructure, but most will incur at least several million dollars in initial capital costs. In most cases, costs will be pushed to consumers.
- Our research process favors systems that service a large and healthy customer base, maintain adequate and diverse portfolios for supply and treatment, and utilize an independent rate-setting authority that offers greater revenue flexibility. We feel systems with these characteristics will generally be well equipped to make the necessary adjustments.
EPA Finalizes PFAS Regulations
- S&P announced that 91 US local governments and utility systems have had their ratings withdrawn, reflecting an inability on S&P’s part to obtain adequate and timely financial information. S&P reported that rating actions due to lack of timely information have climbed from 76 in 2018 to 186 in 2024.
- Several factors appear to be at work, including personnel shortages at auditing firms, turnover in auditors, as well as lack of municipal financial staff.
- Given the size and sophistication of the issuers we invest in, we are not immune to this issue, but we believe are relatively well protected and remain vigilant regarding these concerns. Larger issuers tend to have greater financial and management resources, increasing the likelihood that the depth, frequency and quality of their financial disclosures will exceed that of smaller bond issuers. Our analysts typically align our annual credit review process with the timing of issuer financial information to allow us to more easily monitor the timeliness of disclosure. In general, well-established entities with seasoned management teams are better positioned to address challenges of this nature.
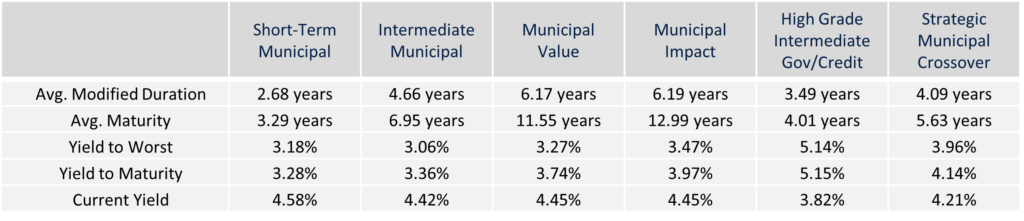
Composite Portfolio Positioning (As of 4/30/24)
Strategy Overview
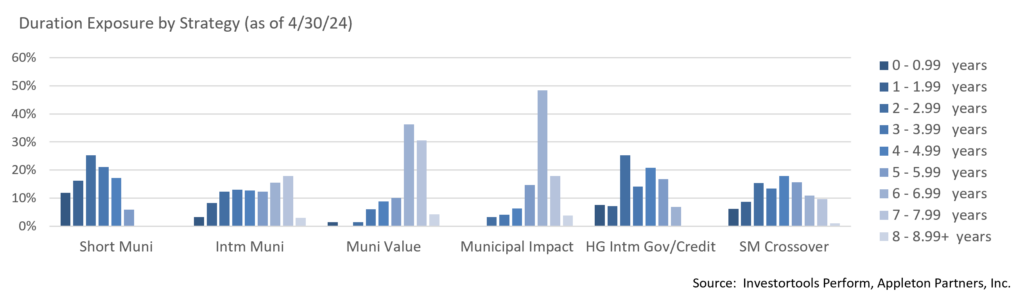
Duration Exposure (as of 4/30/24)
The composites used to calculate strategy characteristics (“Characteristic Composites”) are subsets of the account groups used to calculate strategy performance (“Performance Composites”). Characteristic Composites excludes any account in the Performance Composite where cash exceeds 10% of the portfolio. Therefore, Characteristic Composites can be a smaller subset of accounts than Performance Composites. Inclusion of the additional accounts in the Characteristic Composites would likely alter the characteristics displayed above by the excess cash. Please contact us if you would like to see characteristics of Appleton’s Performance Composites.
Yield is a moment-in-time statistical metric for fixed income securities that helps investors determine the value of a security, portfolio or composite. YTW and YTM assume that the investor holds the bond to its call date or maturity. YTW and YTM are two of many factors that ultimately determine the rate of return of a bond or portfolio. Other factors include re-investment rate, whether the bond is held to maturity and whether the entity actually makes the coupon payments. Current Yield strictly measures a bond or portfolio’s cash flows and has no bearing on performance.
Our Philosophy and Process
- Our objective is to preserve and grow your clients’ capital in a tax efficient manner.
- Dynamic active management and an emphasis on liquidity affords us the flexibility to react to changes in the credit, interest rate and yield curve environments.
- Dissecting the yield curve to target maturity exposure can help us capture value and capitalize on market inefficiencies as rate cycles change.
- Customized separate accounts are structured to meet your clients’ evolving tax, liquidity, risk tolerance and other unique needs.
- Intense credit research is applied within the liquid, high investment grade universe.
- Extensive fundamental, technical and economic analysis is utilized in making investment decisions.
This commentary reflects the opinions of Appleton Partners based on information that we believe to be reliable. It is intended for informational purposes only, and not to suggest any specific performance or results, nor should it be considered investment, financial, tax or other professional advice. It is not an offer or solicitation. Views regarding the economy, securities markets or other specialized areas, like all predictors of future events, cannot be guaranteed to be accurate and may result in economic loss to the investor. While the Adviser believes the outside data sources cited to be credible, it has not independently verified the correctness of any of their inputs or calculations and, therefore, does not warranty the accuracy of any third-party sources or information. Any securities identified were selected for illustrative purposes only, as a vehicle for demonstrating investment analysis and decision making. Investment process, strategies, philosophies, allocations, performance composition, target characteristics and other parameters are current as of the date indicated and are subject to change without prior notice. Not all products listed are available on every platform and certain strategies may not be available to all investors. Financial professionals should contact their home offices. Registration with the SEC should not be construed as an endorsement or an indicator of investment skill acumen or experience. Investments and insurance products are not FDIC or any other government agency insured, are not bank guaranteed, and may lose value.