


Insights and Observations
Economic, Public Policy, and Fed Developments
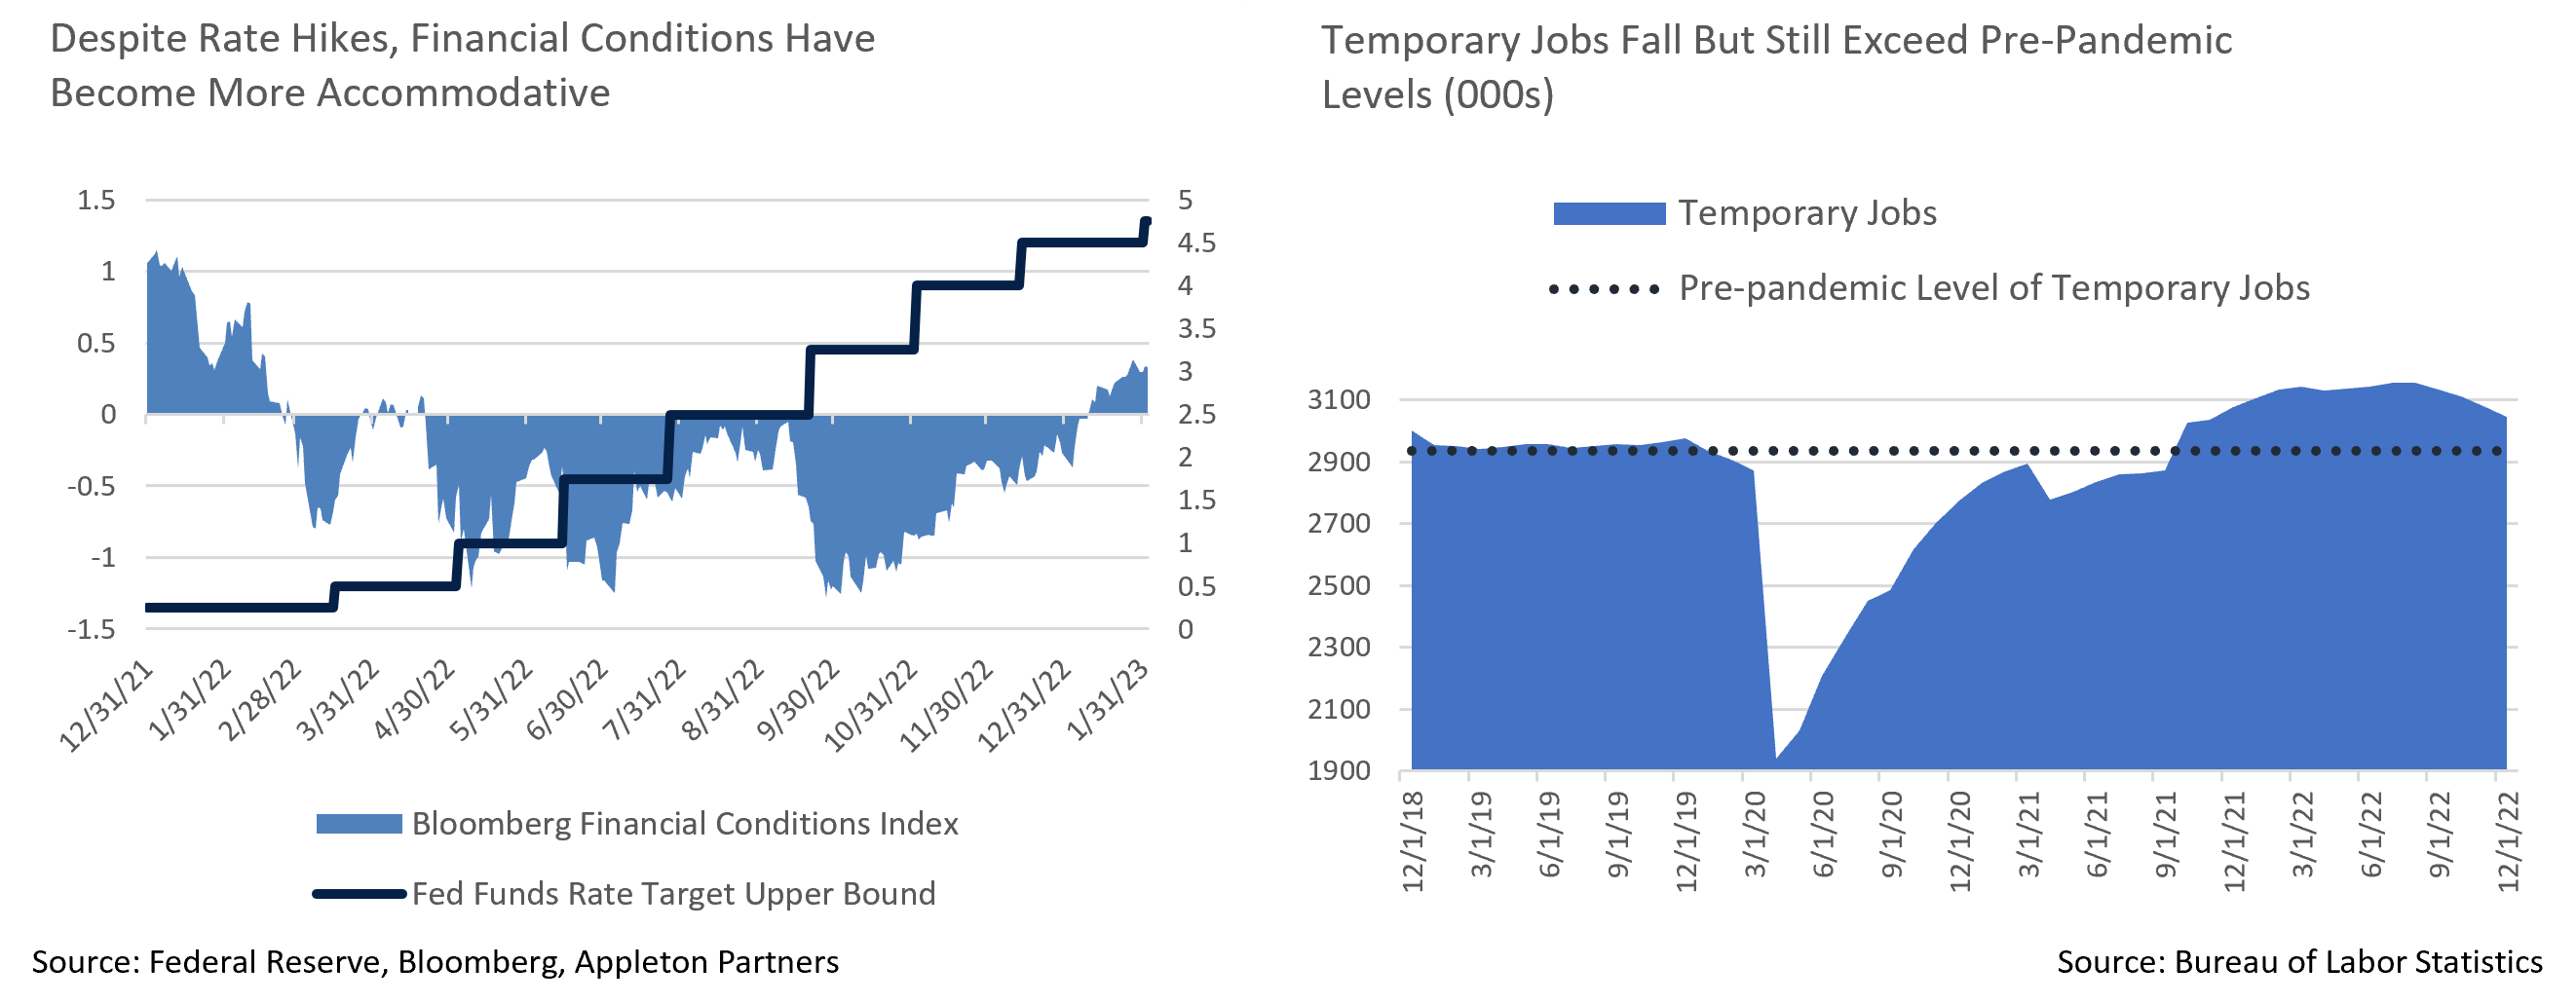
- The standout moment of the Federal Reserve press conference on February 1st was when Chairman Powell was given an opportunity to pivot and push back against market faith but chose not to. This was a surprise, since a recent theme in Fed communications has been how easing market conditions was complicating their campaign against inflation. Powell instead focused on cumulative tightening since the start of the hiking cycle, rather than financial conditions now being looser than at any time since February of 2021 and market-based measures suggesting they are now outright accommodative. Markets surged in response.
- While this made for a far more dovish press conference than anticipated, there was still plenty for the hawks. The FOMC statement’s reference to “ongoing increases,” plural, rather than the one hike the market is still pricing in caused an initial jolt. And while noting the disinflationary process had begun, Powell stressed transitory factors have driven much of the improvement. The Fed remains focused on core services ex-housing, a component representing 56% of the core PCE index that has been running at a too hot 4% annual rate. The most plausible explanation we see for this dichotomy is that Powell sees the Fed hiking to 5-5.25% based on a belief that recent progress in inflation will stall and settle at the core ex-housing rate. Since the market will have to come around to this view one way or another, Powell appears to be letting it do so at its own pace.
- Elsewhere, markets continue to wrestle with the divergence between consumption data and employment data, and what this suggests about inflation and growth. Consumer data from December ranged between weak and abysmal. We caution that retail sales and durable goods orders tilt heavily towards goods spending, and there has been ample evidence of a shift from goods to services for some time. The Personal Consumption Expenditures release was much more nuanced, revealing a slide in goods purchases but flat real services spending (and solid growth in nominal terms), suggesting a slowdown, not a collapse.
- If consumer spending is slowing, it is not because of difficulty finding work. January’s blowout report of 517k new jobs nearly tripled the consensus and pulled the unemployment rate down to a 54-year low. Coupled with 71k in prior upwards revisions, this suggests labor demand is still white hot. The JOLTS job opening report also spiked in January, sending the ratio of openings-to-unemployed back near its peak. The only potential sign of weakness is a fall in temporary employment, but this seems more likely to be evidence of workers using a tight labor market to negotiate permanent roles rather than a decline in hiring.
- The Q4 GDP report first estimate painted a mixed picture; the headline was surprisingly strong at +2.9%, although half this growth was attributable to inventory buildup, effectively borrowing growth from future periods. Final sales to domestic purchasers (GDP ex-inventories and trade) slowed to +0.8%, and to private domestic purchasers (further removing government spending) to +0.2%, both sharply lower than prior quarters. While we are less than halfway through Q1, Atlanta Fed’s GDPNow quarterly growth estimate currently stands at +0.7%; growth is very likely to slow from where it was at year-end.
- Another risk lies with China’s abandonment of “Zero Covid” containment policies. While welcome on the growth front, commodity prices have jumped in response to a resumption of Chinese demand, and in time these increases could also begin to flow through US data, hindering the Fed’s quest to stifle inflation.
Equity News and Notes
A Look at the Markets
- Stocks were higher in January as the S&P 500 rose +6.2%. Reversing last year’s pattern, the Nasdaq Composite soared +10.7%, while the DJIA lagged, gaining only +2.8%. Nasdaq, which declined by -30% in 2022, posted its best start to a new year in 20 years. All but 3 of 11 sectors were positive led by Consumer Discretionary and Communication Services. Sticking with the rotation theme, the three sectors in the red (Utilities, Health Care, and Consumer Staples) are all considered defensive in nature and had been among the best performers in 2022’s difficult environment.
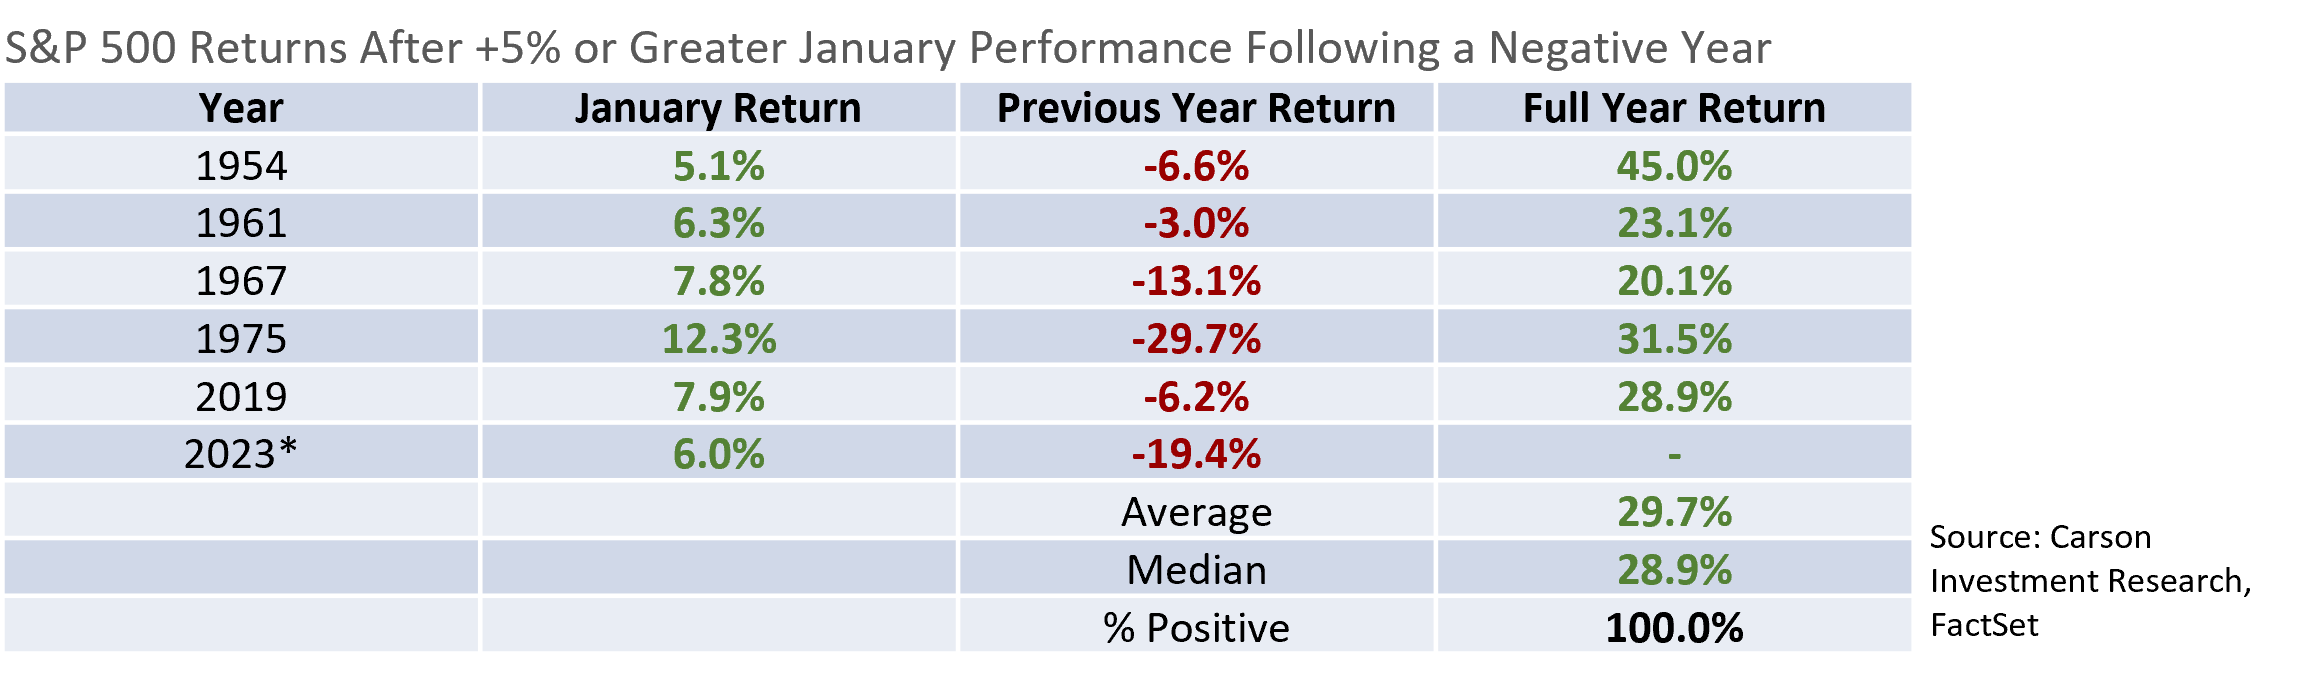
- Those familiar with the Stock Traders Almanac might follow the January Barometer, a market indicator dating back to 1972 that states “so goes January, goes the year.” The data over that period reveals that when stocks close higher in January the remainder of the year has been positive 86% of the time with an average return of +11.9%. Taking it a step further, there have only been five prior occasions when the market has posted gains of +5% or more in January following a negative year, circumstances that historically produced an average gain of nearly +30%. While we do not expect a return of that magnitude, history offers reason to be optimistic about 2023.
- With the S&P 500 up over 14% off its October 12th low, today’s debate centers around whether this represents a true inflection higher, or simply another bear-market rally. Improving sentiment and growing hopes for a soft landing have been supportive, as have technicals and market breadth. From a technical standpoint, the S&P 500 has broken above a trend line of lower highs, captured its all-important 200-day moving average, and now trades through the prior high established in late November.
- Market breadth has also been improving as small caps, developed international, and emerging markets have all recently outperformed the S&P 500. More than 75% of the S&P 500 also now trades above its respective 50-day moving average, another bullish indicator. Lastly, significant recent outperformance of high-beta stocks relative to low-volatility stocks offers a sign that the market may be moving into a “risk-on” environment.
- Despite the optimistic tone struck in January, several familiar risks remain. Inflation is trending lower but has yet to decline to a level that gives the Federal Reserve confidence that their job tightening monetary policy is done. Despite a strong labor market, a resilient consumer, and sustained corporate capital expenditures, the economy is also slowing from a robust post-Covid trendline. Geopolitical tensions persist, while domestic politics have reared their ugly head with the debt ceiling in the spotlight. We expect the debt ceiling to ultimately be raised, although the process is likely to be unsettling to investors.
- We are also carefully monitoring corporate earnings with economic slowdown presenting a stiff test. As we publish this commentary, half of the S&P 500 have reported Q4 earnings and results have been lackluster. Only 70% of companies have beaten EPS estimates and 61% have beaten revenue expectations, both below average. The extent to which companies have beaten earnings estimates is also subpar at +0.6%. Fewer companies beating by a smaller margin has led to a -5.3% blended average earnings growth rate, down from -3.2% at year-end. In the face of these results, market reaction has been better than many anticipated though, an indication that investors may have lowered expectations. Projected 2023 earnings growth has fallen to +3.0%, a figure we expect to grind lower over coming weeks.
- While weaker earnings growth is a concern, earnings only represent half the equation. How much investors are willing to pay for those earnings will go a long way to determining the direction of stock prices. More favorable inflation expectations have helped market valuations rebound to a P/E ratio of roughly 18.4x, a level that is neither cheap nor particularly expensive. A deeper than expected recession would drag earnings and valuations lower, although confirmation of a shallow recession (or none at all) could bolster valuations and buoy the market. We are in the latter camp, albeit with tempered expectations.
Indices are not available for direct investment. The S&P 500’s performance does not reflect the expenses associated with the management of an actual portfolio. The index is shown for comparative purposes only. Clients should be aware that the S&P 500 index may have a different security composition, volatility, risk, investment objective and philosophy, diversification, and/or other investment-related factors than the client’s individual portfolio. Additionally, the referenced index does not include fees, transaction costs or reinvestment of income. Therefore, investor’s individual results may vary significantly from the index’s performance.
From the Trading Desk
Municipal Markets
- Municipal bonds enjoyed the best January performance in over 10 years, with the Bloomberg Barclays Managed Money Intermediate Index returning +2.79%, a stark contrast from a year ago when January returns declined -2.74%. Sentiment is improving accordingly, as the last week of the month saw positive net fund flows of $1.3 billion after -$127 billion of net outflows over the preceding 53 weeks.
- Prices have been bolstered by a very limited volume of new offerings, with 30-day visible supply beginning February under $3 billion. Redemptions and maturities of $37 billion should be coming back to investors this month adding significant fuel to an already strong buy side.
- A light calendar has limited buying flexibility and shorter maturities are trading at relatively low yield levels. February began with a good deal of trading pausing in anticipation of the Fed meetings, and tax-exempt secondary purchases fell by 35% from the prior week. This dynamic has further slowed an already cash heavy market and light volume tends to have a tightening effect on already constrained spreads.
Corporate Bond Markets
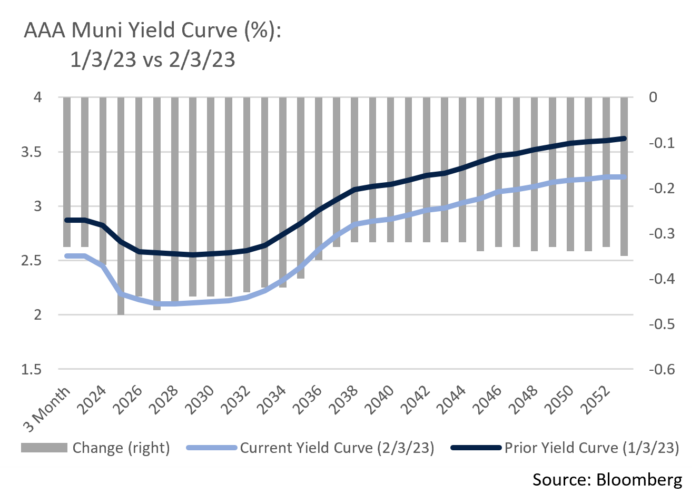
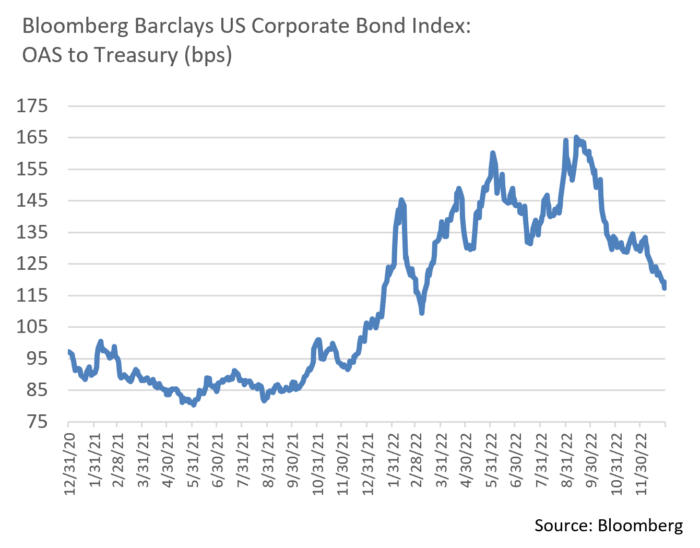
- Yields of 3.62% on the 5Yr UST remain lower than 1Yr USTs and only slightly higher than 2Yr issues, an indication that curve inversion persists but is moderating as economic signs become a bit more favorable. The 5Yr UST yield referenced above compares to 4.42% on 5-Year A Corporates and 4.17% for AA corporate credits. That said, credit spreads are near 9-month lows after reaching YTD highs back in October and are tighter than the one-year average in the 5-year portion of the high-grade corporate curve. Should UST rates normalize via front end yields moving lower over time, that portion of the Investment Grade curve should outperform.
- Demand for corporate credit remains strong and we see the solid market footing that has characterized early 2023 trading persisting. Deterioration of macro fundamentals would likely prompt a return of modest risk-off sentiment, although we do not anticipate returning to 2022 credit spread highs.
- A resurgence of Investment Grade primary market issuance was evident to begin 2023 after a Q4 2022 hiatus. January ended with $143.85 billion of new bonds hitting the market, the second highest total for the first month of the year on record. While we are encouraged by primary market vibrancy, some of the large banks were notably absent as they exited earnings blackouts. A favorable market indication was revealed by falling new issue concessions with demand for bonds, a drop in UST yields, and spread tightening creating a better backdrop for issuers. February supply is estimated at $100 billion, although we could see an uptick if today’s more positive issuance environment is sustained.
- Against this backdrop, YTD performance of investment grade bonds has been solid. High quality issues have performed very well, beating out their lower quality counterparts. While the AAA bond category represents the smallest percentage of the market, the highest quality issues returned +4.73% on the month, exceeding the broader Bloomberg US Corporate Bond Index return of +4.01%. High quality investment grade paper should do well moving forward, as we feel demand will remain strong with investors seeking a balance between yield and credit quality. Our quality bias leads us to remain steadfast in emphasizing credit selection.
Financial Planning Perspectives
2023 Tax Dichotomy: State Tax Hikes and State Tax Relief
We have been discussing a variety of state and federal income tax proposals since March 2021 (“Wealth Tax Momentum”), a review that was followed by updated policy briefs in April 2021 (“Shifting Tax Environment”) and September 2021 (“Massachusetts Estate Tax”). More recent developments are also noteworthy as outlined below.
The Massachusetts Millionaires’ Tax became the law of the Commonwealth effective January 1st and for the first time will create a graduated income tax regime. With the Bay State voters passing the constitutional amendment in November, those taxpayers with annual taxable income above $1M will now be taxed at an additional incremental rate of 4.0% (9.0% on all taxable income over $1 million). According to the Massachusetts Executive Office of Administration and Finance, the newly minted Millionaires’ Tax increase could increase revenues by as much as $1.2 billion annually.
Perhaps spurred on by successful passage in Massachusetts, and with a split Congress likely to preclude Federal high income tax hikes over the next two years, several states subsequently introduced their own tax proposals in early 2023. Seven Democratic leaning states (New York, Maryland, Washington, Hawaii, Illinois, Connecticut and California) introduced bills that would increase rates applied to long-term capital gains, dividends, and net assets. New York, for example, seeks an additional:
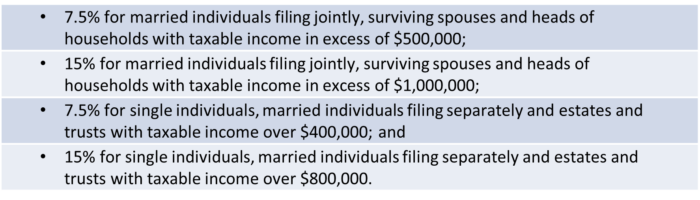
In Connecticut, measures have been introduced that would increase the top two personal marginal income tax rates to 7.20% and 7.49% (up from 6.90% and 6.99% respectively), create a 1% and 0.75% surcharge on net gains from the sale of capital assets for individuals in the top two income tax brackets, along with a host of other induvial and business tax increases.
 The opposite policy approach has been evident in other states, many of which are considered Republican leaning. According to the Tax Foundation, eleven states will have tax rate reductions starting January 1st (Arizona, Kentucky, Mississippi, Missouri, Nebraska, New Hampshire, North Carolina, Iowa, Idaho, and New York), while three of these states have moved from a graduated income tax to a flat tax (Arizona, Idaho, and Mississippi).
While federal individual tax law may not change significantly in the near term, it is important to keep an eye on the impact that state tax law changes may have and to keep in mind that current federal income tax rates are set to increase on January 1, 2026. The relevant provision of the 2017 Tax Cuts and Jobs Act is scheduled to sunset at that time.
At Appleton, we take great pride in the wealth management and financial planning services provided to our clients.
Is there someone you care about who might benefit from working with us, but you’re unsure how to make the introduction? If so, please let us know. We are happy to help.
Please contact your Portfolio Manager or reach out to: Jim O’Neil, Managing Director
617-338-0700 x775 | [email protected] | www.appletonpartners.com