


Insights and Observations
Economic, Public Policy, and Fed Developments
- The ongoing pandemic, and our attempts to contain and defeat the COVID-19 virus, should continue to dominate the financial markets for the foreseeable future. More than 100,000 Americans, and nearly 400,000 people globally, have lost their lives to this pandemic, a number that will sadly grow.
- One reason the pandemic is driving the market is that economic releases have been so bad as to defy comprehension. Retail sales fell through expectations of a -12% drop to a record -16.4%, prompting concerns on the report’s accuracy. ISM Non-Manufacturing collapsed, and while the headline reading of 41.8 beat expectations, it was due to a surge in the supplier delivery component driven by pandemic-related shipping delays. Meanwhile, the Bureau of Labor Statistics noted the headline unemployment rate of 14.7% is likely understated due to difficulties in capturing business failures, and will likely be revised higher. With the unprecedented size and speed of this downturn, even measuring the contraction has become difficult, making fundamental analysis challenging.
- That said, we have seen some encouraging signs in the latest economic releases that deserve attention. Boeing unexpectedly resumed production of its 737 Max, a development that should benefit upstream suppliers. While US existing home sales fell nearly 18% in April, new home sales unexpectedly rose 0.6%, a function of new supply being less constricted by the virus than existing homes. And while Manufacturing PMI remained in recession territory, it recovered modestly in May, implying the rate of contraction has slowed.
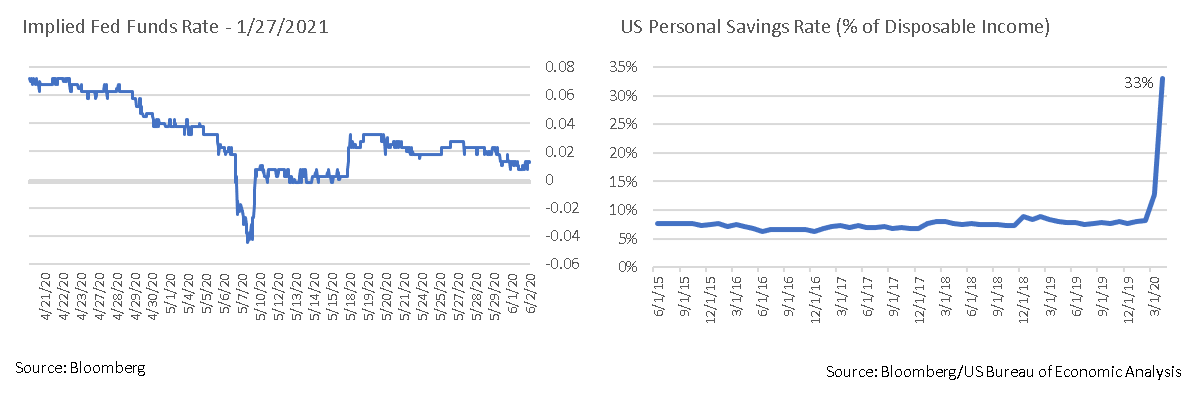
- April’s personal consumption drop of 13.2% coupled with a 10.5% rise in transfer payment-aided personal income fueled a savings rate increase from 12.7% to a whopping 33%. This will, depending on the course of the virus, either provide substantial dry powder for a V-shaped recovery, or cushion the effects of a lengthy and drawn out rebuilding. It is too early to call a bottom, but we see evidence the economy is no longer in free fall.
- The first GDP revision showed a headline reduction from -4.8% to -5.0%, but the underlying details were modestly encouraging. Consumption was stronger than originally measured, -6.8% vs. -7.6%, and Final Sales to Private Domestic Purchasers rose from -6.6% to -5.8%. That said, our expectations for a historically bad Q2 contraction of roughly a third remain unchanged, as small changes in the starting position will do little to mute the unprecedented half of economic activity.
- Trade hostility with China resumed as President Trump followed through on threats to halt US funding to the WHO over his belief they were under Chinese control – an action that will increase the organization’s dependence on China – as well as refused to certify Hong Kong’s independence after China-backed government crackdowns on protests. He did not terminate the Phase One trade deal, but when China responded by restricting US agricultural imports, a condition of that deal, termination of the agreement is looking increasingly likely. A resumption of trade hostilities and higher tariffs would further slow the economic recovery.
- After Fed Funds futures began to imply a negative Fed Funds Rate, Chairman Powell squashed concerns, indicating while nothing was off the table the Board was unanimous in their belief that negative rates were “not an attractive tool.” The Fed has been very careful not to surprise market interest rate policy expectations, and we believe Powell should be taken at his word. Should the Federal Reserve aim to enact negative interest rates, the move would likely be well telegraphed. By the middle of the month the markets had come around to our thinking, and expected rates remain positive.

From the Trading Desk
Municipal Markets
- Municipal yields ground lower in May. Extremely low US Treasury yields, healthy retail municipal demand (+$2.9B net fund inflows over 2 weeks ended 5/27), confidence building market support from the CARES Act and Municipal Liquidity Facility, as well as an expectation of further economic aid to states and municipalities more than offset dismal Q2 economic data and tax revenue weakness. Tax-exempt bonds staged an impressive rally, with 10Yr AAA municipals ending the month at 0.84% and 2Yrs at 0.16%, yields that broke through 2/29 levels.
- The rebound off March’s price lows has been dramatic. As we enter June, the Bloomberg Barclays Municipal Managed Money Short/Intermediate Index has returned 3.02% YTD. Technical factors have been favorable, with fund flows recently solidified and Citi Research expecting net negative municipal issuance of $5.8B over the next 3 months.
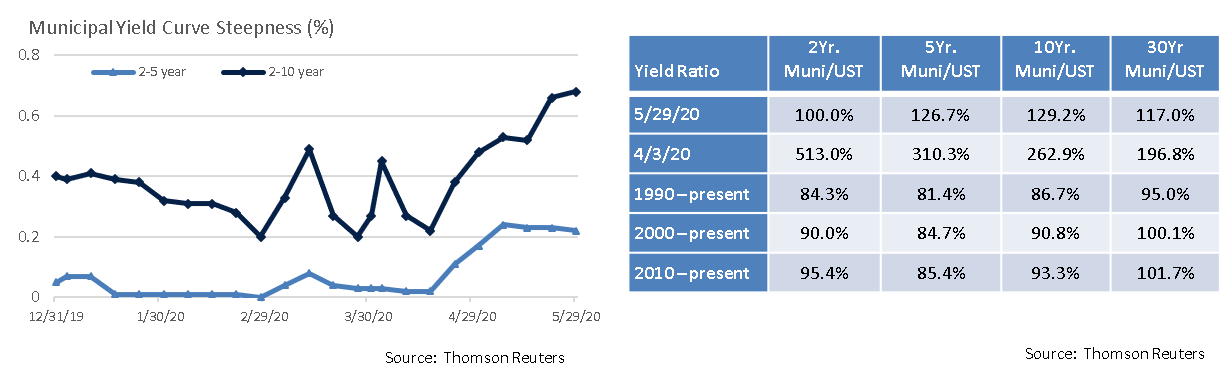
- Municipal curve structure is supportive of adding duration, as the 5/29 spread between 2s and 10s of 68 bps significantly exceeds that of 2s and 5s (22 bps). Curve steepness is now more pronounced than at any time since October 2018. In this environment, front-end exposure is challenging, although the upcoming deferred tax payment season may prompt money market selling and more attractive VRDN yields.
- We feel municipals still offer attractive relative value. While the dislocated ratios of March and April have predictably receded, 5Yr and 10Yr AAA muni/UST ratios of 126.7% and 129.2% respectively ended May well above long-term historic averages. This should provide a cushion for municipals.
Corporate Bond Markets
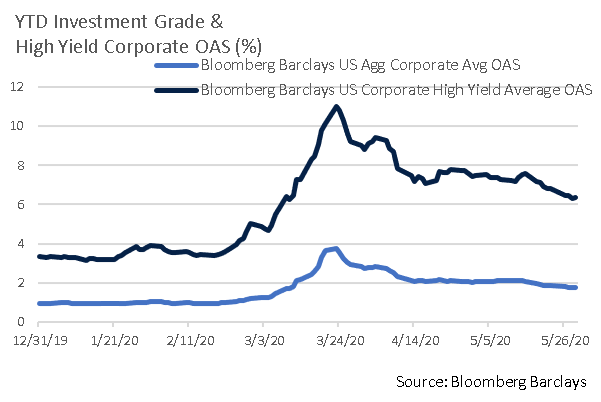
- The Federal Reserve buttressed the credit markets in late March when it announced that corporate bond buying would be part of its market support program introduced through the CARES Act. A Special Purpose Vehicle was established through which the Fed’s Primary and Secondary Credit Facilities would make loans and purchases. Initial funding was to be $50B for the Primary Market Facility and $25B for the Secondary, a “downpayment” on up to $750B in potential future market support. The mere availability of this backstop has helped drive corporate spreads tighter. In May we saw the facility utilized for the first time when the Fed purchased $1.3B of Investment Grade and High Yield ETFs.
- The Fed’s historic actions have helped maintain a favorable environment for corporate borrowing. The cost of financing is extremely low, and demand remains high. Investment Grade corporate issuance has been correspondingly robust. After another strong month, YTD issuance climbed over the $1 trillion mark, a milestone not typically reached until November. High Yield is following suit, with $150B coming to market over the first five months of the year.
- The current environment has been favorable for performance. Nonetheless, we remain credit vigilant and do not factor potential Fed support or other non-company specific elements into our proprietary research and credit ratings.
Public Sector Watch
Credit Comments
States Rework Budgets in the Face of Uncertain Revenue
Actions to stem the outbreak of COVID-19 have led to recession and a disruption in state finances, leaving budget officers scrambling to close near-term gaps. Aggregate state tax revenue declines for FY 2020 range from $71B1 to $185B2. FY 2021 also remains highly uncertain, with estimates ranging from $130B to $379B2.
Individual states are now reporting their own estimates, giving analysts a better picture of the economic impact.
Fortunately, most states entered this downturn with fortified “rainy-day” reserve funds. Nonetheless, they will likely need to also make other fiscal adjustments. It bears emphasizing that states have many tools at their disposal and management plans vary based on a multitude of unique factors.
- New York has identified $10.1B of potential aid cuts if revenues underperform estimates.
- Massachusetts is looking for ways to eliminate, reduce and delay costly tax breaks for corporations and very high-income households.
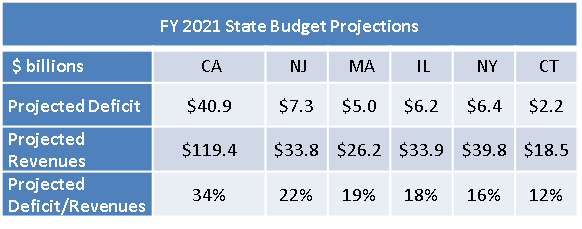
- California, with a combined expected deficit of $54B through FY 2021, is proposing expense cuts, revenue increases, reserve drawdowns, and reliance on federal funding.
- Pennsylvania is on the cusp of approving a five-month stop-gap budget that offers time to analyze revenue developments while also providing funding clarity for K-12 schools, higher education and debt service.
- New Jersey has frozen nearly $1B of spending, extended its fiscal year three months to get a better handle on revenue implications, and has warned of significant layoffs.
- Illinois is counting on voter approval of a graduated personal income tax structure, $5B in borrowing from the Municipal Liquidity Facility, and an additional $7B of anticipated, but not yet approved, federal aid.
While the current situation may appear bleak, the sector is extremely resilient. States have many budgetary options, including taxing authority. Financial flexibility and management strength are two credit characteristics we always evaluate. State issuers in which we are invested have taken positive, proactive fiscal steps and we are confident that they will be able to manage their budget challenges.
Timing Has Greatly Impacted Personal Income Tax Receipts
Recent headlines have drawn attention to a severe drop in April 2020 state personal income tax collections. Data from 25 states that report monthly collections indicates that April personal income tax revenues fell by an average of more than 50%. While economic activity has certainly dropped precipitously, timing is also a major factor.
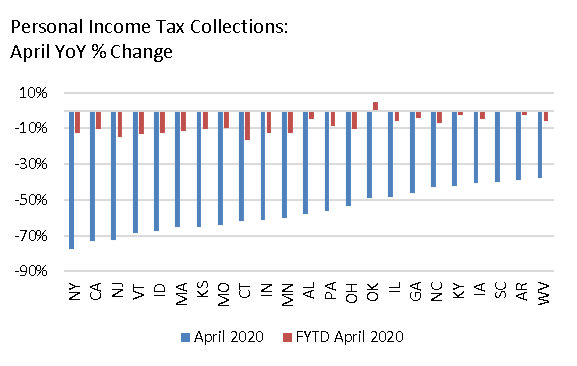
A large portion of these declines reflect a deferral of April tax receipts into the months preceding an extended July 15 tax filing and payment deadline that aligns with the IRS. As a result, a great deal of non-withholding tax revenue will be deferred into FY 2021 (most states conclude their fiscal years on June 30). Connecticut offers an excellent example.
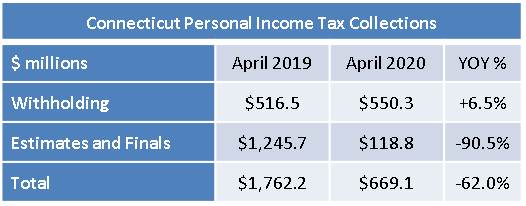
While a surge in unemployment will clearly impact future personal income tax collections, receipt of tax payments deferred from April to July will provide a badly needed boost to state coffers. Differentiating timing impact from lost revenue is an important distinction that we evaluate. Our analysis also assesses tools such as cash flow borrowing, the Fed’s Municipal Liquidity Facility, state reserves, internal liquidity sources, and deferral of non-essential projects. Times are tough, but we remain highly confident in the creditworthiness of the State GOs in which we are invested.
1. JP Morgan
2. Center on Budget and Policy Priorities
Strategy Overview
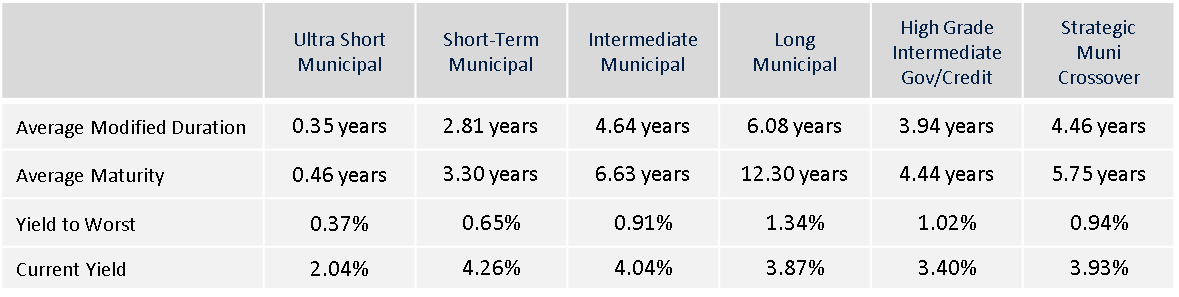
Portfolio Positioning as of 5/31/20
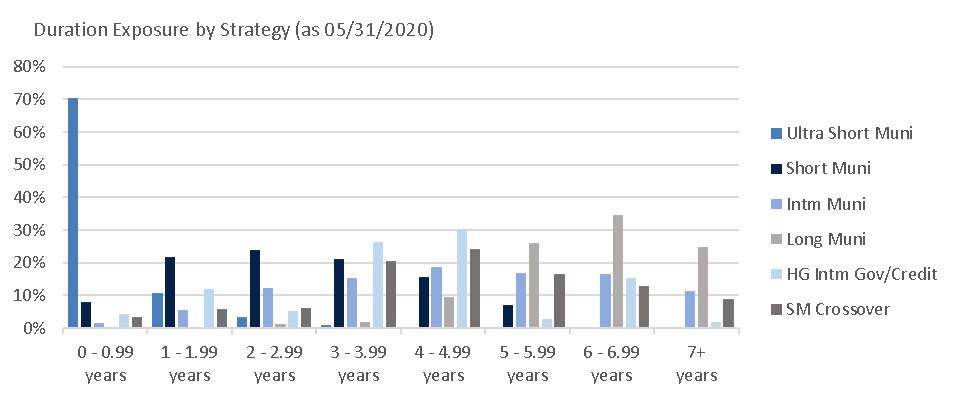
Duration Exposure by Strategy as of 5/31/20
Our Philosophy and Process
- Our objective is to preserve and grow your clients’ capital in a tax efficient manner.
- Dynamic active management and an emphasis on liquidity affords us the flexibility to react to changes in the credit, interest rate and yield curve environments.
- Dissecting the yield curve to target maturity exposure can help us capture value and capitalize on market inefficiencies as rate cycles change.
- Customized separate accounts are structured to meet your clients’ evolving tax, liquidity, risk tolerance and other unique needs.
- Intense credit research is applied within the liquid, high investment grade universe.
- Extensive fundamental, technical and economic analysis is utilized in making investment decisions.