


Insights and Observations
Economic, Public Policy, and Fed Developments
- While the June 14th Fed meeting gave us the “hawkish pause” the market was anticipating, investors severely underestimated the degree of hawkishness the Fed delivered. Year-end Fed Funds Rate expectations were lifted to 5.6%, a full two hikes higher than the previous “dot plot,” while 9 of the 18 members favored 2, 3 favored 3, and 1 favored 4 additional hikes in 2023. Only 2 members preferred leaving rates unchanged, down from 7 in March. We have long argued the Fed’s commitment to beat back inflation is ironclad and when they say they will hike, investors ought to listen. If there’s any uncertainty in this projection, we think it remains to the upside, and that hikes extending into 2024 are not out of the question. While rates were initially slow to respond, the policy-sensitive 2Yr UST ultimately breached 5% to levels not seen since 2007, and Fed Funds futures have gone from pricing 3 cuts by year-end to somewhat more than a single hike.
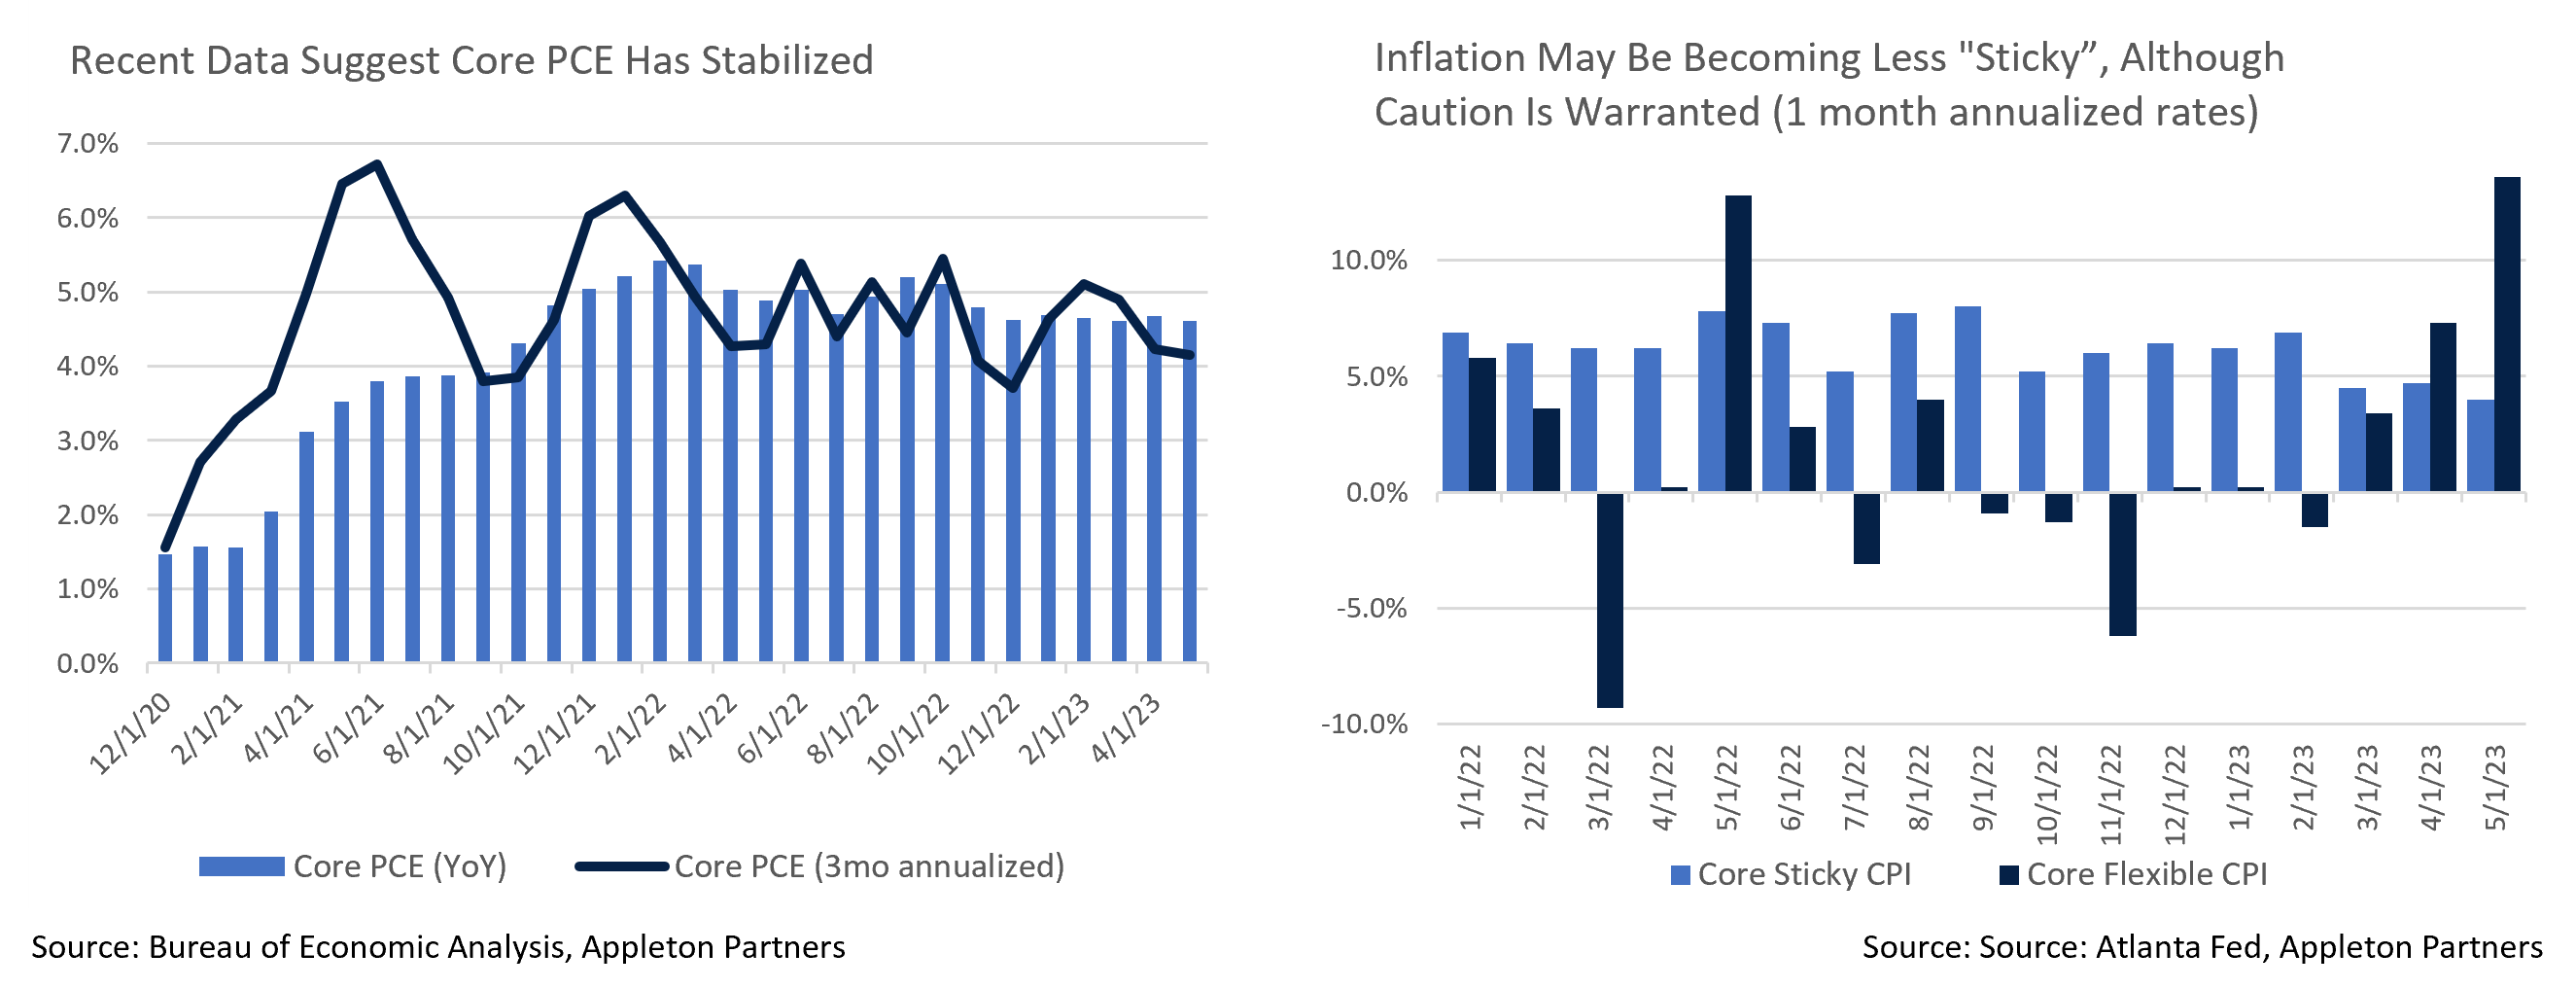
- While annual headline inflation continues to improve, much of that improvement comes from base effects as ultra-hot 2022 months drop out of the trailing year, and from a decline in energy prices. This means recent YoY progress is likely to stall. Monthly core inflation remains high and consistent with a 4-5% annualized rate. Media attention remains squarely on the former, whereas we expect the Fed to focus on the latter.
- Consumers remain unexpectedly resilient despite the Fed’s rate hike campaign. Retail sales, housing starts, and durable goods sales all posted strong upside surprises in May. Core durable goods spending may have been offset by a downward revision to April’s report, but this leaves a less volatile two-month period that still shows strong consumption. Similarly, the third revision of Q1 GDP reported the strongest quarterly consumer spending in two years. And, while June employment missed expectations, wage growth was still strong and hiring continues at a pace that does not suggest a stalling economy.
- While a slowdown in China has helped weaken global aggregate demand, the Chinese government is not prepared to accept slower growth, and state-controlled media have begun calling for stimulus. Commodity prices are stabilizing in response, and if stimulus is forthcoming this could become an external inflation source.
- While our base case remains that stubbornly high inflation will require further rate hikes, at least two data points could make us revisit this view. First, PPI purchaser inflation has slowed to near the Fed’s target. This may indicate businesses are attempting to “right size” inventory levels in advance of a slowdown. However, it also fell off a cliff in March during the SVB implosion and may represent a business reaction to an anticipated consumer spending freeze that never occurred. Second, while core inflation remains high, the Atlanta Fed’s Sticky Price CPI monitor shows the mix of core inflation tipping from sticky to flexible. If this continues, core inflation could drop faster than expected. We note that healthcare measurement differences between CPI and PCE that caused core CPI to overshoot core PCE in the first place appear to now be correcting and pulling CPI back down, and if so, we expect to see those normalize in the sticky price index as well.
- On a historical note, the LIBOR rate was reset for the last time on June 30th. In its peak, trillions of dollars of financial contracts were priced on this short-term lending rate before a rate-rigging scandal led to its demise. Its replacement, SOFR, is a market-based risk-free rate that should prove much less susceptible to manipulation.
From the Trading Desk
Municipal Markets
- Munis started the month of June well bid due in large part to technical factors, including strong inflows and a better-than-expected non-farm payroll number that pushed Treasury yields higher. Valuations were trending toward rich levels early in June with most maturities in the lower end of fair value with the 10Yr Muni/UST ratio at 70% and 30Yr ratio at 91%, although the very front end of the municipal curve was more expensive. June ended with 10Yr and 30Yr ratios of 67% and 90%, respectively.
- Bid wanted lists have been heavy, yet this inventory has not added much to our buying activity given that most bonds were either on the very front end of the curve or longer maturities with shorter call options. Liquidation of the FDIC bank portfolio continued in June, adding to supply although this has not had much impact on overall trading levels and price discovery.
- As we approached mid-month, the new issuance calendar remained muted, and volatility picked up ahead of the Federal Reserve meeting. Munis outperformed USTs in the aftermath of hawkish mid-year Fed commentary as market expectations began to anticipate more Fed Funds rate hikes this year.
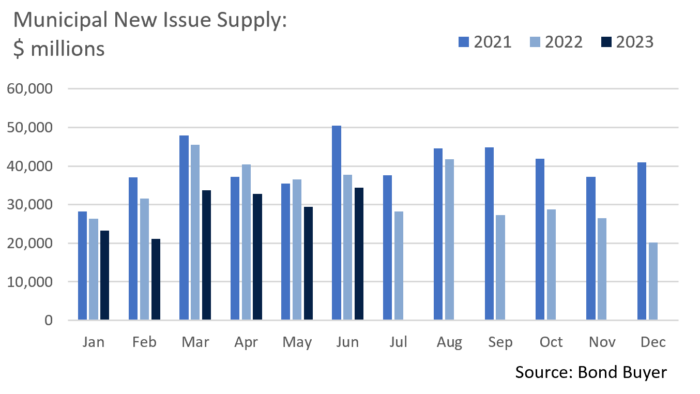
- With no clear impetus for increased new issue inventory, strategists at several of the major dealers have recently cut their supply forecast estimates. Overall municipal supply is down about 20% vs. the same time period of 2022, and constrained issuance has created a favorable technical dynamic that should continue to support market prices. We feel that net supply will remain stagnant until state and local governments begin to experience greater budget strains and/or interest rates recede. Most municipalities still have considerable federal aid on their balance sheets and many states have record high rainy-day funds that currently limit their need to access the public debt markets.
- New York City recently received federal approval to charge motorists driving into the city, a policy known as “congestion pricing.” The approval was needed before construction on the tolling could begin. We see this as creating a precedent that may spread to other major markets, positively impacting the revenue generating capacity of large bond issuers.
Corporate Bond Markets
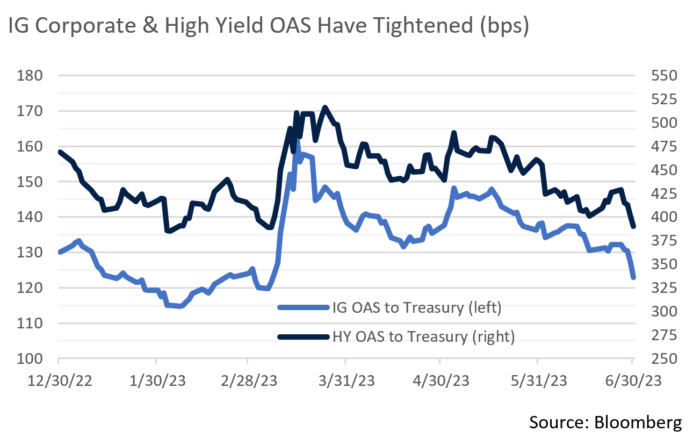
- The Investment Grade Credit rally that began in May trickled into June as spreads ticked towards YTD lows. That low (115bps OAS) was reached in early February and IG spreads have not come close since that time. That is until the OAS on the Bloomberg Corporate Bond Index rallied 8bps over the last few trading days to end the month and quarter at an OAS of 123bps. Much of this move can be attributed to more signs of American consumer resilience and sustained strong overall economic data, along with month-end rebalancing after an extended equity rally. Q2 earnings will be closely watched for signs of a weakening of these trends. Our view is that spreads have settled in close to a near-term bottom, although this is highly subject to change given volatile economic dynamics.
- High Yield has been one of the better performing asset classes with credit spreads falling close to their YTD lows of 390bps. While we do not invest in high yield issues, this market is a valuable source of credit intelligence. Like Investment Grade credit, High Yield credit is benefiting from surprising economic strength, and risk appetite among investors remains strong as a result.
- A strong bid for risk assets has encouraged high yield issuers to come to market, driving issuance up 37% YoY. Of the $92.7 billion in below investment grade new issues, $53.8 billion came to market in Q2, bond offerings that have collectively done very well. We do not see much room for spreads to go lower from here and see the high yield primary market providing sustained supply.
- According to Refinitiv Lipper, Investment Grade US Corporate Bond net fund flows were very strong in June at +$7.6 billion. So far this year, 66% of the weeks have produced net positive IG Credit fund flows, a sentiment indicator that is supportive of relatively tight spreads and firm price levels.
Public Sector Watch
Credit Comments
Impact of Remote Work on US Cities
- COVID-19 has had a profound impact on American society, including through an immediate and drastic surge in remote work. While a push for returning to the office has increased on-site presence over the past two years, remote work remains prominent and the reduction in remote work rates has largely stalled.
- Given an ability to work off-site, employee relocation towards the suburbs has accelerated, resulting in persistent urban office vacancies. Significantly reduced office presence has led to a broader decrease in economic activity in many US cities.
- Several data points are commonly used to monitor return to office trends, including the Back to Work Barometer published by Kastle Systems. This analysis tracks office building badge swipes and encapsulates 41,000 businesses across 47 states. According to this metric, office occupancy in major US markets has remained relatively constant at about 50% since the beginning of 2023. WFH Research has also found that fully paid work from home days fell drastically from pandemic crisis levels with the widespread availability of COVID vaccines before leveling off at about 30% in early 2022.
- A hybrid work schedule with fewer days spent in the office is expected to remain the new normal. Employers will continue to reexamine and adjust physical office space in response as leases renew, putting further pressure on office vacancies. Fortunately for municipal finances, many businesses are locked into long term leases and occupancy changes are generally slow, thereby giving cities time to adjust to stagnating revenue should urban business activity and property tax valuations come under pressure.
- While nearly all cities have felt the impact of remote work, several factors influence severity including local employment dynamics, industry composition, and commuting times, among others. These and other factors are integral to our fundamental analysis and help explain varying degrees of post-pandemic recovery among large cities.
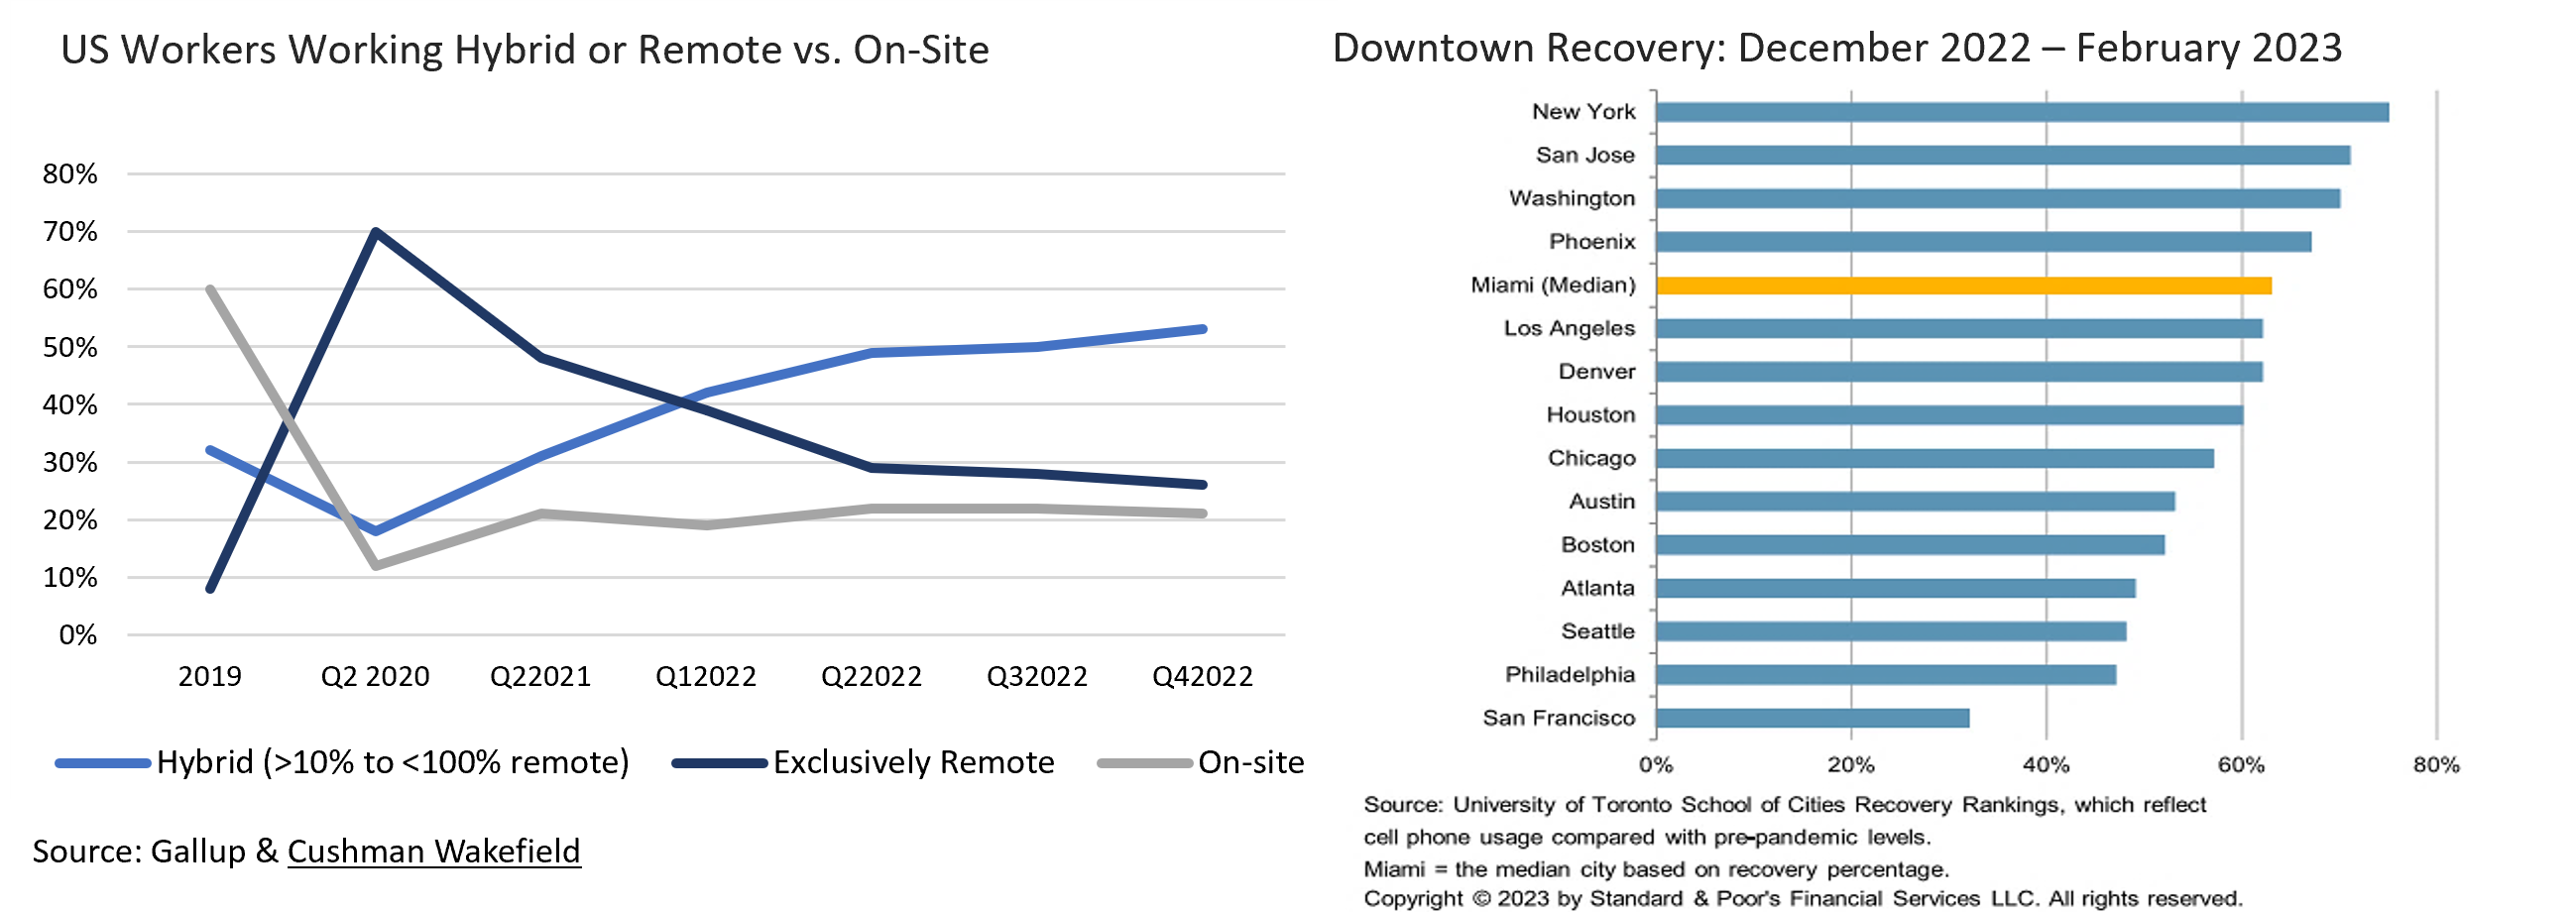
Two cities frequently making headlines in this regard are New York City and San Francisco.
New York City
| San Francisco
|
Strategy Overview
Composite Portfolio Positioning as of 6/30/2023
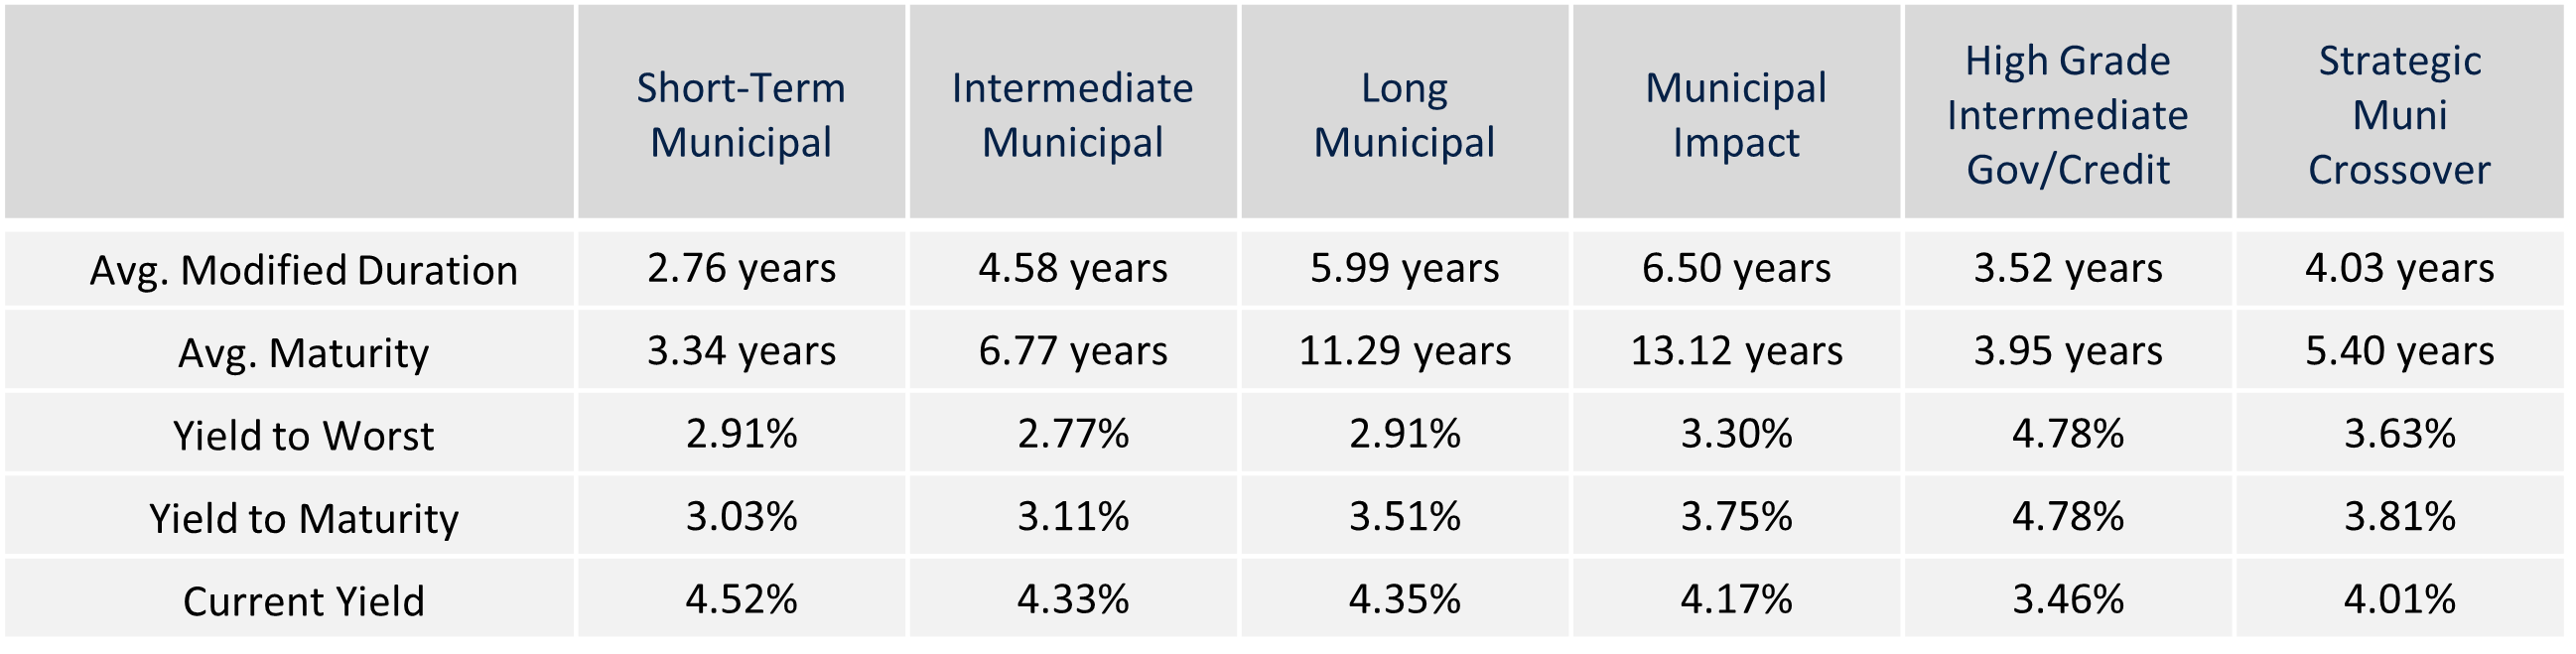
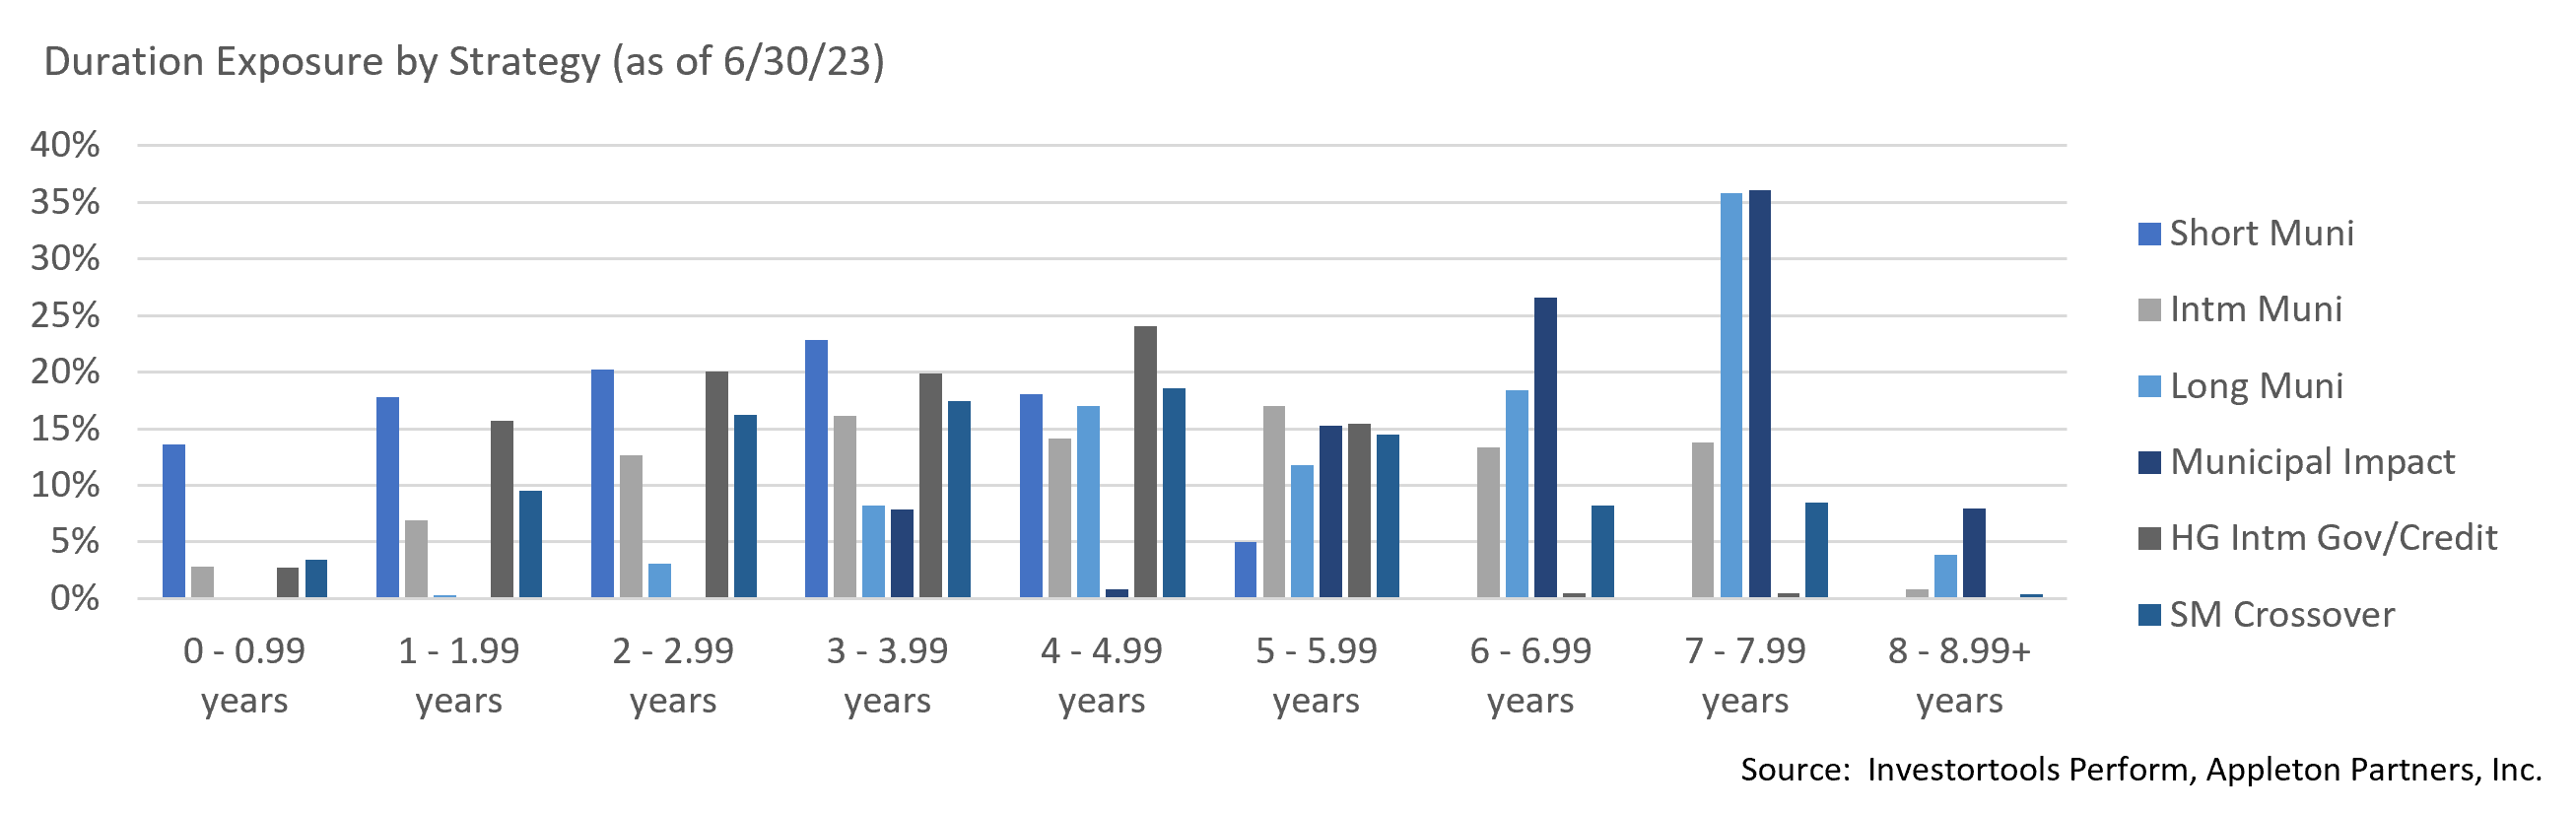
Duration Exposure as of 6/30/2023
The composites used to calculate strategy characteristics (“Characteristic Composites”) are subsets of the account groups used to calculate strategy performance (“Performance Composites”). Characteristic Composites excludes any account in the Performance Composite where cash exceeds 10% of the portfolio. Therefore, Characteristic Composites can be a smaller subset of accounts than Performance Composites. Inclusion of the additional accounts in the Characteristic Composites would likely alter the characteristics displayed above by the excess cash. Please contact us if you would like to see characteristics of Appleton’s Performance Composites.
Our Philosophy and Process
- Our objective is to preserve and grow your clients’ capital in a tax efficient manner.
- Dynamic active management and an emphasis on liquidity affords us the flexibility to react to changes in the credit, interest rate and yield curve environments.
- Dissecting the yield curve to target maturity exposure can help us capture value and capitalize on market inefficiencies as rate cycles change.
- Customized separate accounts are structured to meet your clients’ evolving tax, liquidity, risk tolerance and other unique needs.
- Intense credit research is applied within the liquid, high investment grade universe.
- Extensive fundamental, technical and economic analysis is utilized in making investment decisions.