


Insights and Observations
Economic, Public Policy, and Fed Developments
- Washington’s debt ceiling showdown might have dominated the news in May, but it ultimately proved to be a non-event. We became more confident in the outcome once President Biden and Speaker McCarthy stepped back and appointed a team of negotiators, and while both men’s public remarks continued to cause market gyrations, the eventual compromise passed with broad bipartisan support.
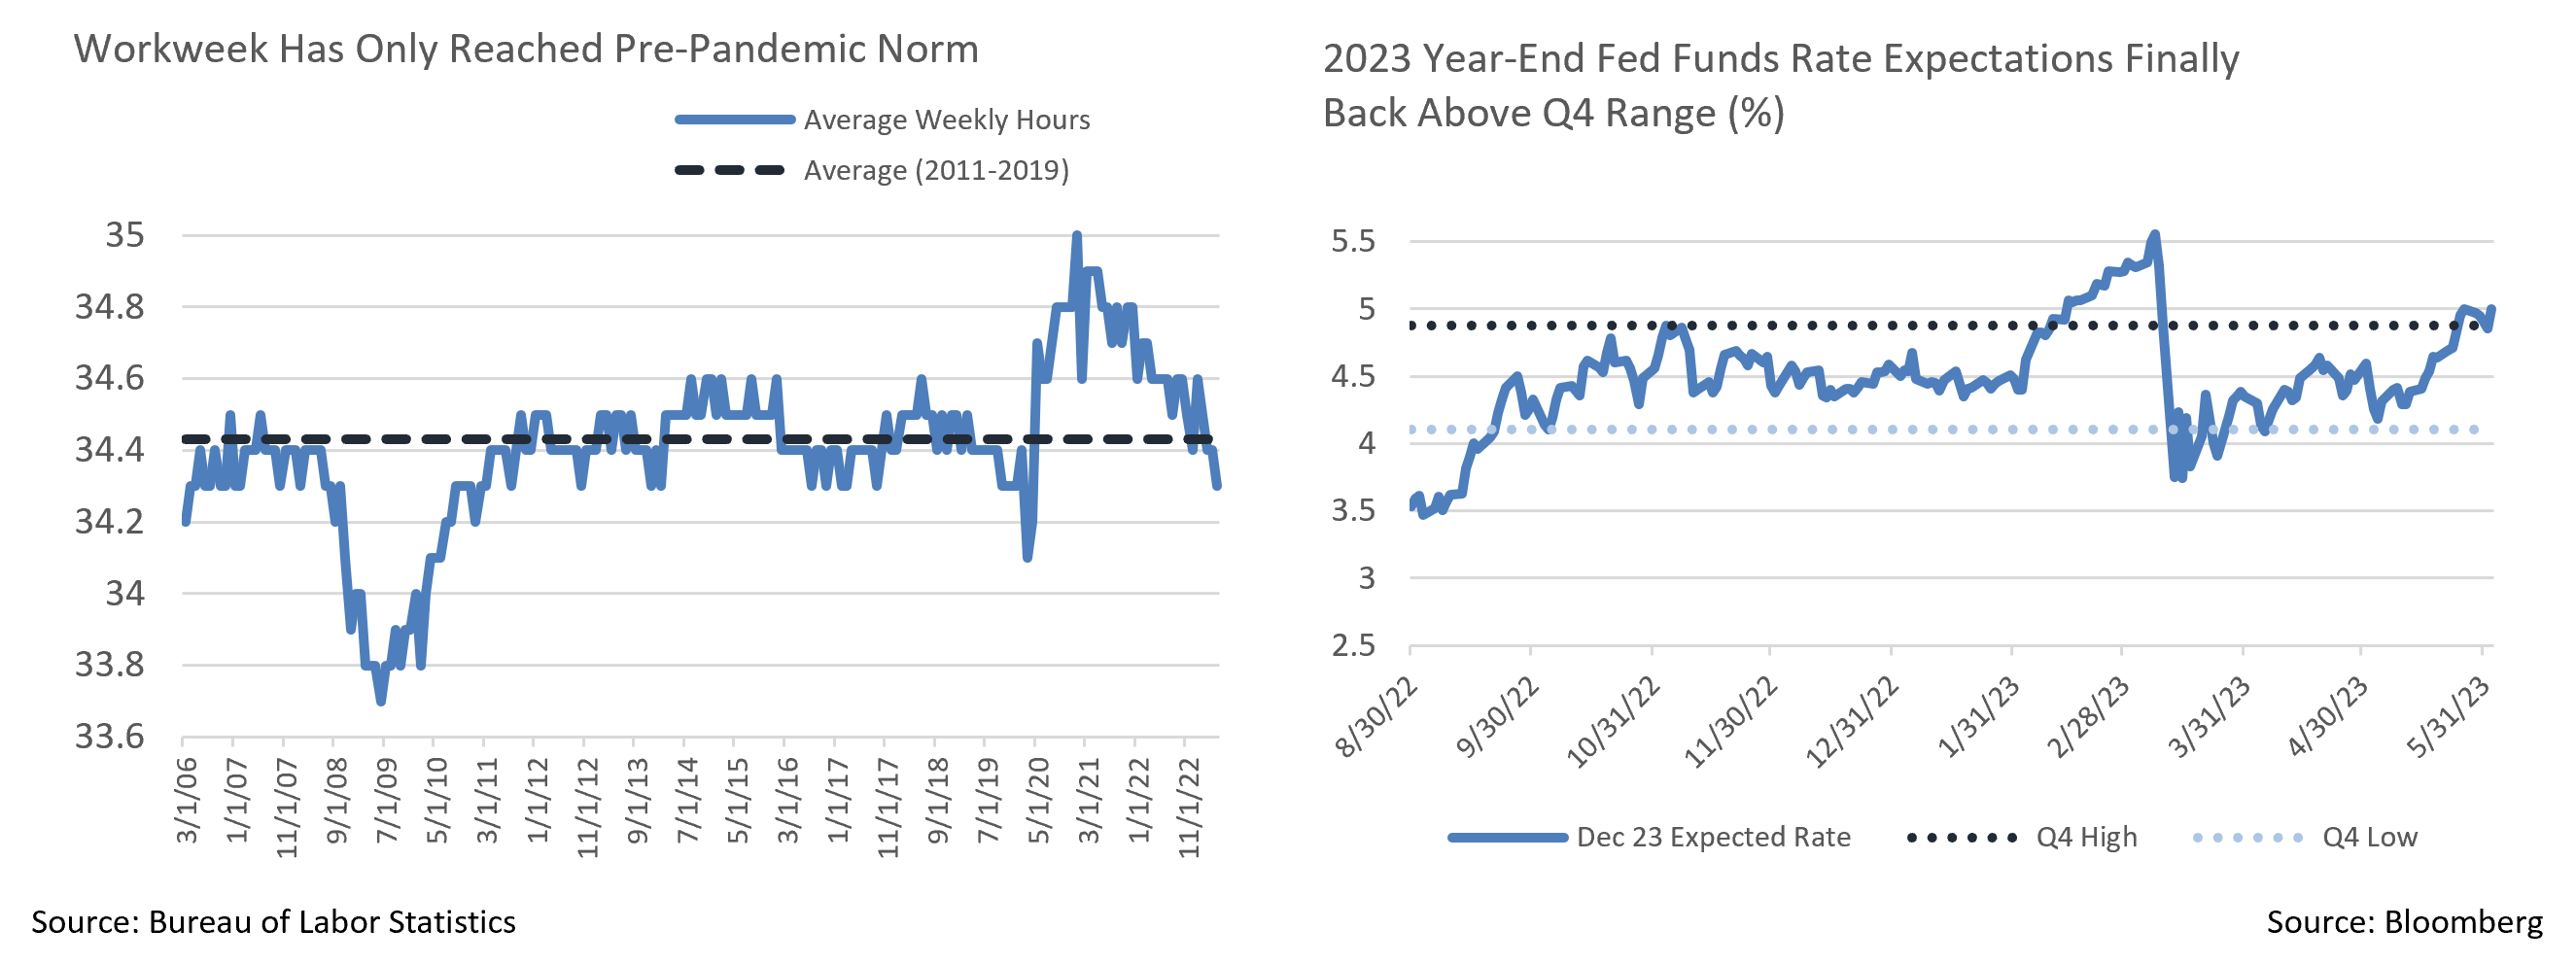
- This drama distracted from an important shift in market expectation concerning FOMC’s rate policy, however. At the start of the month, markets believed the FOMC hiking cycle was over and three rate cuts were likely before year-end. A hawkish litany of Fedspeak coupled with unexpected strength in economic releases shifted this consensus. At present, futures pricing suggests one more hike by July and then a reversal of that hike plus, possibly, a cut by December. This pulled up yields across the curve, with the policy-sensitive 2Yr UST rising about 50 bps and the 10Yr a more modest 20 bps. The market-implied year-end Fed Funds rate is now comfortably above the range of last fall and early spring. Commentary at the time widely attributed these increases to concern over default; we believe the recent shift reflected a change in expected Fed policy and renewed signs of economic strength.
- A pair of releases demonstrating this vibrancy were the retail sales and consumer spending reports. These followed a familiar pattern in May, where a superficially weak retail sales report (which was rather strong under the surface) lulled the markets before the consumer spending release called attention to that underlying strength. Headline retail sales came in at half the expected 0.8%. However, this series is very light on services spending, and both ex-autos and gas and “control group” sales (which feed GDP) handily beat expectations. Markets largely focused on the headline report, until the consumer spending report – which reflects services spending at actual weights – came in well above expectations. A surprise came with unexpectedly robust goods spending, which had been weak but mirrored an uptick in goods inflation in May’s CPI inflation.
- The inflation reports themselves also evidenced a healthy consumer. While PPI has returned to a range broadly consistent with price stability, the Fed’s preferred PCE measure remains uncomfortably high and has started to accelerate. Powell’s preferred “super-core” CPI measure meanwhile stands at about 4.5%, which we see as far too high to allow the Fed to ease their tightening campaign.
- May’s BLS employment report gave the Fed another reason to remain vigilant. The 339k newly created jobs were well over the consensus of 195k, making this the 14th consecutive beat. The report’s strength was widespread, and sustained growth in transportation and warehousing suggests economic softening is not imminent. While the average workweek fell a tenth, moderating some of this labor strength, it has only just returned to its pre-pandemic range. While some see this as evidence of a cooling economy, we disagree.
- May brought the market significantly closer to our internal Fed Funds forecast, but we still see differences. We expect at least one more hike, and the Fed to then hold rates steady through year-end and potentially beyond. The market consensus is for a June pause; we feel any further strength in June CPI and PPI could very well cause the Fed to hike on the 14th, and regardless of their policy decision, their year-end rate forecast is likely to be revised higher. This should cause further bear steepening and higher rates in the short term.
From the Trading Desk
Municipal Markets
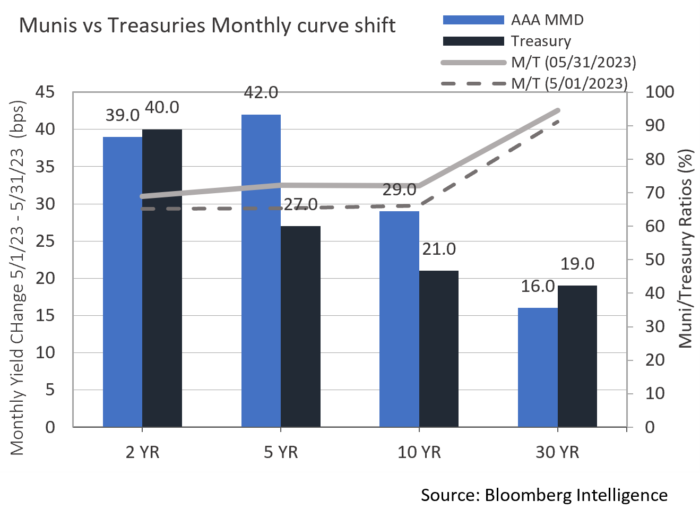
- May began with investors anticipating the results of a long awaited FOMC meeting. Municipal yields were mostly unchanged across the curve over the first week with a positive market tone. Modestly tightening credit spreads were driven by light supply and net cash inflows. The Fed’s decision to raise by 25 bps was not a surprise, and relative valuation remained steady as 5, 10 and 30-year Muni/UST ratios closed on May 4th at 69%, 69% and 91%, respectively.
- With the FOMC decision out of the way, municipal yields reacted more slowly than Treasuries due largely to positive technical factors. Cash inflows, pending June interest and maturity payments, and a lagging new issue market have offered support to municipal prices. June will have more than $45 billion coming back to investors, up from $28 billion maturing in May. Over the June – August period, it is expected that there will be a net negative supply of $33 billion, a dynamic that is keeping inventory relatively tight. Furthermore, new issuance in May fell 29% from the same period of 2022.
- Nonetheless, municipal yields began to rise as much as 36 bps by mid-month on the front end and 24 bps on 10-year issues. As the month moved on several large deals came to market along with a large bank list released for the bid, and the pressure of rising rates was felt. With more bonds available and new issue deals getting cheaper, we used the opportunity to invest at more desirable yields. Shorter maturity yields moved up more rapidly, 39 bps for the 2-year vs. 16 bps on 30-year AAAs. As the month closed, valuation modestly improved along the curve with 5, 10 and 30-year maturities bumping up Muni/UST ratios to 74%, 73%, and 92%, respectively.
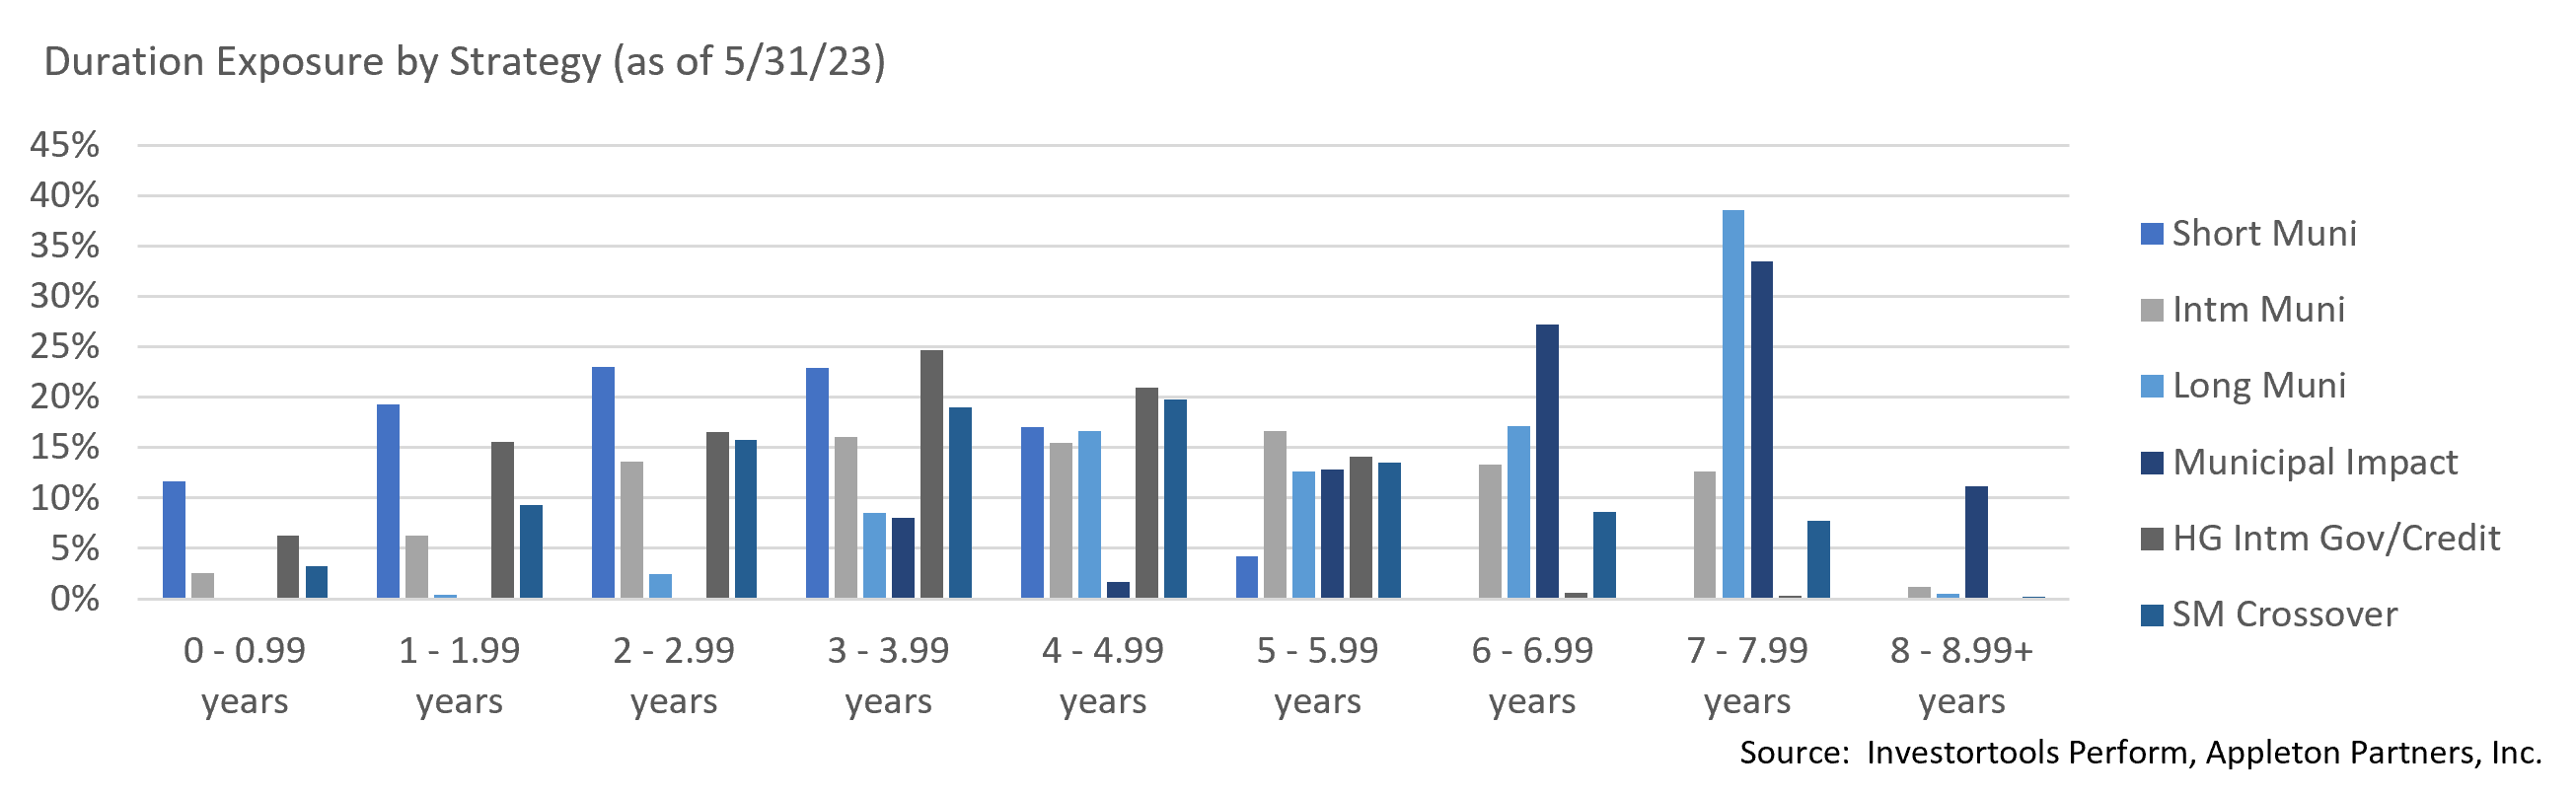
- As we look ahead, duration should be a strong driver of performance and we are working to maintain our targets while still retaining the flexibility to offset longer positions in the 10+ year portion of the curve with attractive shorter maturities.
Corporate Bond Markets
- After a slight widening trend over the first half of the month, Investment Grade spreads moved into rally mode to close it out. A month ending 138 OAS on the Bloomberg US Corporate Bond Index was just 2 bps from where we began, but roughly 10 bps off the peak. While the market has not fully recovered on a spread basis from March’s banking debacle, it feels as if a trading range has been found that should hold over the near term as investors await the Fed meeting in June.
- Driving this past month’s spread move was a slight flight to quality as higher quality outpaced lower quality bonds in the face of a back-and-forth debate over the debt ceiling and its associated risks. We expect high quality credit spreads to remain range bound over the near term with a breakout in either direction unlikely. Reaching the YTD tights seen in February is improbable in our view.
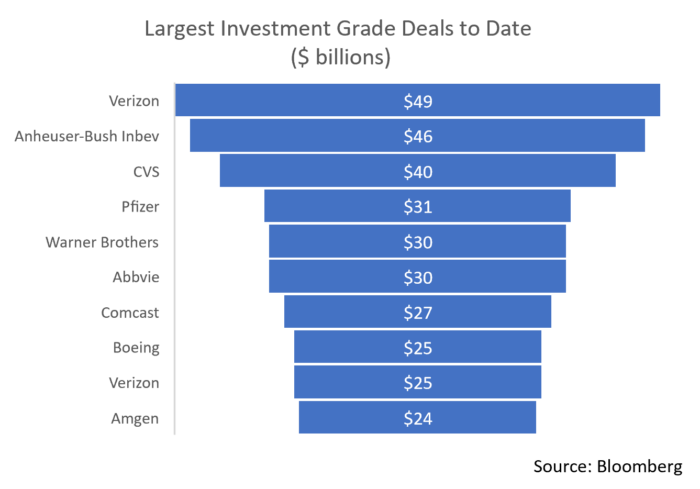
- May was well on its way to becoming 2023’s largest month of primary market issuance but missed the mark by about $2 billion. The $149.45 billion brought to market beat a consensus estimate of $135 billion, a result that speaks positively of IG market sentiment. Leading the charge was Pfizer’s $31 billion mega deal that is slated to fund a not yet approved acquisition of Seagen Inc. It was the fourth largest deal on record and the biggest since CVS came with $40 billion in 2018. It was priced accordingly, and deal concessions were unusually high for a solid A rated name. The deal’s attractive pricing created significant demand ($85 billion) and spreads quickly tightened in the secondary market once bonds were free to trade. The deal came off without issue, passing a meaningful test of investor appetite and the market’s ability to absorb substantial levels of debt. We see this as a positive as the end of Q2 approaches. June issuance is also expected to slow to $80 – $100 billion, a technical factor that should be supportive of IG Credit.
Public Sector Watch
Credit Comments
US Census Bureau Population Trends
The US Census Bureau’s recently reported 2022 population growth numbers revealed several new trends as well as some normalizing patterns. Population changes have drawn close attention amid the disruption of the pandemic era and data of this nature are often indicators of a geographic region’s fiscal performance, as well as underlying issuer specific credit fundamentals.
- The US population increased by about 1.25 million people in 2022 (+0.38%) following even weaker 2021 growth of +0.16%, the slowest pace in our history. The natural increase in the population, calculated as births less deaths, accounted for 20% of the increase, while immigration represented the remaining majority.
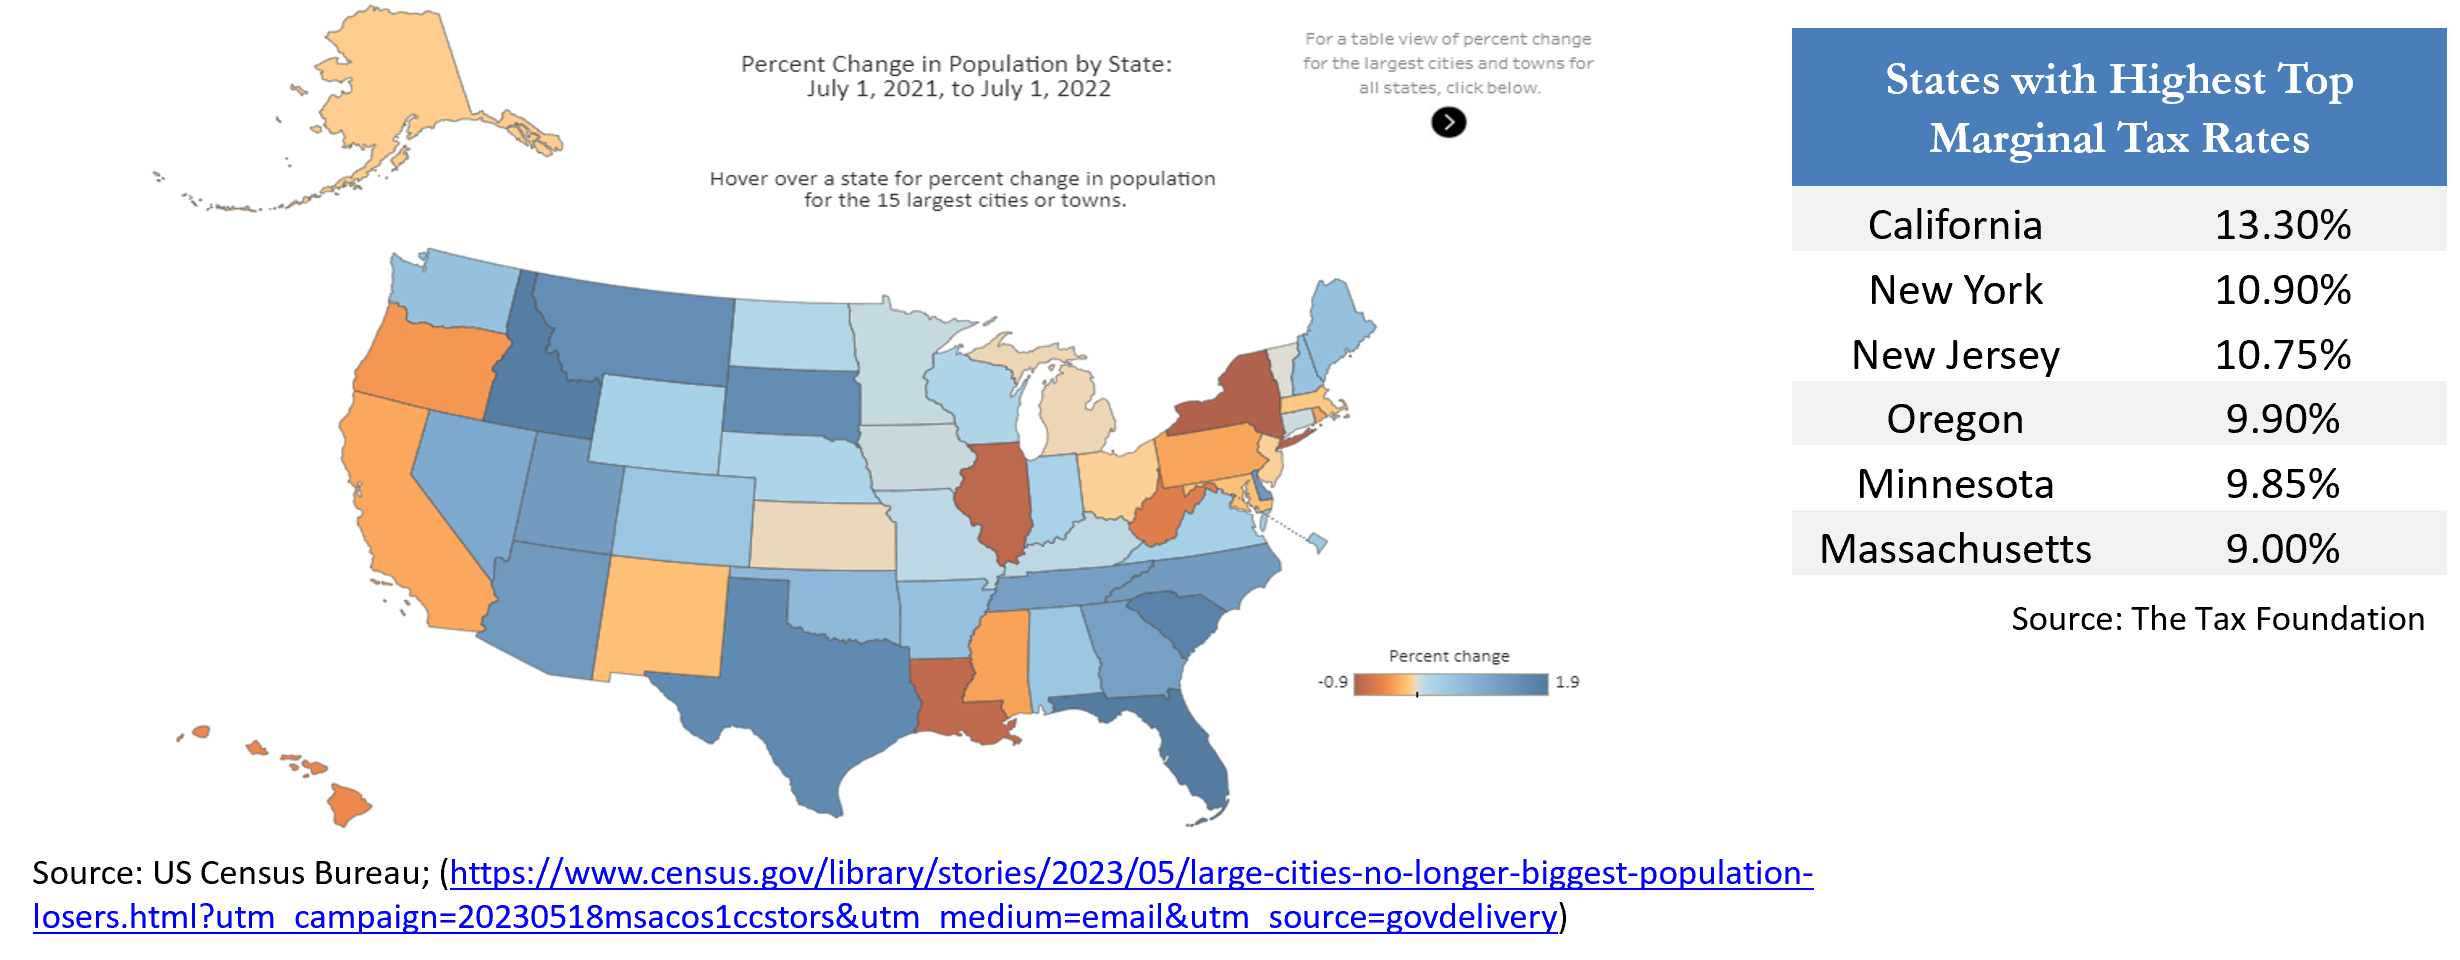
- Southern states recorded the largest gains. Texas and Florida, both of which have no state income tax, saw the largest population gains, adding 470,000 and 417,000 people, respectively.
- All 50 states and the District of Columbia posted positive net international migration, although population increases among the fastest growing states (Florida, Texas, North Carolina, South Carolina) were led by domestic migration.
- Domestic migration also prompted population declines in states such as California, New York, and Illinois. Each has a relatively high cost of living, and New York and California’s high individual income tax rates are also seen as precipitating factors.
- State population changes provide ample evidence that individuals are gravitating towards a lower cost of living. This shift has been evident for some time with COVID-19 accelerating the movement. However, it bears emphasizing that net migration levels slowed relative to 2021 and were more in line with long-term trends.
Population changes among US cities largely mirrored state trends. Much attention has been focused on the pandemic’s influence on remote work and population losses in some of our largest cities. However, this trend has slowed and shifted away from high profile coastal hubs such as Boston, Washington DC, and San Francisco. The rate of 2022 population losses were back in line with pre-pandemic patterns.
- In 2021, almost half of the fastest declining cities had 100,000+ populations, while that was reported in only three cases in 2022. Two of those, Jackson, MS and New Orleans, LA, were also negatively impacted by Hurricane Ida.
- While New York City had the largest absolute decline, losing 123,104 people from 2021 to 2022, that loss was 60% less than the prior year and not among the top fifteen cities as a percentage of population. Six of the fifteen fastest declining cities were in California.
- Of the fifteen fastest growing cities, ten are in the south with six in Texas and three in Florida. As with state data, this is largely attributed to a lower cost of living and no individual income taxes.
In assessing this data, we see several takeaways. Last year’s Census Bureau data was anticipated and consistent with longer-term demographic dynamics. Of significant importance is that the negative trend lines of 2021 were not sustained in 2022. Population outflows from large US cities slowed considerably in 2022 and we feel most of these urban areas will remain economically vibrant cultural centers. Our Credit Research team is carefully monitoring population dynamics and many other factors as we assess the underlying credit fundamentals of each bond issuer considered for investment.
Strategy Overview
Composite Portfolio Positioning as of 5/31/2023
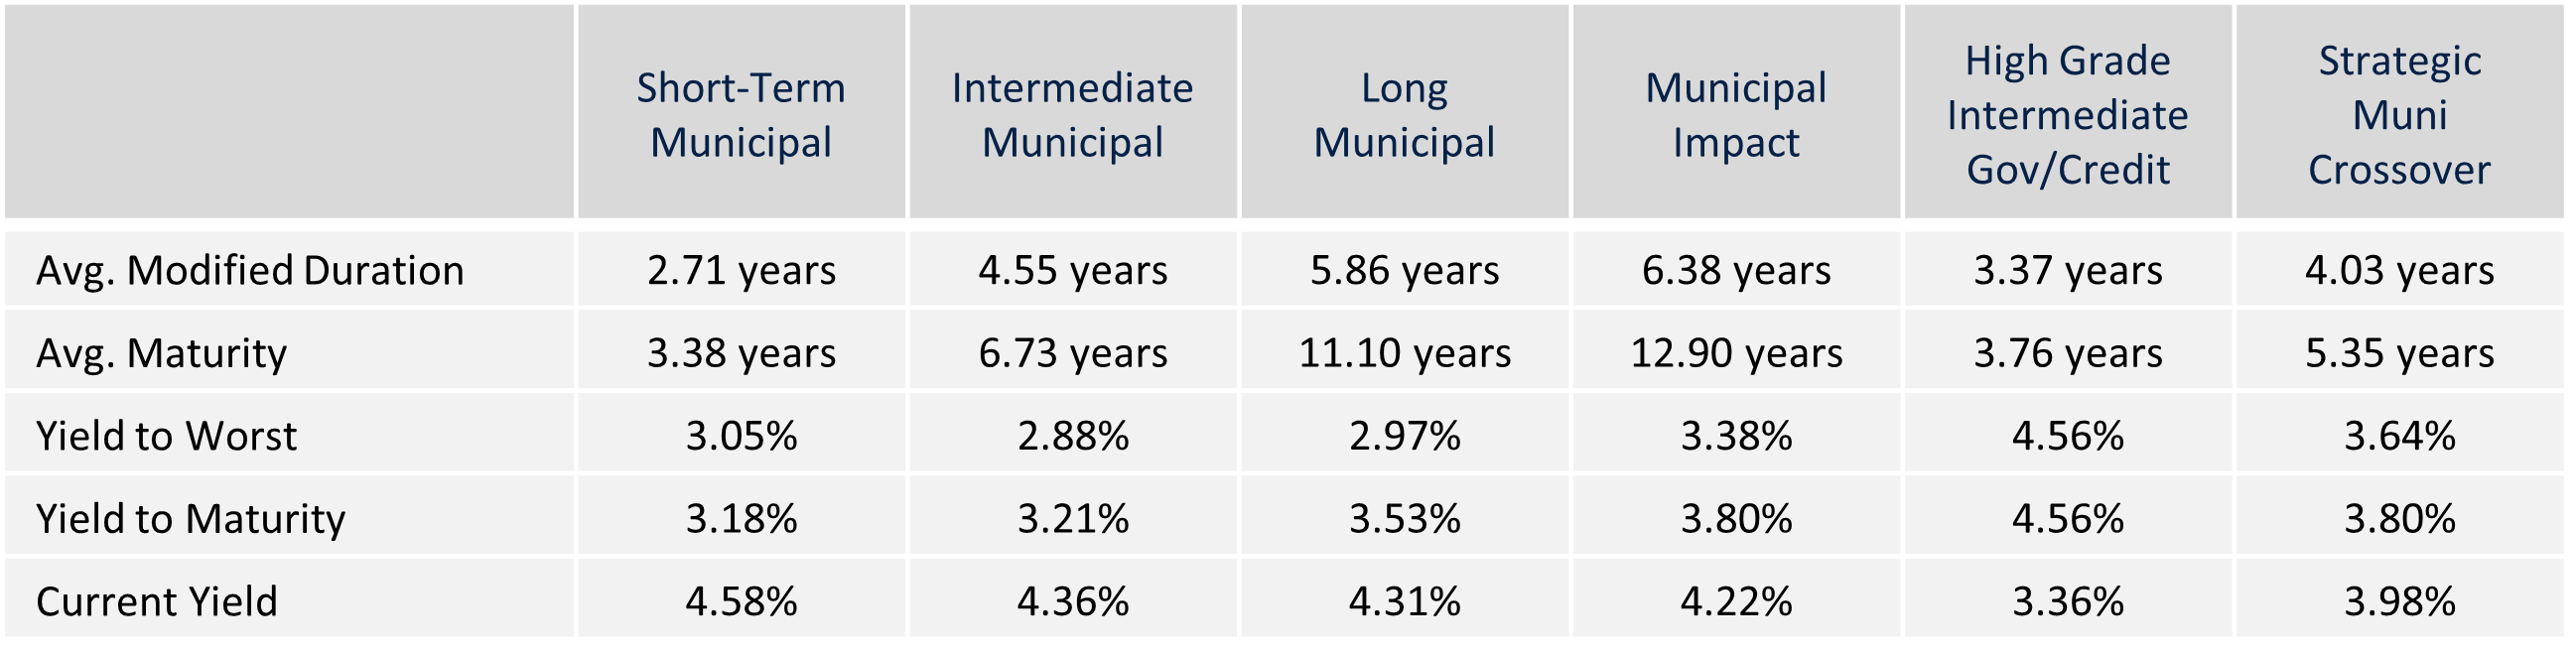
Duration Exposure as of 5/31/2023
The composites used to calculate strategy characteristics (“Characteristic Composites”) are subsets of the account groups used to calculate strategy performance (“Performance Composites”). Characteristic Composites excludes any account in the Performance Composite where cash exceeds 10% of the portfolio. Therefore, Characteristic Composites can be a smaller subset of accounts than Performance Composites. Inclusion of the additional accounts in the Characteristic Composites would likely alter the characteristics displayed above by the excess cash. Please contact us if you would like to see characteristics of Appleton’s Performance Composites.
Our Philosophy and Process
- Our objective is to preserve and grow your clients’ capital in a tax efficient manner.
- Dynamic active management and an emphasis on liquidity affords us the flexibility to react to changes in the credit, interest rate and yield curve environments.
- Dissecting the yield curve to target maturity exposure can help us capture value and capitalize on market inefficiencies as rate cycles change.
- Customized separate accounts are structured to meet your clients’ evolving tax, liquidity, risk tolerance and other unique needs.
- Intense credit research is applied within the liquid, high investment grade universe.
- Extensive fundamental, technical and economic analysis is utilized in making investment decisions.